Bankrolling THE BANKING SECTOR'S ROLE IN THE GLOBAL BIODIVERSITY CRISIS - Portfolio Earth

Page created by Ralph Steele
 
CONTINUE READING
Bankrolling THE BANKING SECTOR'S ROLE IN THE GLOBAL BIODIVERSITY CRISIS - Portfolio Earth
Bankrolling
THE BANKING SECTOR’S ROLE IN THE
GLOBAL BIODIVERSITY CRISIS
Bankrolling THE BANKING SECTOR'S ROLE IN THE GLOBAL BIODIVERSITY CRISIS - Portfolio Earth
The global       About us
ecosystem        portfolio.earth is a new initiative born out of rising
                 concerns that our finance sector is not taking the
                 human-induced sixth mass extinction seriously and

is rapidly
                 is actively providing capital to sectors that gov-
                 ernments and scientists agree is deemed harmful
                 to biodiversity.

                 portfolio.earth is a collaborative effort - a collective

approaching
                 of individuals working with others to take on the
                 finance industry’s role in contributing to the destruc-
                 tion of nature.

                 We aim to bring together diverse voices to amplify

a planetary
                 the incredible pressure that is mounting upon the
                 finance industry and its role in bankrolling extinction,
                 find new ways to tell this story, and double down on
                 the changes we need to see.

tipping point.
                 For more information please contact
                 info@portfolio.earth or visit our website
Bankrolling THE BANKING SECTOR'S ROLE IN THE GLOBAL BIODIVERSITY CRISIS - Portfolio Earth
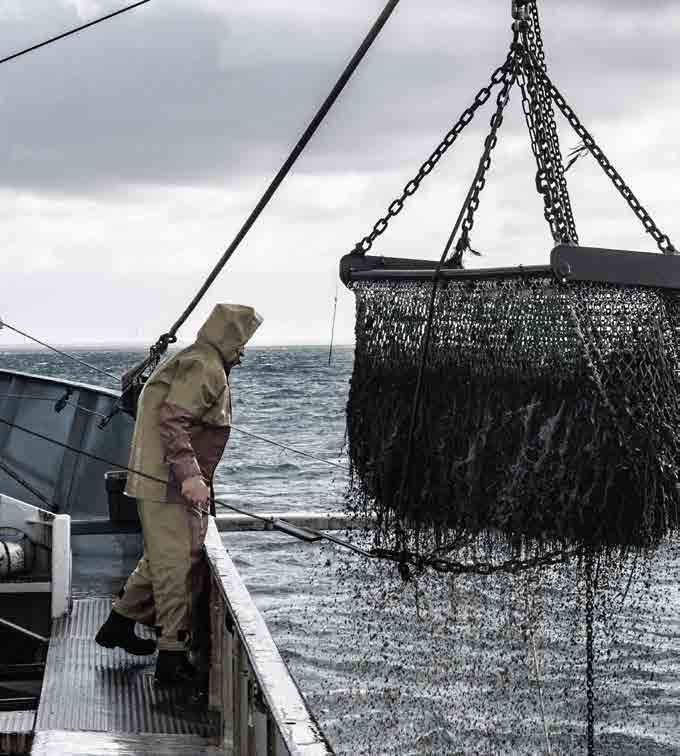
1.0    Executive Summary              4.2   Forestry, wood products &

Contents                              Pg, 6-11                             non-food forest commodities
                                                                           Pg, 54-59
                                1.1   The global
                                      biodiversity crisis            4.3   Mining for metals & minerals
                                      Pg, 12-13                            Pg, 60-65

                               2.0    Results                        4.4   Fossil Fuels
                                      Pg, 14                               Pg, 66-71

                               2.1    Finance of industry sectors    4.5   Infrastructure
                                      with biodiversity risks              Pg, 72-77
                                      Pg, 16-23
                                                                     4.6   Tourism
                               2.2    Bank policies limiting               Pg, 78-83
                                      biodiversity impacts
                                      Pg, 24-29                      4.7   Movement of goods
                                                                           and people
                                3     Rewriting of financing rules         Pg, 84-89
                                      Pg, 30-35
                                                                      5    Appendix: Methodologies
                                4     Sector-specific Results              Pg, 90-105
                                      Pg, 38-41

                               4.1    Food system
                                      (Fisheries & Agriculture)
                                      Pg, 42-53

 4    BANKROLLING EXTINCTION                                                                              BANKROLLING EXTINCTION   5
Bankrolling THE BANKING SECTOR'S ROLE IN THE GLOBAL BIODIVERSITY CRISIS - Portfolio Earth
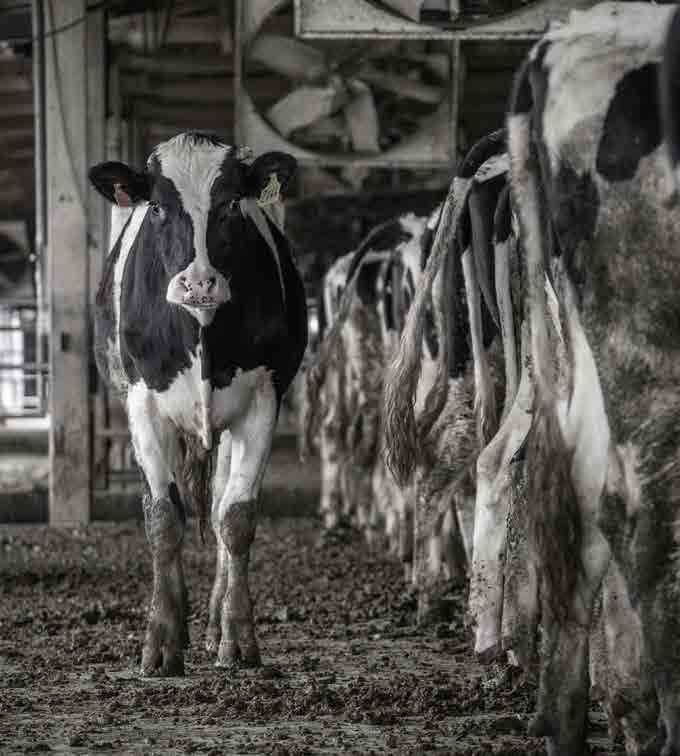
1.0 Executive Summary                     We are currently in the midst of a mass
                                          extinction event. Termed the ‘Anthropocene
                                          Extinction’, this is the first of its kind to be
                                          caused by humans. Humans have impacted
                                          nearly every corner of the planet and are
                                          approaching planetary boundaries which
                                          could take millions of years to recover
                                          from.1 Scientists are warning of ‘biological
                                          annihilation’.2 While governments and
                                          companies have been the focus of attention
                                          on this issue, actors in the finance sector
                                          have largely evaded scrutiny until recently.

                                          This report shows how banks are funding the     The financial sector is bankrolling the mass
                                          destruction of nature.                          extinction crisis, while undermining human
                                                                                          rights and indigenous sovereignty. This report
                                                                                          calls for:

                                          In 2019, the world’s largest banks invested    Banks to disclose and radically reduce their
                                           more than USD 2.6 trillion (equivalent to      impact on nature and stop finance for new
                                           Canada’s GDP) in sectors which govern-         fossil fuels, deforestation, overfishing and
                                           ments and scientists agree are the primary     ecosystem destruction.
                                           drivers of biodiversity destruction.

                                          Importantly, none of the banks assessed         Governments to stop protecting the role
                                          have chosen to put sufficient systems in        of banks in biodiversity destruction and
                                          place to monitor or measure the impact of       rewrite the rules of finance to hold banks lia-
                                          their loans on biodiversity, nor do they have   ble for the damage caused by their lending.
                                          comprehensive policies to halt it.

                                          Banks play a key role in a financial sys-       People everywhere to have a say in how
                                          tem that free rides on biodiversity, and        their money is invested, and a right to
                                          the regulators and rules which govern           stop banks from causing serious harm
                                          banks currently protect them from any           to people and planet.
                                          consequences.

   6              1.0 EXECUTIVE SUMMARY                                                           BANKROLLING EXTINCTION             7
Bankrolling THE BANKING SECTOR'S ROLE IN THE GLOBAL BIODIVERSITY CRISIS - Portfolio Earth
Why this matters                                           • Among the top ten banks assessed were also              Demands
      Human life, and our survival, depends on our            three Japanese banks (Mizuho Financial, Mit-
environment. Covid-19 has shown us that nature                subishi Financial and the Sumitomo Mitsui               The financial sector is bankrolling the mass extinction
underpins the functioning of our health, societies,           Banking Corporation).                                   crisis, while undermining human rights and indige-
and economies. The risk of these sorts of diseases         • BNP Paribas, HSBC, and Barclays were the three         nous sovereignty. This report calls for:
is kept in check by healthy environments and diverse          European banks within the top ten assessed.
species.3 When we radically alter nature, we risk          • A raft of Chinese banks, considered the world’s
creating the conditions in which pandemics emerge.            largest banks, can be found further down the list.       anks to disclose and radically reduce their
                                                                                                                      B
      Environmental destruction can no longer be           • Thirty-two per cent of all loans and underwriting       impact on nature and stop finance for new
seen as an unfortunate by-product of economic                 were associated with infrastructure, 25 per cent        fossil fuels, deforestation, overfishing and
development, quite the reverse. Our abusive relation-         with metal and mineral mining, and a further 20 per     ecosystem destruction.
ship with nature is contributing to an USD 8 trillion4        cent with fossil fuels.
hole in our global economy, rising unemployment,           • While food production (agriculture and fisheries)
and social inequality. Recent analysis suggests               was only connected to 10 per cent of all invest-        Governments to stop protecting banks’ role
that Covid-19 has reversed the global development             ments, this sector is considered to have the largest    in biodiversity destruction and rewrite the
agenda back 25 years in just 25 weeks.5 If we protect         impact on global biodiversity.7                         rules of finance to hold banks liable for the
nature, nature protects us.                                                                                           damage caused by their lending.
      Half of the world’s GDP is indebted to nature6       To prevent extinction, banks have to stop
and the services it provides such as pollination,          funding it.
water quality, and disease control. The dependence              Scientists and governments agree8 that the             eople everywhere to have a say in how
                                                                                                                      P
of many more industries is hidden in their supply          global food production system, forestry, mining,           their money is invested, and a right to stop
chains. Despite this, the global economy continues         fossil fuels, infrastructure, tourism, and the reloca-     banks from causing serious harm to people
to free ride on nature. For the first time, this report    tion of goods and people have all been identified as       and planet.
attempts to quantify the loans and underwriting            primary drivers of the global extinction crisis. Even
provided by some of the largest banks in the world         though many of these activities are carried out by         We cannot rely on banks to find the answer. We need
to companies operating in economic sectors that            companies, it is the finance sector that bankrolls and     a radical overhaul of how our financial system creates
governments and scientists agree are primary drivers       enables this activity.                                     liability, accountability, and responsibility to protect
of biodiversity loss.                                           Banks make decisions and invest in sectors            and restore nature.
      Most of the funding assessed (66 per cent) was       which governments and scientists agree are driving
related to activities that directly cause biodiversity     the devastation of our planet and societies. Recent
loss (e.g. fishing, mining) and 34 per cent was invested   scandals9 have shown that left to themselves, some
in companies which indirectly drive biodiversity loss      of the largest banks in the world will game the system.
(e.g. by driving demand along the supply chain from        Other actors within the financial sector are also likely
retail or processing and trading of commodities,           to be complicit in funding the sectors that drive the
such as construction which creates demand for              destruction of nature.
raw materials).                                                 Governments and scientists agree that to halt
      Analysis of bank policies regarding biodiversity     and reverse the current biodiversity crisis, nothing
has shown that not a single one of these banks has
sufficient systems in place to measure, report, and
radically reduce the environmental impacts caused
                                                           short of transformative change10 is required. Con-
                                                           crete action must come from all parts of our political
                                                           economy – banks, regulators, other financial actors,
                                                                                                                      The banks
by its finance activities. Put simply, the banks are
unwilling and have not prepared to tackle the bio-
diversity crisis.
                                                           the judiciary, governments, and citizens. All mem-
                                                           bers of the financial system, including those that
                                                           govern and drive it, must act to create the right rules,
                                                                                                                      are unwilling
Other key findings of the banks assessed
in this report include:
                                                           responsibilities and culture to halt and reverse the
                                                           decline of nature.
                                                                The current climate, Covid-19, and ecological
                                                                                                                      and have not
• On average, each of the 50 banks included in the
   research were linked to finance with biodiversity
   risk to the tune of USD 52 billion each. This ranges
                                                           crises are radicalising communities and activists.
                                                           The scrutiny the finance industry and other eco-
                                                           nomic actors are facing about their contribution is
                                                                                                                      prepared to
   from more than 210 billion for the largest investor
   to 1.3 billion for the smallest.
• The top three of the 10 banks with the largest
                                                           mounting (see Notable Examples of Recent Scrutiny
                                                           in Section 3). In limited cases, banks and the finance
                                                           industry have begun to respond by measuring their
                                                                                                                      tackle the
   exposure to biodiversity risks were headquartered
   in the USA. Around 26 per cent of all loans and
   underwritings by the 50 banks were linked to
                                                           exposure. New approaches to biodiversity loss dis-
                                                           closure11 and new initiatives such as the Finance for
                                                           Biodiversity Banking pledge12 have been launched
                                                                                                                      biodiversity
   Bank of America, Citigroup and JP Morgan Chase.
   Wells Fargo, another American bank, was the
   fifth largest investor in industry sectors with high
                                                           recently. These developments are being watched
                                                           and cautiously welcomed. But they are no substitute
                                                           for urgent transformative action from banks and the
                                                                                                                      crisis.
   biodiversity risks.                                     governance system they operate in.

8               1.0 EXECUTIVE SUMMARY                                                                                           BANKROLLING EXTINCTION                   9
Bankrolling THE BANKING SECTOR'S ROLE IN THE GLOBAL BIODIVERSITY CRISIS - Portfolio Earth
FIGURE 1: LOANS AND UNDERWRITING BY BANKS LINKED TO DIRECT AND INDIRECT BIODIVERSITY IMPACT RISKS 2019, (MILLION USD)
AND PERCENTAGE OF FINANCE AT RISK OF BIODIVERSITY IMPACTS COMPARED TO TOTAL ASSETS 2019, (MILLION USD)

      INDIRECT VS TOTAL ASSETS             DIRECT VS TOTAL ASSETS                                                                                                                                 INDIRECT (MILLION USD)           DIRECT (MILLION USD)

                                                                                                                                                                                                                           0

                                                                                                                                                                                                                                              0
                                                                                                                                                                                     0

                                                                                                                                                                                              0

                                                                                                                                                                                                                       00

                                                                                                                                                                                                                                              00
                                                                                                                                                                           0

                                                                                                                                                                                   00

                                                                                                                                                                                           00
                                                                                                                                                                            0
                                       %
                %

                                                                                                                                                                                                                     0,

                                                                                                                                                                                                                                            0,
                                                                                                                                 0%
                                                         0%

                                                                               0%

                                                                                                     0%

                                                                                                                          0%

                                                                                                                                                                                 0,
                                                                                                                                                                         ,0

                                                                                                                                                                                         0,
                                    .0
             .0

                                                                                                                                                                                                                    20

                                                                                                                                                                                                                                         25
                                                                                                                                                                       50

                                                                                                                                                                                10

                                                                                                                                                                                         15
                                  10
            12

                                                                                                                               0.
                                                       8.

                                                                             6.

                                                                                                   4.

                                                                                                                        2.

                                                                                                                                                                   0
                                                                                                                                           BANK OF AMERICA

                                                                                                                                              CITIGROUP

                                                                                                                                           JP MORGAN CHASE

                                                                                                                                           MIZUHO FINANCIAL

                                                                                                                                             WELLS FARGO

                                                                                                                                             BNP PARIBAS

                                                                                                                                       MITSUBISHI UFJ FINANCIAL

                                                                                                                                                 HSBC

                                                                                                                                             SMBC GROUP

                                                                                                                                              BARCLAYS

                                                                                                                                           GOLDMAN SACHS

                                                                                                                                           CRÉDIT AGRICOLE

                                                                                                                                           MORGAN STANLEY

                                                                                                                                            BANK OF CHINA

                                                                                                                                        ROYAL BANK OF CANADA

                                                                                                                                          SOCIÉTÉ GÉNÉRALE

                                                                                                                                           DEUTSCHE BANK

                                                                                                                                       TORONTO-DOMINION BANK

                                                                                                                                            CREDIT SUISSE

                                                                                                                                              SANTANDER

                                                                                                                                              ING GROUP

                                                                                                                                      CHINA CONSTRUCTION BANK

                                                                                                                                              UNICREDIT

                                                                                                                                 INDUSTRIAL AND COMMERCIAL BANK

                                                                                                                                      AGRICULTURAL BANK OF CHINA

                                                                                                                                 BANCO BILBAO VIZCAYA ARGENTARIA

                                                                                                                                             BPCE GROUP

                                                                                                                                                 UBS

                                                                                                                                               NATWEST

                                                                                                                                              RABOBANK

                                                                                                                                                 DBS

                                                                                                                                           INTESA SANPAOLO

                                                                                                                                        LLOYDS BANKING GROUP

                                                                                                                                       OVERSEA-CHINESE BANKING

                                                                                                                                       CRÉDIT MUTUEL CIC GROUP

                                                                                                                                  COMMONWEALTH BANK OF AUSTRALIA

                                                                                                                                       NATIONAL AUSTRALIA BANK

                                                                                                                                               DZ BANK

                                                                                                                                          NORINCHUKIN BANK

                                                                                                                                          STATE BANK OF INDIA

                                                                                                                                           BANCO DO BRASIL

                                                                                                                                             CIMB GROUP

                                                                                                                                              BRADESCO

                                                                                                                                          MALAYSIAN BANKING

                                                                                                                                            BANK MANDIRI

                                                                                                                                              SBERBANK

                                                                                                                                           STANDARD BANK

                                                                                                                                              HDFC BANK

                                                                                                                                         SHIN FINANCIAL GROUP

                                                                                                                                              FIRSTRAND

10               1.0 EXECUTIVE SUMMARY                                                                                                                                                                             BANKROLLING EXTINCTION            11
Bankrolling THE BANKING SECTOR'S ROLE IN THE GLOBAL BIODIVERSITY CRISIS - Portfolio Earth
1.1 The Global
Biodiversity Crisis
                                             The planet is in the midst of a major                The world’s flora and fauna continue to be in              A significant amount of biodiversity loss is
                                                                                            rapid decline. Three-quarters of the planet’s land         driven by unsustainable business practices financed
                                             mass extinction event – the first of           surface and two-thirds of its ocean areas are signifi-     by banks and investors and fuelled by growing
                                                                                            cantly altered. Only 13 per cent of ocean and 23 per       global demand for products. Banks are not being
                                             its kind caused by humans, and one             cent of land areas are still classified as wilderness.13   held accountable.
                                                                                                  Many international agreements have tried but               It has been estimated that unsustainable prac-
                                             which is threatening the biological            not succeeded to halt and reverse biodiversity loss.       tices result in a loss of ecosystem services of between
                                                                                            Notable examples include biodiversity targets set          USD 4 and 20 trillion every year from land-use
                                             annihilation of life on our planet. Banking    ten years ago in Aichi (2010), the World Summit on         change alone.17 Industry sectors with particularly
                                                                                            Sustainable Development and the United Nations             high biodiversity impacts include food production
                                             and finance practices are contributing         General Assembly endorsement of the Global Biodi-          (fisheries, aquaculture and agriculture), mining and
                                                                                            versity Target held 18 years ago, and the establish-       the extraction of fossil fuels, infrastructure, tourism,
                                             significantly to this. To date, their impact   ment of the Convention on Biological Diversity by the      and the movement of people and goods around the
                                                                                            Rio Earth Summit 28 years ago.                             world via transport and logistics.
                                             on biodiversity remains unchecked.                   The United Nations recently found that not one             Under increasing public pressure to reduce the
                                                                                            of the twenty Aichi Global Biodiversity Targets agreed     impacts of global supply chains, companies, and to
                                                                                            in 2010 have been met.14                                   a much lesser extent banks, have begun to adopt
                                                                                                  The present extinction rate of species is up         largely voluntary policies to not engage or fund some
                                                                                            to 10,000 times higher than the background rate.15         of the practices with the worst biodiversity and cli-
                                                                                            This is why scientists argue the earth is undergoing       mate change impacts (such as deforestation to make
                                                                                            its sixth major mass extinction event in its 4.5 billion   space for palm oil, soy and beef, or refusing loans
                                                                                            year history. The current Anthropocene Extinction          for coal, oil and gas activities in fragile eco-systems
                                                                                            is the first such event caused by a single species,        such as the Arctic).
                                                                                            humans, consciously destroying the biodiversity and              However, many of these promises to protect
                                                                                            ecosystem services it relies on for its own survival. It   nature have been woefully insufficient to stabilise
                                                                                            is also up to humans, and the systems they operate         biodiversity and have not been implemented suc-
                                                                                            within, to reverse it.                                     cessfully or widely enough to reduce the rate at which
                                                                                                  More recently, the Covid-19 virus has demon-         human industrial activities are driving extinction. They
                                                                                            strated that the fate of our health, societies, and        do not represent the transformative change of our
                                                                                            economies are inextricably linked to nature. Radically     economic system required to maintain biodiversity
                                                                                            altering nature and reducing biodiversity risks creat-     and the ecosystem services. Brazil is currently the
                                                                                            ing conditions in which pandemics emerge.                  only country where lender environmental liability
                                                                                                  In 2019, hundreds of experts around the world        allows for the financial institution to be held liable for
                                                                                            contributed to the largest assessment of global            environmental harm caused by the borrower, strictly
                                                                                            biodiversity ever carried out. The Intergovernmental       and without limitation.18
                                                                                            Science-Policy Platform on Biodiversity and Eco-                 Banks have shown reluctance to take respon-
                                                                                            system Services (IPBES) analysed more than 15,000          sibility for the impacts of their lending portfolio
                                                                                            scientific publications and government sources and         elsewhere. For instance, the CEO of Goldman Sachs
                                                                                            concluded that one million animal and plant species        argued in January 2020 that the bank should not
                                                                                            were now threatened with extinction, more than ever        decline to work on deals with companies that lack
                                                                                            before in human history. More than 40 per cent of          environmental credentials. He said: “Should we draw
                                                                                            amphibian species, almost 33 per cent of reef-form-        a line and say we will not raise money for a company
                                                                                            ing corals, and more than a third of all marine mam-       that is a carbon company, a fossil fuel company? And
                                                                                            mals are considered threatened today.                      the answer to that is, we’re not going to do that, we’re
                                                                                                  The IPBES report, endorsed by scientists and         not going to draw a line.”19 Considering the unwilling-
                                                                                            governments, found current policies and conserva-          ness of banks to participate in a necessary, rapid shift
                                                                                            tion efforts are insufficient to protect and sustainably   of the banking system, legislative measures such as
                                                                                            use nature. In order to ensure the long-term sustain-      lender environmental liability will have to be a major
                                                                                            ability of our resources and protect biodiversity, the     component of any such transformation.
                                                                                            authors of the IPBES report concluded that “trans-
                                                                                            formative changes across economic, social, political
                                                                                            and technological factors” are needed.16

                                                                                            The United Nations recently found that not one of the
                                                                                            twenty Aichi Global Biodiversity Targets agreed in
                                                                                            2010 have been met.

 12     1.1 THE GLOBAL BIODIVERSITY CRISIS                                                                                                                       BANKROLLING EXTINCTION                   13
Bankrolling THE BANKING SECTOR'S ROLE IN THE GLOBAL BIODIVERSITY CRISIS - Portfolio Earth
2

Results   Bankrolling
Bankrolling THE BANKING SECTOR'S ROLE IN THE GLOBAL BIODIVERSITY CRISIS - Portfolio Earth
2.1 Finance of
Industry Sectors with
   Biodiversity Risks
                         The 50 banks included in this research report
                         were identified by portfolio.earth and consist
                         of the world’s largest banks, as well as other
                         banks known to operate in regions of particular
                         importance to biodiversity.

                         Quantification of the Value of Finance                       Among the banks included in this analysis are
                         Provided by Banks to Companies                         20 European banks (linked to 36 per cent of the total
                         Operating in Sectors with Biodiversity Risks           finance with risk of biodiversity impact identified in
                              The consultancy Profundo used the Refinitiv       this report), 18 banks in the Asia Pacific region (24.7
                         database (formerly known as Thomson Reuters            per cent), 8 in North America (38.7 per cent) and
                         Eikon) to identify and calculate corporate loans,      two each in South America (0.4 per cent) and Africa
                         project finance, general corporate purposes finance,   (0.1 per cent). Forty-four of the banks are amongst
                         share issuance and bond issuance for 72 business       the largest 100 in the world by total assets, while
                         sectors, industry groups and industries identified     the rest are located in key regions of particularly
                         by portfolio.earth as being linked to biodiversity     high biodiversity.
                         impact risks.
                              The business sectors included are from the        The Top Ten Banks
                         Thomson Reuters Business classification (TRBC).        • From the top ten banks, infrastructure received the
                         The loans within the business sectors were then           largest percentage of finance, followed by the metal
                         matched to key human activities and drivers the           and mineral mining sector, and fossil fuels. Tourism
                         Intergovernmental Science-Policy Platform on Biodi-       and the forestry sector accounted for the smallest
                         versity and Ecosystem Services (IPBES)20 identified       percentages of the identified finance.
                         as fuelling the global biodiversity crisis.            • W ithin the top ten, Japanese banks provided
                                                                                   significantly more finance to infrastructure and
                         These, slightly adapted, sectors are:                     mining-related industries than their counterparts
                         • Food system and agricultural commodities                headquartered in Europe and the USA.
                         • Forestry and non-food forest commodities             • T he three European banks within the top ten
                         • Metal and mineral mining                                invested comparatively heavily in the food sector,
                         • Fossil fuels                                            while the USA banks provided slightly more finance
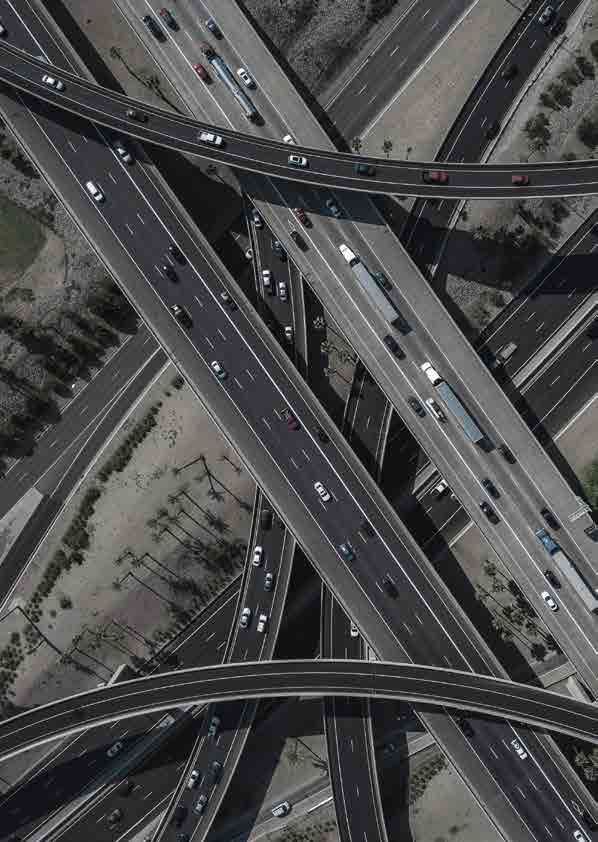
                         • Infrastructure                                          on average to companies within the transportation
                         • Tourism                                                 and logistics sector than banks from other regions.
                         • Relocation of goods and people

 16    2.0 RESULTS                                                                        BANKROLLING EXTINCTION                 17
Bankrolling THE BANKING SECTOR'S ROLE IN THE GLOBAL BIODIVERSITY CRISIS - Portfolio Earth
Radically
altering nature,
we risk creating
the conditions
in which
pandemics
emerge.

18   2.0 RESULTS   BANKROLLING EXTINCTION   19
TABLE 1: OVERVIEW OF INCLUDED BANKS BY TOTAL FINANCE AT RISK OF HAVING BIODIVERSITY IMPACTS (MILLION USD)                             FIGURE 2: HUMAN DRIVERS OF BIODIVERSITY LOSS AS PERCENTAGE OF AT-RISK BANK FINANCE

                                                                                                                                       100%
 COUNTRY                              REGION                               NUMBER OF BANKS                   TOTAL FINANCE AT                                                                                                                                                                            F

 (HEADQUARTERS)                                                                                              RISK IN 2019              90%                                                                                                                                                               T

                                                                                                                                                                                                                                                                                                         R
                                                                                                                                       80%
 USA                                  North America                        6                                 877,804                                                                                                                                                                                     F
                                                                                                                                       70%
                                                                                                                                                                                                                                                                                                         F

                                                                                                                                       60%
 Japan                                Asia Pacific                         4                                 384,256            100%
                                                                                                                                                                                                                                                                                                         M

                                                                                                                                       50%                                                                                                                                                               IN
                                                                                                                                90%
 France                               Europe                               5                                 314,739                   40%
                                                                                                                                80%
                                                                                                                                       30%
 UK                                   Europe                               4                                 258,036            70%
                                                                                                                                       20%

                                                                                                                                60%     10%
 China                                Asia Pacific                         4                                 196,276
                                                                                                                                50%     0%
                                                                                                                                                 BANK OF        CITIGROUP     JP MORGAN         MIZUHO         WELLS      BNP PARIBAS   MITSUBISHI         HSBC      SMBC GROUP    BARCLAYS
 Canada                               North America                        2                                 133,040                             AMERICA                        CHASE          FINANCIAL       FARGO                       UFJ
                                                                                                                                40%                                                                                                     FINANCIAL

                                                                                                                                30%
 Spain                                Europe                               2                                 84,848                           FORESTRY & NON-FOOD                                                         RELOCATION OF                           FOOD PRODUCTION AND
                                                                                                                                                                                            TOURISM
                                                                                                                                              FOREST COMMODITIES                                                          GOODS & PEOPLE                          AGRICULTURAL COMMODITIES
                                                                                                                                20%
 Switzerland                          Europe                               2                                 77,802                            90%
                                                                                                                                                                                            METALS & MINERAL
                                                                                                                                 10%          FOSSIL FUELS                                                                INFRASTRUCTURE
                                                                                                                                                                                            MINING
                                                                                                                                                80%
 Germany                              Europe                               2                                 75,191              0%
                                                                                                                                          BANK70%
                                                                                                                                               OF            CITIGROUP      JP MORGAN          MIZUHO           WELLS       BNP PARIBAS       MITSUBISHI          HSBC       SMBC GROUP       BARCLAYS
                                                                                                                                          AMERICA                             CHASE           FINANCIAL         FARGO                            UFJ
                                                                                                                                                                                                                                              FINANCIAL
 Netherlands                          Europe                               2                                 72,597                            60%

                                                                                                                                                50%
 Italy                                Europe                               2                                 56,222                    FIGURE 3: PERCENTAGE OF FINANCE LINKED OF DIRECT AND INDIRECT BIODIVERSITY RISKS BY GEOGRAPHIC REGION

                                                                                                                                                40%
                                                                                                                                        90%
 Singapore                            Asia Pacific                         2                                 30,734                             30%
                                                                                                                                        80%
                                                                                                                                                20%
 Australia                            Asia Pacific                         2                                 13,656
                                                                                                                                        70%
                                                                                                                                                10%

 Brazil                               South America                        2                                 10,703                     60%      0%
                                                                                                                                                                 AFRICA                 ASIA & PACIFIC             EUROPE                 NORTH AMERICA            SOUTH AMERICA
                                                                                                                                        50%
 Malaysia                             Asia Pacific                         2                                 10,360
                                                                                                                                                                                          AVERAGE OF % DIRECT                   AVERAGE OF % INDIRECT
                                                                                                                                        40%
 India                                Asia Pacific                         2                                 6,984
                                                                                                                                        30%

 South Africa                         Africa                               2                                 3,428                      20%

                                                                                                                                         10%
 Indonesia                            Asia Pacific                         1                                 2,597
                                                                                                                                          0%
 Russia                               Europe                               1                                 2,270                                            AFRICA                ASIA & PACIFIC                     EUROPE                 NORTH AMERICA               SOUTH AMERICA

 South Korea                          Asia Pacific                         1                                 1,362                            AVERAGE % OF DIRECT                       AVERAGE
                                                                                                                                                                                          AVERAGE OF %INDIRECT
                                                                                                                                                                                                  % OF DIRECT                       AVERAGE OF % INDIRECT

20         2.0 RESULTS                                                                                                                                                                                                                               BANKROLLING EXTINCTION               21
FIGURE 4: AVERAGE VALUE OF FINANCE LINKED TO DRIVERS OF BIODIVERSITY LOSS FOR BANKS
                                                                                                                       IN KEY REGIONS (2019, MILLION USD) AVERAGE PERCENTAGE OF FINANCE PER DRIVER OF
                                                                                                                       BIODIVERSITY FOR BANKS IN KEY REGIONS
Type of Biodiversity Impact                               Regional and Sector Themes
       Finance linked to the drivers of biodiversity      • On average, North American banks invested USD
loss was classified as having either direct or indirect      126 billion each in industry sectors linked to bio-
impacts on biodiversity. For instance, gold mining           diversity impacts. This was 2.7 times the USD 47
                                                                                                                       40,000      30,000       20,000      10,000         0
is considered to be at risk of having direct impact          billion of finance provided on average by each of
while the use of gold in the electronics industry may        the European banks, and 3.5 times the USD 36
                                                                                                                                                                                      INFRASTRUCTURE
indirectly impact biodiversity due to the value chain        billion provided on average by each of the Asian
demands of the commodity.                                    and Pacific banks.
       Comparing percentages of direct and indirect       • The highest percentage of loans and underwriting
impacts on biodiversity in relation to the total assets      was allocated to infrastructure in four of the five
of the banks within specific geographic regions:             geographic regions.
• Banks in Africa and the Asia Pacific Region invested   • In Africa, finance for mining of metals and minerals
                                                                                                                                                                                 METALS & MINERAL MINING
   more heavily in industries linked to direct impacts       sectors was especially strong, receiving more than
   than banks headquartered in North America or              a third of all investments by the included banks
   Europe.                                                   headquartered on the continent. Given a similar
• There was a near even split between direct and            level of finance by these African banks was associ-
   indirect impact risks for South American banks.           ated with the fossil fuel sector, the remaining sectors
• Banks in China exhibited particularly high levels         received less than one per cent of the total loans
   of financing with risk of direct biodiversity impact      on the continent.                                                                                                          FOSSIL FUELS
   (more than 80 per cent of all finance). This was       • South American banks invested a much higher
   eclipsed by banks in India and Russia but only one        percentage in industries that could be either directly
   bank from each of these countries was included in         or indirectly linked to the global food system and
   this research.                                            agricultural commodities, as well as the forestry
• The one South Korean bank included on the top             and non-food forest commodity sector. This is not
   50 list had the smallest risk of direct impacts but       surprising considering the role South American                                                                        FOOD PRODUCTION &
   the highest risk of funding indirect impacts on           countries play in the supply of key agricultural com-                                                              AGRICULTURAL COMMODITIES
   biodiversity.                                             modities such as soy, corn, beef and sugar cane.
                                                          • Banks in Europe and North America exhibited simi-
    Note the number of banks included in Africa              lar financing patterns to each other. However, North
and South America was limited to two banks each.             American banks invested a significantly higher
                                                             percentage in the fossil fuel sector, while a larger
                                                                                                                                                                                   RELOCATION OF GOODS
                                                             percentage of European banks’ loans was linked to                                                                          & PEOPLE
                                                             the food system.

On average, each of the 50 banks included in the
                                                                                                                                                                                          TOURISM

research were linked to finance with biodiversity
risk to the tune of USD 52 billion.

                                                                                                                                                                                  FORESTRY & NON-FOREST
                                                                                                                                                                                      COMMODITIES

                                                                                                                                NORTH AMERICA                   EUROPE                   ASIA & PACIFIC      SOUTH AMERICA               AFRICA

22              2.0 RESULTS                                                                                                                                                                                     BANKROLLING EXTINCTION            23
2.2 Bank Policies Limiting
     Biodiversity Impacts
                             The analysis clearly shows banks are not currently equipped
                             to understand, let alone reduce, the impacts their lending
                             portfolios have on biodiversity.

                                                   Not all finance provided by banks results in          • Even the highest scoring bank, Banco Bilbao Viz-
                                             significant negative biodiversity impacts. However,            caya Argentaria (BBVA), scored below 40 and - like
                                             to understand the effects on the natural environment           all other banks - received poor grades for indicators
                                             enabled by those loans which do, an appropriate                that illustrated willingness to transform their sector.
                                             measurement and monitoring system is required.              • The four Chinese banks, ranked as the largest banks
                                                   This must include detailed policies and proce-           in the world,21 scored particularly poorly in the policy
                                             dures to ensure banks reduce their contribution to             sector and had no exclusions.
                                             the biodiversity crisis, alongside legal frameworks         • Even though nearly all banks integrated sustain-
                                             to hold banks liable in cases of significant negative          ability considerations at the highest level of gov-
                                             impacts on biodiversity.                                       ernance, sustainability directors and departments
                                                   To put the loan calculations presented in the            generally had no veto rights over particularly con-
                                             previous chapter into context, and to analyse the              troversial financing activities.
                                             ability of banks to understand and avoid enabling bio-      • A very small percentage of banks have made sus-
                                             diversity loss, the selected banks’ policies towards           tainability performance part of the remuneration
                                             biodiversity and specific industry sectors have been           and bonus packages of executive compensation.
                                             reviewed and scored.                                           However, these systems are not linked to biodi-
                                                   Banks could score a total of 100 points, which           versity outcomes in particular and usually refer
                                             were split between commitments (46 points) and                 broadly to Environmental, Social, and Governance
                                             exclusions (54 points).                                        (ESG) Criteria.
                                                   Commitments include actions such as integrat-         • While 70 per cent of banks analysed have adopted
                                             ing sustainability into governance, having a dedi-             the Equator Principles (a risk management frame-
                                             cated policy for biodiversity, the reporting of biodiver-      work for determining, assessing, and managing
                                             sity risks, and the development of biodiversity impact         environmental and social risk),22 none of them
                                             measurement systems for bank financing activities.             publicly support the Aichi Biodiversity Targets of
                                                   Exclusions are corporate activities with large           the Convection of Biological Diversity. Amongst
                                             biodiversity impacts that banks have committed not             other targets, the Aichi framework stipulates that
                                             to fund, such as deforestation activities which impact         “by 2020, at the latest, governments, business
                                             high conservation value areas.                                 and stakeholders at all levels have taken steps to
                                                   Banks were able to score points depending on             achieve or have implemented plans for sustainable
                                             the number of exclusion activities across the sectors          production and consumption and have kept the
                                             of fisheries and aquaculture, agriculture, forestry and        impacts of use of natural resources well within safe
                                             bioenergy, metal and mineral mining, fossil fuels,             ecological limits.’’23
                                             infrastructure, tourism, and logistics and transport.       • Crucially, none of the banks support a range of
                                             The full methodology and the detailed assessment for           indicators that are considered vital to overhaul the
                                             every bank can be found in the Appendix.                       way banks finance companies. These indicators
                                                                                                            include the ability of savers to have a say in how
                                             Results                                                        their money is being invested, the reporting of
                                                    The analysis clearly shows banks are not cur-           biodiversity risks including disclosure of loans with
                                             rently equipped to understand, let alone reduce, the           high risks, and the stress-testing of balance sheets
                                             impacts their lending portfolios have on biodiversity.         for biodiversity impacts.
                                             • All banks scored less than 40 points out of a total      • The banks included did not report biodiversity risks
                                                of 100.                                                     sufficiently, especially when compared to their
                                             • The nine banks which scored the highest regarding           reporting on climate risks.
                                                their policies were all headquartered in Europe,         • None of the banks had developed sufficient systems
                                                but their scores were still far too low to ensure the       to measure and monitor the impacts of their lending
                                                companies they fund do not contribute to the global         activities on biodiversity.
                                                biodiversity crisis.

 24         2.0 RESULTS                                                                                             BANKROLLING EXTINCTION                  25
FIGURE 5: BANK POLICY AND EXCLUSION SCORES                            Policies - 43 max                                                                                                          Exclusions- 54 max

                                                      POLICIES                                                 EXCLUSIONS

                                                                                                                                                                                                         40

                                                                                                                                                                                                                              50
                                                                                               40

                                                                                                                                                             20

                                                                                                                                                                                      30
                                                                             20

                                                                                          30

                                                                                                                                  10
                                                                 10

                                                                                                      0
                                                  0
            BANCO BILBAO VIZCAYA ARGENTARIA

                      BNP PARIBAS

                       ING GROUP

                          UBS

                 LLOYDS BANKING GROUP

                    CRÉDIT AGRICOLE

                       NATWEST

                         HSBC

                     CREDIT SUISSE

                    GOLDMAN SACHS

                       RABOBANK

                       BARCLAYS

                   SOCIÉTÉ GÉNÉRALE

                       UNICREDIT

                      BPCE GROUP

                       DBS BANK

                      SANTANDER

                      FIRSTRAND

                    BANK OF AMERICA

                      OCBC BANK

                    DEUTSCHE BANK

                TORONTO-DOMINION BANK

                NATIONAL AUSTRALIA BANK

           COMMONWEALTH BANK OF AUSTRALIA

                      SMBC GROUP

                       CITIGROUP

                   JPMORGAN CHASE

                     CREDIT MUTUEL

                    BANCO DO BRASIL

                    INTESA SANPAOLO

                    MORGAN STANLEY

                    STANDARD BANK

                      CIMB GROUP

                       BRADESCO

                 ROYAL BANK OF CANADA

                   MIZUHO FINANCIAL

                   NORINCHUKIN BANK

                MITSUBISHI UFJ FINANCIAL

                        DZ BANK

                     WELLS FARGO

               CHINA CONSTRUCTION BANK

                SHINHAN FINANCIAL GROUP

                     BANK MANDIRI

                   MALAYAN BANKING

                  STATE BANK OF INDIA

                     BANK OF CHINA

              AGRICULTURAL BANK OF CHINA

        INDUSTRIAL AND COMMERCIAL BANK OF CHINA

                         HDFC

                       SBERBANK

26                                                                                                                                                                                                                                     27
                                                                                                    Banks that would like to access their full assessments or have concerns about the accuracy
              2.0 RESULTS                                                                           are encouraged to contact portfolio earth at info@portolio.earth                                          BANKROLLING EXTINCTION
Excluding activities with significant                                   FIGURE 6: AVERAGE EXCLUSION SCORES OF ALL BANKS COMPARED TO

                                                                                                                                                           None of the banks had
                                                                        MAXIMUM ACHIEVABLE POINTS
biodiversity impact
- Banks achieved the highest exclusion scores (aver-
   age points achieved compared to the maximum                          100%
   available points) in the fossil fuel sector, followed by
   the agriculture sector (which includes agricultural
   commodities such as palm oil). These are sectors
                                                                                                                                                           developed sufficient systems
                                                                                                                                                           to measure and monitor
   where the role of banks has received much public                     80%
   scrutiny in recent years.
- Scores for exclusions in the fisheries sector were
   low, the sector is one of the most significant drivers
   of global biodiversity loss.
- Nearly half of all banks (40 per cent, or 20 out of
                                                                        60%
                                                                                                                                                           the impacts of their lending
   50) had no exclusion activities, enabling the fund-
   ing of any project no matter the seriousness of the
   biodiversity impact linked to them.
                                                                        40%                                                                                activities on biodiversity.
Conclusions
      There were clear differentiations in the average                  20%
scores and locations of the headquarters of the
banks, with European banks performing best.
      The average score of European banks was 21.7,
nearly twice that of the seven North American and two
                                                                           0%
African Banks (12.2 each). Banks in South America
                                                                                     S

                                                                                               RE

                                                                                                         Y

                                                                                                                  G

                                                                                                                           RE

                                                                                                                                     RE

                                                                                                                                              RT

                                                                                                                                                      SM
                                                                                     EL

                                                                                                        G

                                                                                                                 IN

                                                                                                                                             O
                                                                                              U

                                                                                                                            U

                                                                                                                                    TU
                                                                                                       ER

                                                                                                                                                   RI
                                                                                                              IN
                                                                                 FU

                                                                                                                                          SP
                                                                                           LT

                                                                                                                         LT
and the Asia Pacific region scored 8 and 7.4 points

                                                                                                                                                   U
                                                                                                                                 C
                                                                                                    EN

                                                                                                              M
                                                                                          U

                                                                                                                       U

                                                                                                                                                 TO
                                                                                                                                         AN
                                                                                                                                U
                                                                                IL

                                                                                          C

                                                                                                                      AC
                                                                                                           AL
                                                                                                   O

                                                                                                                                TR
                                                                                SS

                                                                                      RI

                                                                                                                                        TR
                                                                                                  BI

                                                                                                         ET
respectively.

                                                                                                                     U

                                                                                                                           AS
                                                                                     AG
                                                                            FO

                                                                                                                  AQ
                                                                                               &

                                                                                                         M

                                                                                                                                     &
                                                                                                                           FR
                                                                                              RY

                                                                                                                                     S
                                                                                                        &

                                                                                                                 &

                                                                                                                                    C
      A correlation between the size of the banks (total

                                                                                                                         IN
                                                                                          ST

                                                                                                    AL

                                                                                                              S

                                                                                                                                 TI
                                                                                                             IE

                                                                                                                                IS
                                                                                                   ER
                                                                                          RE

                                                                                                            ER

                                                                                                                                G
assets), the volume that is at risk of causing impacts
                                                                                               IN
                                                                                      FO

                                                                                                                           LO
                                                                                                         SH
                                                                                               M

on biodiversity, and the policy and exclusion scores                                                    FI

could not be determined. This suggests that the
size of a bank is not an indicator for its ability and
willingness to develop biodiversity-related policies.

FIGURE 7: AVERAGE POLICY AND EXCLUSION SCORES BY BANKS IN KEY REGIONS

 NORTH AMERICA                                                   EUROPE
 7.4 POLICY | 4.8 EXCLUSION                                      7.9 POLICY | 13.8 EXCLUSION

 SOUTH AMERICA                                                    AFRICA                                                   ASIA & PACIFIC
 8.0 POLICY | 0.0 EXCLUSION                                       7.3 POLICY | 4.8 EXCLUSION                               5.9 POLICY | 1.6 EXCLUSION

28               2.0 RESULTS                                                                                                                                                 BANKROLLING EXTINCTION   29
3

Rewriting
of Financing
Rules
30   BANKROLLING EXTINCTION
                              Bankrolling
In recent decades, an unprecedented
consolidation among corporate players has
taken place around the world. Today, 10 per
cent of the world’s public companies generate
80 per cent of all profit.24

      Academics have described large corporations         formative reduction of biodiversity loss. Similarly,
that control much of the supply chains in specific        with few exceptions, international agreements have
industry as the “keystone actors of the Anthropo-         failed to bend the curve of human economic activities
cene”, the proposed geological epoch characterised        impacting the environment.29                              A Lack of Progress –
by the impact humans have had on the environment                In order to address the global biodiversity and
and climate.25                                            extinction crisis, and to avoid reaching planetary        Forestry
      Since many of the banks included in this            tipping points from which biodiversity and human
research are operating globally, and because the          economy cannot recover, legal and regulatory                    Forests contain around 80 per cent of ter-
banking sector has also undergone significant con-        change is required. Banks, as one of the key engines      restrial biodiversity. Rainforests produce 40 per
solidation in recent decades,26,27,28 the same term       behind many human economic activities, must be            cent of the world’s oxygen while also providing
could be applied to banks. As a consequence of the        accountable for the impacts of their finance activities   pollination services to agriculture valued at USD
increasing concentration, an ever-smaller number of       on nature.                                                12 billion per year.30 Efforts by companies and
banks provide corporate financing to an ever-smaller            Alongside the immediate exclusion of prac-          the finance industry to reduce deforestation
number of corporate supply chain actors.                  tices with devastating impacts on biodiversity, the       is relatively well-established and developed in
      Yet despite their increasing and global influence   frameworks in which banks operate need to be              comparison to other biodiversity challenges.
on the biodiversity crisis, banks have no liability for   overhauled. This includes the systematic inclusion of     Many companies have set goals to remove defor-
the damage they cause to biodiversity, except in          biodiversity considerations in lending decisions, risk    estation from their agricultural and timber supply
Brazil. This liability should apply in every geography    management, and the development of correspond-            chains by 2020. Yet many of them are missing
in which a bank has operations. Furthermore, the          ing due diligence systems. It also necessitates the       their deadlines - some of which were set at least
policy assessments included in this report show           development of procedures to measure the impact           a decade ago.31,32 In the case of palm oil, a key
banks have no comprehensive and specific policies         lending activities have on biodiversity, and transpar-    contributor to global deforestation in the tropics,
or due diligence mechanisms in place when it comes        ency when it comes to reporting risks and impacts.        companies that have pledged to remove any
to addressing their impact on nature. While some          Most importantly, in order to cease funding activity      palm oil linked to deforestation from their supply
banks have excluded funding a small subset of the         with detrimental effects on nature, banks will have to    chains continue to be found to be in violation of
worst industries, such as fossil fuels like coal or oil   accept that as enablers of such activities, they are      their commitments,33 even though some progress
sands, and a much smaller set of banks are aware          co-responsible and liable for their impacts.              has been made.34
of the effects loans might have on forests, it is clear                                                                   Within the banking sector the situation is
banks do not consider themselves responsible                                                                        arguably much worse. Seventy per cent of the 150
or liable for biodiversity impacts caused by their                                                                  banks and investments firms analysed in 2019 for
lending activities.                                                                                                 their commitments to prevent deforestation do
      While it has been argued that voluntary sus-                                                                  not have any.35 The lack of progress by companies
tainability commitments by companies, banks,                                                                        has shown that voluntary measures alone will be
and investors are necessary and can translate into                                                                  insufficient.
improvements, they are not sufficient. Voluntary
action is not a substitute for legal and regulatory
reform. Global initiatives such as the Consumer
Goods Forum, the United Nations Global Compact
(UNGC), the Equator Principles, and the Principles
for Responsible Investment have not led to trans-

32              3.0 REWRITING OF FINANCING RULES                                                                                                                          BANKROLLING EXTINCTION   33
This report highlights the role of banks in financing
biodiversity destruction. Other groups and
organisations are actively finding solutions and
frameworks to overhaul the financial sector’s
investments in companies that harm biodiversity.

Recent notable examples of increasing scrutiny of
the financial sector’s impact on biodiversity loss                                                             A Systemic Accountability Framework by F4B Initiative

 he Economics of Biodiversity:36 The Dasgupta
T                                                    he role of the animal agriculture sector, and
                                                    T                                                     1.   Grant Citizens’ Biodiversity Rights                         4.   Align Public Finance with Biodiversity
Review, due out this Autumn, will outline the       the financial institutions investing in the sector,        Financial institutions should take account of citizens’          Governments and public agencies should transpar-
impacts of biodiversity loss, the role of govern-   has prompted campaigning pressure45 from a                 individual and collective biodiversity-related rights            ently align all public finance to biodiversity-related
ment and economic actors, and solutions.            number46 of civil society organisations.                   and preferences in their financing decisions, with               policies, goals, and commitments.
                                                                                                               governments clearly defining those rights.                       • Governments should eliminate or reform all biodi-
                                                                                                               • Financial institutions should inform and empower                 versity-negative subsidies and taxes and develop
 new report37 by the Bank of the Netherlands
A                                                    any civil society groups are undertaking key
                                                    M                                                             citizens to make biodiversity-related choices, as                and scale up incentives for biodiversity restoration.
(DNB) and the Netherlands Environmental             campaigns against particular banks around                     savers, lenders, insurers, consumers, voters and              • Governments and public agencies should integrate
Assessment Agency (PBL) has outlined the risks      specific commodities. For example, Rainfor-                   taxpayers.                                                       biodiversity impact criteria into public procurement,
to the financial sector associated with Biodiver-   est Action Network has, together with other                • Regulators should require financial institutions                 investments and financial instrument design, sover-
sity loss, echoed by thought leaders IIPP38.        NGOS, analysed investments in the forest risk                 to adopt compliance processes to respect the                     eign debt arrangements, and monetary practices.
                                                    commodity sector47 and fossil fuel sector48 for               heritage rights of indigenous communities to bio-
                                                    a number of years. The recent analysis from                   diversity stewardship and use, and to respect their
The legal profession is also taking note: the       Stand.Earth and Amazon Watch49 outlined the                   traditional livelihoods.                                 5.   Align Private Finance with Public Policy
Commonwealth Climate and Law Initiative 39          role of European Banks in financing the trade                                                                               Financial institutions should ensure that their activ-
explores the potential biodiversity-related         of controversial oil extracted from the Amazon.                                                                             ities are consistent with biodiversity-related public
liability risks for financial institutions.         A new report50 from Mighty Earth investigates         2.   Disclose Impact                                                  policies, goals, and commitments.
                                                    the role of banks such as BNP Paribas, ADM                 Financial institutions should publicly disclose actual           • Regulators should require financial institutions to
                                                    Capital and others in Industrial Deforesta-                and expected biodiversity impacts and associated                    align their financial practices, including the design
 he Paulson Institute 40 recently launched a
T                                                   tion to produce rubber. The new addition of                risks.                                                              of financial instruments, with the biodiversity-re-
report making the case for a comprehensive,         the Stop the Money51 pipeline campaign is tar-             • Regulators should require financial institutions to              lated public policies and biodiversity-related inter-
worldwide effort to protect and value nature as     geting some of the biggest actors in the financial            regularly and publicly report the biodiversity impact            national public policy commitments in jurisdictions
an insurance policy against the human conse-        sector such as Blackrock and JP Morgan                        of their entire balance sheets, and to stress-test               where they operate.
quences of biodiversity loss and outlined the       over their role in funding resource extraction                expected biodiversity risk.
ways in which we can reorient financial flows       and the consequences upon local and                        • Financial institutions should make the data and
towards restoration of nature.                      indigenous communities.                                       assumptions underlying these reported impacts            6.   Integrate Biodiversity into Financial
                                                                                                                  and risks publicly available to enable effective citi-        Governance
                                                         One recent set of recommendations from                   zen and shareholder action, and to facilitate the set-        The governance of global finance should accept
 hareAction’s recent report on Asset Managers
S                                                   the Finance for Biodiversity (F4B) project aims               ting of effective standards, policies, and regulation.        accountability for impacts on biodiversity.
and Biodiversity Loss41 demonstrated that none      to drive leading-edge research and analysis to                                                                              • F inancial regulators and monetary authorities,
of the world’s largest asset managers have a        strengthen the link between biodiversity and                                                                                   including central banks, should assess and explain
dedicated policy on biodiversity.                   financing decisions. The project has devel-           3.   Create Liability for Biodiversity                                   the actual and likely impacts of their decisions and
                                                    oped a Finance Accountability Framework that               Legal systems should make financial institutions                    actions on biodiversity.
                                                    includes six elements to transform the finance             liable for biodiversity impacts.
Investors are coming under increasing pres-         system. This framework is replicated on the                • Legislators should extend liability for biodiversity
sure42 and using their influence43 in response      following page.                                               damage to the infringing companies’ banks and
to the massive public outrage44 to the Amazon                                                                     other financing institutions.
Fires.                                                                                                         • Regulators should require financial institutions and
                                                                                                                  corporates to establish biodiversity protection as a
                                                                                                                  public fiduciary responsibility of company directors
                                                                                                                  in their corporate governance.

34            3.0 REWRITING OF FINANCING RULES                                                                                                                                            BANKROLLING EXTINCTION                35
It is clear banks
do not consider
themselves
responsible
or liable for
biodiversity
impacts caused
by their lending
activities.

36   3.0 REWRITING OF FINANCING RULES   BANKROLLING EXTINCTION   37
4

Sector-
specific
Results    Bankrolling
The value of loans to companies operating in the
key biodiversity impacting sectors were calculated
and the results for each of these sectors, as well           In order to address the global biodiversity and extinction crisis,
as their impacts on biodiversity, are in the following
chapters.                                                    and to avoid reaching planetary tipping points from which
      In order to achieve this, a matrix that links Refin-
itiv business codes to the key drivers of biodiversity       biodiversity and human economy cannot recover, legal and
loss identified by IPBES was developed. This allows
for the calculation of finance that is linked to each        regulatory change is required.
driver of biodiversity loss. However, many industry
codes can have multiple and simultaneous effects on
biodiversity and are therefore associated with more
than one driver of biodiversity loss. In such instances,
the value of loans was split equally between the asso-
ciated biodiversity impact sectors in order to keep the
total value of loans the same. For instance, if a bank
loan of USD 50 million was identified within the Food
Retail and Distribution business code, USD 25 million
each was assigned to the two relevant biodiversity
impact sectors: food production and the relocation
of goods and people. The full classifications of indus-
tries against the biodiversity impact sectors can be
found in the Appendix.
      The sectors included in the bar charts in this
chapter were selected according to their size, posi-
tion in the supply chain and biodiversity impacts.

40              4.0 SECTOR-SPECIFIC RESULTS                                                              BANKROLLING EXTINCTION   41
4.1 Food System
     (Fisheries &
     Agriculture)
                                                                                      Results                                                       Fisheries & Agriculture
                                                                                           In 2019, the banks included in this analysis                    The food and agriculture sector is a USD 8.7
                                                                                      provided more than USD 380 billion of finance to              trillion industry52 that comprises 10 per cent of
                                                                                      the food sector which includes activities related to          global consumer spending. Moreover, 65 per cent
                                                                                      agriculture, fisheries, and aquaculture. This is one          of poor working adults rely on agriculture for their
                                                                                      of the sectors identified by the IPBES as the largest         livelihoods.53
                                                                                      drivers of biodiversity loss globally. Without relevant              The fishery and agricultural sectors in particular
                                                                                      policies, funding exclusions, monitoring and report-          have been identified as primary drivers of global
                                                                                      ing systems, and ultimately legal liability for negative      biodiversity loss.54 In 2019, 380 billion USD worth of
                                                                                      impacts, the loans risk contributing to the global            loans and underwriting were provided to this sector
                                                                                      biodiversity crisis.                                          from the banks included in this research. Twenty per
                                                                                           The three largest banks financing the sector             cent of this was associated with direct impact on
                                                                                      were all from the United States of America. No Jap-           biodiversity, particularly from business sectors such
                                                                                      anese banks can be found amongst the ten largest              as agricultural chemicals, fishing, and farming. The
                                                                                      financiers of the sector, which are entirely made             bank with the largest percentage of its total assets
                                                                                      up of European and USA-based banks. Amongst                   linked to the food systems was Rabobank. This is
                                                                                      the companies which received the largest share of             not surprising since it is well known as a leader in the
                                                                                      the funding were supermarkets, food processing                agricultural banking sector around the world. Bank
                                                                                      companies, and international grain traders such               of America, Citigroup and JPMorgan Chase were
                                                                                      as Cargill, Archer Daniels Midland, and Bunge. A              identified as the largest absolute investors.
                                                                                      number of companies linked to leather goods also
                                                                                      received significant bank finance, as did a number of
                                                                                      palm oil companies in Indonesia. Nevertheless, since
                                                                                      many of the companies on the bank loan sheets are
                                                                                      positioned further along the value chain, the majority
                                                                                      of the loans identified were predominantly linked to
                                                                                      indirect biodiversity impact risks.

                                                 FIGURE 8: TEN BANKS WITH LARGEST FINANCE AT RISK IN
                                                 THE FOOD SYSTEM SECTOR (2019, MILLION USD)

                                                                                        30,000

                                                 45%                                    25,000

                                                                                        20,000

                                                                                        15,000

                                                                                        10,000

                                                                       55%               5,000

                                                 TOTAL LOANS OF ALL 50 BANKS:
                                                 USD 380 BILLION
                                                                                             0

                                                       TOP TEN BANKS

                                                                                            FOOD                    FOOD, RETAIL &               FISHING &            AGRICULTURAL
                                                       REST                                                                                                                                      OTHER
                                                                                            PROCESSING              DISTRIBUTION                 FARMING              CHEMICALS

42    4.1. FOOD SYSTEM FISHERIES & AGRICULTURE                                                                                                                BANKROLLING EXTINCTION                 43
Fisheries,
Aquaculture
& Seafood

Industry Scope
      Global fish production reached nearly 180 mil-       the northeast Atlantic (Europe) and northwest Pacific
lion tons in 2018 and the value of the industry is more    (China, Japan, and Russia). The nutrient-rich waters
than USD 400 billion.56 With long-term trends of the       off South America and West Africa are also consid-
capture fisheries remaining relatively stable in recent    ered focus points.59
years, much of the growth of these sectors originates            China is by far the largest producer of fish and
from an increase in aquaculture production which           accounts for 35 per cent of the world’s total produc-
now accounts for 42 per cent of total production.          tion with a further 34 per cent from the other countries
Nevertheless, in 2018 (the last available data at the      in Asia, 14 per cent from the Americas, and 10 per
time of writing), capture fisheries reached a record       cent from Europe. Africa and Oceania contribute 7
96.4 million tonnes and 88 per cent of this was pro-       per cent and 1 per cent respectively to global pro-
duced in marine fisheries.57                               duction. Aquaculture production is a big contributor
      It has been estimated that 60 million people         to the dominance of Asian countries in the fishing
are engaged in the primary capture and aquaculture         industry. Around 90 per cent of all aquaculture takes
fisheries alone and they operate more than 4.5 million     place on the Asian continent.
fishing vessels.58 Ninety per cent of commercial fish-           Overall, around 90 per cent of global produc-
ers (over 100 million people) are engaged in smaller       tion is used for direct human consumption, with the
scale fishery activities. However, small scale fishing     majority of the remainder utilised to produce fish oil
accounts for just under half of the total global fish      and fishmeal for the aquaculture industry.60 Seven-
catch. The other half of global fish production is quite   teen per cent of the world’s animal protein intake
concentrated, with global fishing hot spots including      comes from fish consumption.61

44              4.1 FOOD SYSTEM FISHERIES & AGRICULTURE                                                               BANKROLLING EXTINCTION   45
FIGURE 9: INVESTMENTS IN THE FOOD SYSTEM SECTOR IN 2019 AS A PERCENTAGE OF THEIR TOTAL ASSETS

   Rabobank                                                     Goldman                         ING Group               Wells Fargo          BNP                       JPMorgan
                                                                                                                                             Paribas                   Chase
   1.65%                                                        Sachs                           0.82%                   0.72%
                                                                                                                                             0.71%                     0.70%
                                                                1.15%

                                                                                                HSBC                Credit                   Deutsche                  UniCredit
                                                                                                0.64%               Suisse                   Bank                      0.59%
                                                                Bank of                                             0.61%                    0.60%
                                                                America
                                                                1.06%
   Morgan                                                                                       Royal Bank of
                                                                                                Canada
                                                                                                                Banco
                                                                                                                Bilbao
                                                                                                                                Santander
                                                                                                                                0.41%
                                                                                                                                                     Mitsubishi UFJ
                                                                                                                                                     Financial
                                                                                                                                                                              NatWest
                                                                                                                                                                              0.37%
   Stanley                                                                                      0.57%           Vizcaya
                                                                                                                Argentaria
                                                                                                                                                     0.38%

   1.24%                                                                                                        (BBVA)

                                                                Barclays                                        0.50%           BPCE Group
                                                                                                                                0.36%
                                                                                                                                                Malayan
                                                                                                                                                Banking
                                                                                                                                                                 Intesa
                                                                                                                                                                 Sanpaolo
                                                                                                                                                                                       DBS
                                                                                                                                                                                       0.23%
                                                                                                                                                0.25%            0.25%
                                                                0.94%                           Mizuho          Banco do
                                                                                                Financial       Brasil
                                                                                                0.54%
                                                                                                                0.43%
                                                                                                                                                                Other
                                                                                                                                                Crédit

   Citigroup                                                                                                                    SMBC Group      Mutuel CIC
                                                                                                                                                Group
                                                                                                                                0.35%
                                                                                                                                                0.20%
   1.18%
                                                                Société                         Crédit          Toronto-
                                                                                                                                                CIMB
                                                                                                                                                Group
                                                                                                Agricole
                                                                Générale                        0.52%
                                                                                                                Dominion
                                                                                                                Bank
                                                                                                                                Bradesco
                                                                                                                                0.34%
                                                                                                                                                0.20%

                                                                0.83%                                           0.42%
                                                                                                                                                UBS
                                                                                                                                                0.14%

46                 4.1. FOOD SYSTEM FISHERIES & AGRICULTURE                                                                                                           BANKROLLING EXTINCTION   47
FIGURE 10: TOP EXPORTERS OF FISH PRODUCTS (2018, MILLION USD)55

                                                                                                                       Biodiversity impacts
                                                                                                                            The economic importance and ever-increasing             • Seamounts have incredible biodiversity with many
                                        NORWAY                                                                         production and consumption of fish has had pro-                 endemic species, but this diversity has also made
                                        12,000                                                                         found impacts on fish stocks and aquatic ecosys-
                                                                                                                       tems. Even though fewer species live in aquatic com-
                                                                                                                                                                                       them lucrative targets of the fishing industry and
                                                                                                                                                                                       they are particularly vulnerable to bottom trawling.
                                                                                                                       pared to terrestrial ecosystems, the world’s oceans             In Southern Australia for instance, where heavy
                                                                                                                       and rivers are nevertheless very rich in biodiversity,          fishing occurs around coral seamounts, 90 per
                                                                                                          CHINA
                                                                                                                       in particular on the continental shelves.62 Importantly,        cent of the surfaces where coral grew are now bare
                                                                                                     17,100            the footprint of industrial fishing covers more than 55
                                                                                                                       per cent of ocean areas.63
                                                                                                                                                                                       rock. Even in the Great Barrier Reef World Heritage
                                                                                                                                                                                       Area, seafloor trawling for prawns and scallops has
                                                                   INDIA

                                                                   6,500                             VIETNAM                Today, three-quarters of major marine fish stocks          caused localised extinction of some coral species.70

                                                                                                    7,200              are fully or over-exploited or depleted.64 The stocks
                                                                                                                       fished at unsustainable levels more than tripled from
                                                                                                                                                                                    • Drift nets are large nets that hang vertically in water
                                                                                                                                                                                       and can reach 35 metres in height and up to 20 kilo-
                                                                                                                       10 per cent to 34 per cent in recent decades.65 The             metres in length.71 One fishing operation in Japan
                                                                                                                       impact of fishing activities goes beyond the imme-              used 24 drift nets with a total netting area of around
                                                                                                                       diate effects on target species. It can also lead to            700 kilometres. In addition to the targeted skipjack
                                                                                                                       changes in the physical structure of the environment,           tuna, the catch of 97 dolphins, 10 turtles, 21 manta
     CHILE                                                                                                             reduction in megafauna and top predators through                rays, and 11 whales was reported.72 Even though

     6,500                                                                                                             bycatch, and changes to the nutrient flow within
                                                                                                                       marine ecosystems.66 Since overfishing can cause
                                                                                                                                                                                      the United Nations General Assembly established
                                                                                                                                                                                      an international moratorium prohibiting the use of
                                                                                                                       chain reactions that decrease marine biodiversity              nets over 2.5 kilometres in length, and the Euro-
                                                                                                                       drastically, it has even been argued that there will be        pean Union banned their use in 2013, they are still
                                                                                                                       no seafood left in 40 years’ time if no action is taken.67     widely used.73 It has been estimated that every year
                                                                                                                       • Bottom trawling is a destructive fishing method              640,000 tons of fishing gear (including drift nets) is
                                                                                                                          where large nets, metal doors, and chains are                lost, abandoned, or discarded in the world’s ocean,
                                                                                                                          dragged over the seafloor. This can cause the col-           killing huge numbers of commercially valuable or
                                                                                                                          lapse of specific ecosystem functions, especially            threatened species.74
                                                                                                                          in deeper waters. Despite the well-known impacts,         • Aquaculture is also linked to severe biodiversity
                               Total trade value: 148,000                                                                 bottom trawling remains one of the most common               impacts, including coastal habitat destruction
                                                                                                                          fishing practices, in particular as fishing efforts          via both waste disposal and introduction of alien
                                                                                                                          move further offshore and to deeper waters due to            invasive species and pathogens. Aquaculture also
                                                                                                                          the overfishing of continental shelves.68 The impact         contributes to further depletion of fisheries stocks,
                                                                                                                          on the seabed is particularly severe. It has been cal-       due to the large fish meal and fish oil requirements
                                                                                                                          culated that the sediment mass that is resuspended           used for feed. These effects are species dependent.
                                                                                                                          (or stirred up) by bottom-trawling is approximately          For instance, shrimp and salmon farming have net
                                  FIGURE 11: TOP IMPORTERS OF FISH PRODUCTS (2018, MILLION USD)55
                                                                                                                          the same amount of all sediment being deposited on           negative effects, while carp and mollusc farming
                                                                                                                          the world’s continental shelves by rivers each year.69       have net positive effects on global fish supply and
                                                                                                                                                                                       food security.75 There have also been instances of
                                                                                                                                                                                      deforestation, particular in mangrove forests for the
                                                                                                                                                                                      establishment of aquaculture industries.76
                                                   SPAIN

                                         8,500                             ITALY                               JAPAN

                                         USA
                                                                  7,100                               13,900           The footprint of industrial fishing covers more than
                           20,800                                                                              CHINA   55 per cent of ocean areas.
                                                                                                      14,400

48           4.1. FOOD SYSTEM FISHERIES & AGRICULTURE                                                                                                                                         BANKROLLING EXTINCTION                 49
Agriculture

                                               Industry Scope
                                                     Every day, agriculture produces an average of       of them provide the vast majority of the global output
                                               23.7 million tons of food, provides livelihoods for 2.5   for meat, milk, and eggs.81
                                               billion people, and is the largest source of income            The agriculture and farming sector is by far the
                                               and jobs for poor, rural households. In developing        most important employer globally. It was estimated
                                               countries, agriculture accounts for 65 per cent of all    that more than 1.3 billion people make their income
                                               jobs.78 Dependence upon a functioning ecosystem is        from this sector, more than half of the world’s labour
                                               the foundation of agriculture. Therefore, biodiversity    force.82 There are more than 570 million farms world-
                                               and the food economy are highly interrelated. For         wide, but the vast majority are small with less than
                                               instance, services providing bees and other insects       a hectare of land. These small farms control only 8
                                               that pollinate crops are estimated to be worth more       per cent of all agricultural land, while the 1 per cent
                                               than USD 200 billion per year.79                          of farms that are larger than 50 hectares control 65
                                                     Yet when it comes to the production of food,        per cent of the world’s agricultural land.83
                                               species diversity has largely been lost. There are             Agriculture is one of the largest contributors
                                               around 6,000 plant species cultivated for food around     to global biodiversity loss.84 Considering that at the
                                               the world. Fewer than 200 contribute substantially        current rate of consumption and population growth
                                               to global food output, and only nine account for 66       the world will need to raise its food production by 60
                                               per cent of total crop production (sugar cane, maize,     to 70 per cent to feed more than nine billion people
                                               rice, wheat, potatoes, soybeans, oil-palm fruit, sugar    by 2050,85 radical changes in the food system will
                                               beet and cassava).80 Similarly, livestock production is   be necessary to address its effects on biodiversity.
                                               based on about 40 animal species but only a handful

                                               Agriculture is one of the largest contributors to global
                                               biodiversity loss.

50   4.1 FOOD SYSTEM FISHERIES & AGRICULTURE                                                                       BANKROLLING EXTINCTION                 51
You can also read