Barclays CEO Energy-Power Conference September 8, 2015 - Jeremy Thigpen President and Chief Executive Officer

Page created by Zachary Olson
 
CONTINUE READING
Barclays CEO Energy-Power Conference September 8, 2015 - Jeremy Thigpen President and Chief Executive Officer
Barclays
CEO Energy-Power Conference
September 8, 2015

Jeremy Thigpen
President and Chief Executive Officer
                                        www.deepwater.com
Barclays CEO Energy-Power Conference September 8, 2015 - Jeremy Thigpen President and Chief Executive Officer
Legal Disclaimer
   The statements described in this presentation that are not historical facts are forward-looking statements within the meaning of Section 27A of the
   Securities Act of 1933 and Section 21E of the Securities Exchange Act of 1934. These statements contain words such as "possible," "intend," "will," "if,"
   "expect," or other similar expressions. Forward-looking statements are based on management’s current expectations and assumptions, and are subject
   to inherent uncertainties, risks and changes in circumstances that are difficult to predict. As a result, actual results could differ materially from those
   indicated in these forward-looking statements. Factors that could cause actual results to differ materially include, but are not limited to, statements
   involving prospects for the company, expected revenues, capital expenditures, costs and results of operations and contingencies and other factors
   discussed in the company's most recent Form 10-K for the year ended December 31, 2014 and in the company's other filings with the SEC, which are
   available free of charge on the SEC's website at www.sec.gov. Should one or more of these risks or uncertainties materialize, or should underlying
   assumptions prove incorrect, actual results may vary materially from those indicated. All subsequent written and oral forward-looking statements
   attributable to the company or to persons acting on our behalf are expressly qualified in their entirety by reference to these risks and uncertainties. You
   should not place undue reliance on forward-looking statements. Each forward-looking statement speaks only as of the date of the particular statement,
   and we undertake no obligation to publicly update or revise any forward-looking statements to reflect events or circumstances that occur, or which we
   become aware of, after the date hereof, except as otherwise may be required by law. Adjusted earnings is a non-GAAP financial measure and the
   reconciliation to the most comparative GAAP measure is displayed in quantitative schedules on the company’s website at www.deepwater.com.

   This presentation is being issued pursuant to and in accordance with Rule 135 under the Securities Act of 1933. Investors must rely on their own
   evaluation of Transocean Ltd. and its securities, including the merits and risks involved. Nothing contained herein is, or shall be relied on as, a promise
   or representation as to the future performance of Transocean Ltd.

   This presentation does not constitute an offer to sell, or a solicitation of an offer to buy, any securities, and it does not constitute an offering prospectus
   within the meaning of article 652a or article 1156 of the Swiss Code of Obligations or a listing prospectus within the meaning of the listing rules of the SIX
   Swiss Exchange. Investors must rely on their own evaluation of Transocean Ltd. and its securities, including the merits and risks involved. Nothing
   contained herein is, or shall be relied on as, a promise or representation as to the future performance of Transocean Ltd.

                                                                                                                                                   www.deepwater.com   2
Barclays CEO Energy-Power Conference September 8, 2015 - Jeremy Thigpen President and Chief Executive Officer
Recent Accomplishments

                 Continued improvement across key safety metrics
                 Revenue efficiency at or above 95% for last 5 of 6 quarters
  Operational
                 Sustained improvements in cost structure and margins
  Improvement      Rationalized headcount and overhead reductions
                   Focus on out-of-service time and optimized maintenance programs
                   Cost effective stacking of UDW floaters

                   $18.6 billion in contract backlog
  Financial        $5.9 billion total liquidity at July 31, 2015
                   Retired ~$900 million of debt in July 2015
  Flexibility
                   Deferred delivery of 7 newbuild rigs
                   BP/PSC Macondo settlement / insurance proceeds
                   Cancellation of dividend*

  Fleet          Robust pipeline of value-enhancing high-specification newbuilds
                 Eliminating exposure to non-core rigs
  Renewal        Continuing technical leadership

                                                                                      * Pending shareholder approval

                                                                                      www.deepwater.com          3
Barclays CEO Energy-Power Conference September 8, 2015 - Jeremy Thigpen President and Chief Executive Officer
Sustained Operational Out-Performance
                                         2Q15 adjusted earnings of $1.11/share on revenues of $1.9 billion

                  Revenue Efficiency                                                                   Revenue, Adjusted EBITDA & Costs
                  Average Revenue Efficiency 95.3%
  100%                                                                                      3,000                                                                              70%

  95%                                                                                                                                                                          60%
                                                                                            2,400

  90%                                                                                                                                                                          50%

                                                                           (US$ millions)
                                                                                            1,800

  85%                                                                                                                                                                          40%

                                                                                            1,200
  80%                                                                                                                                                                          30%

                                                                                             600
  75%                                                                                                                                                                          20%

  70%                                                                                          0                                                                               10%
           1Q14     2Q14       3Q14       4Q14       1Q15   2Q15                                    1Q14      2Q14         3Q14       4Q14           1Q15          2Q15
                                                                                                    Revenue   Adj Costs*     Adj EBITDA**       Adj EBITDA Margin***

         Continued progress on margin improvement initiatives partially offset deteriorating market conditions
                                                                   *O&M plus G&A expenses, adjusted for unusual items **Revenue less Adjusted Costs ***Adjusted EBITDA divided by Revenue

                                                                                                                                                         www.deepwater.com            4
Barclays CEO Energy-Power Conference September 8, 2015 - Jeremy Thigpen President and Chief Executive Officer
Industry Leading Execution
                Focus on personal and process safety
                Reducing non-productive time
                Better planning, improved reliability, lower spend
                Deliver more wells in record time

                                                                      www.deepwater.com   5
Barclays CEO Energy-Power Conference September 8, 2015 - Jeremy Thigpen President and Chief Executive Officer
Industry Leading Contract Backlog
                                                          Total backlog - $18.6 billion*
                                                                            Chart Title
                       8.0

                             $6.8
                       7.0

                       6.0            Backlog recognized                                                                                         $5.7
                                      through July 31, 2015

                       5.0
      (US$ billions)

                             4.1

                                            $3.9
                       4.0

                       3.0                                           $2.8
                                                                                                                                                  5.7
                                              2.6
                                                                                               $1.9
                       2.0   1.4                                                                                        $1.6
                                                                      2.3
                                    $2.7
                             0.3              0.5                                               1.7
                       1.0
                                                                                                                         1.5
                             0.8              0.5
                                                                      0.3                       0.1
                             0.2              0.3                     0.2                       0.1                      0.1
                       0.0
                             2015           2016                     2017                     2018                     2019                    2020-27
                                                        *Contracted operating dayrate multiplied by the firm contract period for future periods as of the Fleet Status Report issued July 15, 2015

                                                                                                                                                                 www.deepwater.com              6
Barclays CEO Energy-Power Conference September 8, 2015 - Jeremy Thigpen President and Chief Executive Officer
Global Market Leader

 27
      Ultra-Deepwater

 7
        Harsh Env.

 6
        Deepwater

 13
         Midwater

 10
          Jackup

                        Transocean fleet composition at August 19, 2015

                                        www.deepwater.com            7
Barclays CEO Energy-Power Conference September 8, 2015 - Jeremy Thigpen President and Chief Executive Officer
Challenging Market
                    Oil prices at post-2009 lows and rig market is oversupplied – rig fleet transformation in progress

         Ultra-Deepwater                       Deepwater                        Midwater                                 High-Spec Jackups

         Deepwater Invictus                     Jack Bates                      GSF Rig 140                                   Transocean Honor

   Global fleet utilization           Global fleet utilization         Global fleet utilization                   Global fleet utilization
    86%*                                72%*                              76%*                                        84%*
   Uncontracted newbuild              Weakening activity with          Acceleration of rig                        Dayrates declining as
    deliveries delayed or               limited prospects                 retirements                                 oversupply intensifies
    cancelled
                                                                                              * Global marketed utilization data from IHS-Petrodata as of August 25, 2015

                                                                                                                                        www.deepwater.com             8
Barclays CEO Energy-Power Conference September 8, 2015 - Jeremy Thigpen President and Chief Executive Officer
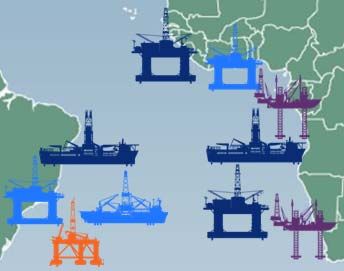
Future Imbalance From Depressed Oil Prices
  $50 oil: supply and demand could be in balance in 2015,                                                        incremental demand                  incremental supply @ $70/bbl
   but supply destruction in out-years is unsustainable                                               mmb/d       incremental supply @ $90/bbl        incremental supply @ $50/bbl
                                                                                                      2.0
  $70 oil: continued reinvestment keeps market from
   balancing until 2016-2017, but 2017+ undersupplied                                                 1.0
  $90 oil: longer-term price required to balance incremental                                         0.0
   supply/demand
  Approximately 30% of the potential 8mmb/d 2018 deficit                                             -1.0
   comes from deepwater sources
                                                                                                      -2.0
 Please note, this is not intended to be a commodity price forecast, merely a sensitivity analysis.
                                                                                                      -3.0
                  Oil supply @ $50/bbl                            Oil supply @ $70/bbl
                                                                                                             13               14             15E    16E             17E              18E
mmb/d             Oil supply @ $90/bbl                            Total oil demand
                                                                                                        mmb/d
  98
                                                                                                              0        -0.5                           -0.2                 -0.7
                                                                                                                                             -0.7
  96                                                                                                                                                  -1.8
                                                                                                                                             -1.5                          -1.5
                                                                                                             -2
  94
                                                                                                                                                      -2.6                 -2.5
  92                                                                                                         -4
                                                                                                                        Other Onshore
                                                                                                                        Shelf
  90                                                                                                         -6
                                                                                                                        Deepwater                                          -3.6
  88                                                                                                         -8         NAm Shale

  86
        12           13              14            15E            16E            17E            18E      -10
                   Source: Rystad Energy, EIA, IEA, Morgan Stanley Research estimates
                                                                                                                       15E                   16E      17E                  18E

                                                                                                                                                                 www.deepwater.com         9
Barclays CEO Energy-Power Conference September 8, 2015 - Jeremy Thigpen President and Chief Executive Officer
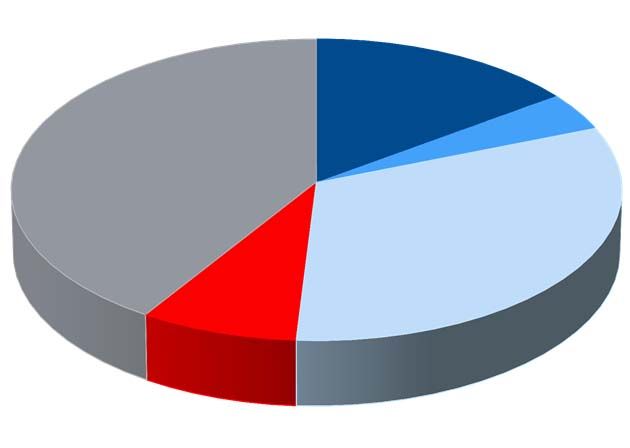
Future Demand Requires Offshore Development
                                                                                   ~50% of incremental new field production growth
                                                                                   through 2020 is related to non-OPEC offshore
 Crude & Condensate Production (mmb/d)                                             development

 85
                                                                                              Chart Title
              Non-Producing Fields               Producing Fields
                                                                                                 2.0            RoW Onshore
 80
                                                                                                 6.0            RoW Offshore

 75
                                                                                                 2.2            OPEC
                                                                                                 1.2            NAm Land
 70

                                                                                          Currently-producing NAm
 65                                                                                       unconventional fields need to add
                                                                                          ~7mmb/d* in incremental production
                                                                                          to offset base decline and grow
                                                                                          production
 60
      00     03        06               09              12              15    18
                   Source: Rystad Energy, Morgan Stanley Research estimates                   *~7mmb/d = ~3.3mmb/d to offset declines + ~3.5mmb/d in net additions

                                                                                                                                 www.deepwater.com           10
Rig Attrition Key to Rebalance the Market
                                                                                                                   Marketed Utilization (average last 12 months)
  Contract Status & Expected Demand 2005-2017                                                                             7500’+       92.6%
              All Floaters - Worldwide
                                                                                                                          4500’-7500’ 85.5%
Investing in the Fleet – High Specification Assets

        18 Newbuilds Added 2009-2014   12 Newbuilds in Pipeline 2016-2020

          11 UDW Drillships             7 UDW Drillships
          3 UDW Semisubmersibles        5 HS Jackups
          4 HS Jackups

              ~$12B Investment                     ~$7B Investment

                                                                     www.deepwater.com   12
Asset Profile

                   2009 Fleet                           Current Fleet                     2020 Projected Fleet*

                   % of Fleet                                % of Fleet                            % of Fleet

                                15%                    16%
                                            4%                                            24%
   41%                                                                    43%

                                                                                    10%                                    55%
                                                 30%
                                      32%
              8%                                                                          11%
                                                               11%

                                                                                 Projected fleet includes:
                                                                                   11 UDW dual BOP rigs
                                                                                   8 UDW moored & DP capable rigs
         Ultra-Deepwater Floaters
                                                                                   7 UDW 20k psi capable rigs
         Harsh Environment Floaters
                                                                                 Average fleet age:
         Deepwater & Midwater Floaters
                                                                                   2020 ~16 years*
         High-Specification Jackups
         Standard Jackups
                                                                                   2015 ~19 years
                                                                                   2009 ~24 years
                                                                                                                * Estimate August 2015

                                                                                                           www.deepwater.com             13
Strong Financial Position

      $18.6 billion backlog provides solid cash-generation foundation
      $5.9 billion total liquidity at July 31, 2015
       $2.9 billion cash
        o Includes July 2015 redemption of 4.95% senior notes
       $3.0 billion undrawn revolving credit facility
      Re-phasing/reduction of capital spending
      Continuous improvement in operating performance and costs
      Cost effective stacking

                                                                         www.deepwater.com   14
Substantial Liquidity

                 12                                                                                         Projected liquidity at
                 11                                                                                         December 31, 2017
                                                             $3.7-$4.7B*       ~$3.7B*
                 10
                  9
                  8
                  7
(US$ billions)

                                                                                                  $1.9B
                                             $3.0B
                  6
                  5                                                                                                $4.0-$5.0B*

                  4
                          $2.9B
                  3
                  2
                  1
                  0
                      Cash at 7/31/15   Revolving Credit   Operations Cash   CapEx through   Debt Due through      Liquidity
                                            Facility            Flow             2017              2017           at 12/31/17

                                                                                                                                             * Estimate

                                                                                                                                 www.deepwater.com        15
The Path Forward

       Transocean will:
        Deliver the safest, most efficient drilling services
        Continue to focus on producing strong operating results through:
         o Strengthening customer relationships
         o Delivering best-in-class uptime and revenue efficiency
         o Right-sizing the organization consistent with fleet size
         o Streamlining every element of the business
        Actively manage capital structure and liquidity
        High grade and reposition the worldwide fleet for the industry recovery

      Transocean will build upon its position as the industry’s leading offshore driller

                                                                                      www.deepwater.com   16
Barclays
CEO Energy-Power Conference
September 8, 2015

Jeremy Thigpen
President and Chief Executive Officer
                                        www.deepwater.com
You can also read