Bass Strait Central Zone Scallop Fishery - 2021 Survey - AFMA Project 2019/0812 June 2021 Matt Koopman, Ian Knuckey, Jessica Kube, Michael Davis ...
←
→
Page content transcription
If your browser does not render page correctly, please read the page content below
Bass Strait Central Zone
Scallop Fishery —
2021 Survey

AFMA Project 2019/0812

June 2021

Matt Koopman, Ian Knuckey,
Jessica Kube, Michael Davis and
Andrew Sullivan
BSCZSF – 2021 Scallop Survey

Contents
 About this document ................................................................................................................................. 3
 1 Executive Summary ........................................................................................................................... 4
 2 List of Tables ..................................................................................................................................... 5
 3 List of Figures .................................................................................................................................... 5
 4 Acknowledgements ........................................................................................................................... 7
 5 Introduction ...................................................................................................................................... 8
 5.1 Objectives.................................................................................................................................. 8
 6 Methods ........................................................................................................................................... 9
 6.1 Survey Design ............................................................................................................................ 9
 6.2 Sampling methods ................................................................................................................... 14
 6.3 Data analysis ........................................................................................................................... 14
 7 Results ............................................................................................................................................ 16
 7.1 Survey shots ............................................................................................................................ 16
 7.2 Biomass, size and potential commercial catch rates ................................................................... 16
 7.3 Biologicals ............................................................................................................................... 17
 7.4 Bycatch ................................................................................................................................... 18
 8 Discussion ....................................................................................................................................... 32
 9 References ...................................................................................................................................... 34
 10 Appendix 1 - Methods ..................................................................................................................... 35
 11 Appendix 2 - Time series data........................................................................................................... 37

 Version Updates Approver

Securing Australia’s fishing future AFMA.GOV.AU 2 of 41
BSCZSF – 2021 Scallop Survey

About this document
© 2021 Fishwell Consulting.

All rights reserved.

ISBN 978-0-6480172-8-8

Title: Bass Strait and Central Zone Scallop Fishery - 2021 Survey

AFMA Project 2019-0812

2021

Ownership of Intellectual Property Rights

Unless otherwise noted, copyright (and any other intellectual property rights, if any) in this publication is owned by the Fishwell
Consulting and the Australian Fisheries Management Authority.

This publication (and any information sourced from it) should be attributed to:

Koopman, M., Knuckey, I., Kube, J., Davis, A. and Sullivan, A. (2021). Bass Strait and Central Zone Scallop Fishery - 2021 Survey.
AFMA Project 2019-0812. Fishwell Consulting. 39 pp.

Creative Commons Licence

All material in this publication is licensed under a Creative Commons Attribution 3.0 Australia Licence, save for content supplied by
third parties, logos and the Commonwealth Coat of Arms.

 Creative Commons Attribution 3.0 Australia Licence is a standard form licence agreement that
 allows you to copy, distribute, transmit and adapt this publication provided you attribute the
 work. A summary of the licence terms is available from
 creativecommons.org/licenses/by/3.0/au/deed.en. The full licence terms are available from
creativecommons.org/licenses/by/3.0/au/legalcode.

Inquiries regarding the licence and any use of this document should be sent to: ian@fishwell.com.au

Cover photo: Jess Kube

Disclaimer

The authors do not warrant that the information in this document is free from errors or omissions. The authors do not accept any
form of liability, be it contractual, tortious, or otherwise, for the contents of this document or for any consequences arising from its
use or any reliance placed upon it. The information, opinions and advice contained in this document may not relate, or be relevant,
to a reader’s particular circumstances. Opinions expressed by the authors are the individual opinions expressed by those persons
and are not necessarily those of the publisher, research provider or the AFMA.

 Researcher Contact Details

 Name: Ian Knuckey
 Address: Fishwell Consulting
 27A Hesse St Queenscliff, VIC 3225
 Phone: +61 3 5258 4399
 Web: www.fishwell.com.au

Securing Australia’s fishing future AFMA.GOV.AU 3 of 41
BSCZSF – 2021 Scallop Survey

1 Executive Summary
At the start of each Bass Strait and Central Zone Scallop Fishery (BSCZSF) fishing season, the Australian
Fisheries Management Authority (AFMA) provides a 150 t research catch allowance to enable fishers to
search for commercially viable scallop (Pecten fumatus) beds. Industry members must then undertake
research surveys to determine if the fishery can remain open under a Tier 1 (catches ≤ 2000 t) or Tier 2
(catches > 2000 t) management arrangements. Research surveys must carry an independent observer or
electronic monitoring that is able to verify catch quantity, shell size and any other scientific data required to
determine biomass estimates. This report provides the results of the 2021 research surveys.

Four commercial fishing vessels were selected by an independent panel to conduct the 2021 scallop
surveys: the Dell Richey II, Northern Star, Odete C and the Rachel Maree, however due to required
maintenance, the Northern Star became unavailable. During May 2021, stratified random surveys were
conducted using these vessels on three beds off Flinders Island, six beds off King Island and three beds off
Apollo Bay. Choice and prioritisation of these beds was made based on previous surveys and commercial
catches from 2020, and with input from the Scallop Resource Assessment Group (ScallopRAG) and the
Industry Co-Management Committee. Beds surveyed in 2021 were a combination of new beds and beds
that had been previously surveyed. Of the new beds for 2021, two were off Flinders Island, one off King
Island and two near the Apollo beds. The number of random survey points allocated to each bed generally
ranges 15 – 25, depending on the size of the bed, but also reflects what an observer can reasonably
monitor during one twelve-hour day.

Random stratified surveys were successfully undertaken on twelve scallop beds off Flinders Island, King
Island and Apollo Bay. Beds were selected based on a combination of previous surveys, distribution of 2019
and 2020 catch and effort, advice from ScallopRAG, and marks provided by industry. In total, 316 valid,
random survey tows were undertaken. Biomass was calculated for each bed using area swept calculated
from the straight line distance between the start and end tow points and the measured internal width of
the dredges.

Biomass of Commercial Scallops greater than 85 mm was estimated to be 20,582 t at the three Apollo beds,
13,142 t at the three Flinders Beds and 17,454 t at the King Island beds. The total biomass greater than
85 mm at all sites combined was 64,002 t. The percent of Commercial Scallops greater than 85 mm was
more than 90% at most sites, while only 14.2%, 23.5% and 74.2% of Commercial Scallops were greater than
85 mm at KI-7, JH-E and KI-9 respectively, all three sites with significant recruitment observed. Densities in
individuals per m2 ranged 0.221 at AB2-E to 3.167 at The Hill.

Survey results were presented to ScallopRAG on 15/6/2019 and the Scallop Management Advisory
Committee (ScallopMAC) on 18/6/2019.

Securing Australia’s fishing future AFMA.GOV.AU 4 of 41
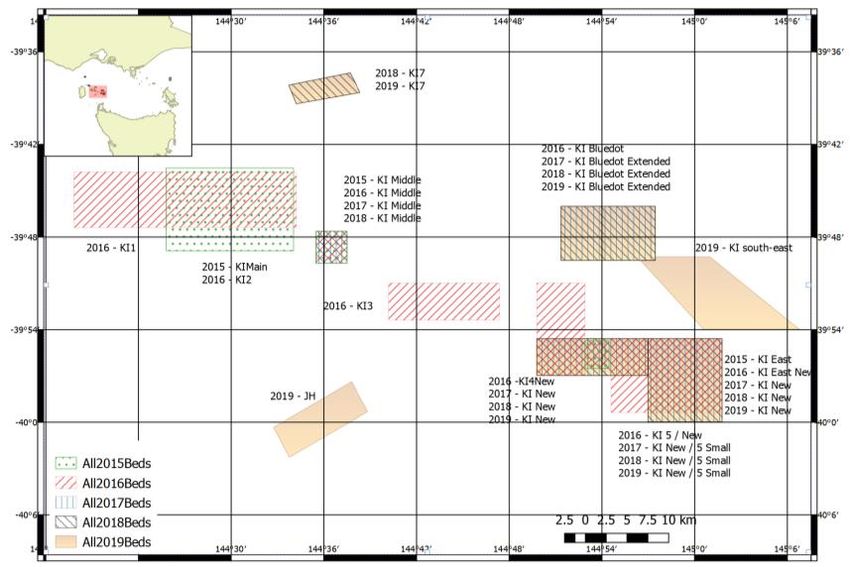
BSCZSF – 2021 Scallop Survey

2 List of Tables
Table 1. Description of beds surveyed since 2015. See Figure 1 for maps of beds. .......................................... 11

Table 2 Inputs used in biomass calculations. ................................................................................................. 18

Table 3 Names, nicknames (used in this report) surveyed in 2021 and area of polygons (km2). ........................ 18

Table 4 Total commercial catch (t) and the number of vessels that fished within each 2021 survey bed during the
 2020 fishing season based on logbook data. Records coloured red are confidential – they were used in
 the analyses but removed for final report. .................................................................................... 19

Table 5. Biomass estimates, 95% confidence limits and number of tows included in analyses. Note that both
 densities have been adjusted for a 33% assumed dredge efficiency. ............................................... 20

Table 6. Percent weight of scallops > 85 mm (catch weighted by weight), and biomass estimates 95% confidence
 limits for scallops greater than 85 mm. ......................................................................................... 21

Table 7. Number of length measurements (N), median, mean and standard error (SE) of scallops measured, and
 % of scallops measured (catch weighted by weight) less than and greater than 85 mm and mean
 number of meats per kg of scallops greater than 85 mm from each bed. ........................................ 21

Table 8. Number of scallops retained for biological sampling, and parameter estimates for length weight
 relationships. The Blue Dot Beds sub area included KI-BDE, KI-BDSE and KI-10. .............................. 22

Table 9. Catch of each species in each bed. (u) refers to undifferentiated species recorded at a higher taxonomic
 level. .......................................................................................................................................... 22

Table 10. Summary of data used to inform the 2021 ScallopRAG and ScallopMAC recommendation for harvest
 strategy requirements and TAC. ................................................................................................... 33

Table 11. Gonad maturation scheme for macroscopic field staging of scallops (taken from Semmens et al., 2019).
 .................................................................................................................................................. 35

3 List of Figures
Figure 1 History of beds surveyed off Flinders Island (top left panel), King Island (top right panel) and Apollo Bay
 (lower panel) from 2015 to 2 019. ................................................................................................ 10

Figure 2. Scallop density (kg / 1000 m2) within the FI, FIN-TS and FIS-NB beds near Flinders Island. The top right
 scale bubbles reflect the estimated scallop density of each tow assuming a dredge efficiency of 33%.
 Red circles denote zero catches.................................................................................................... 24

Figure 3. Scallop density (kg / 1000 m2) within the KI-BDE, KI-BDSE and KI-10 beds. The top right scale bubbles
 reflect the estimated scallop density of each tow assuming a dredge efficiency of 33%. Red circles
 denote zero catches. ................................................................................................................... 25

Securing Australia’s fishing future AFMA.GOV.AU 5 of 41
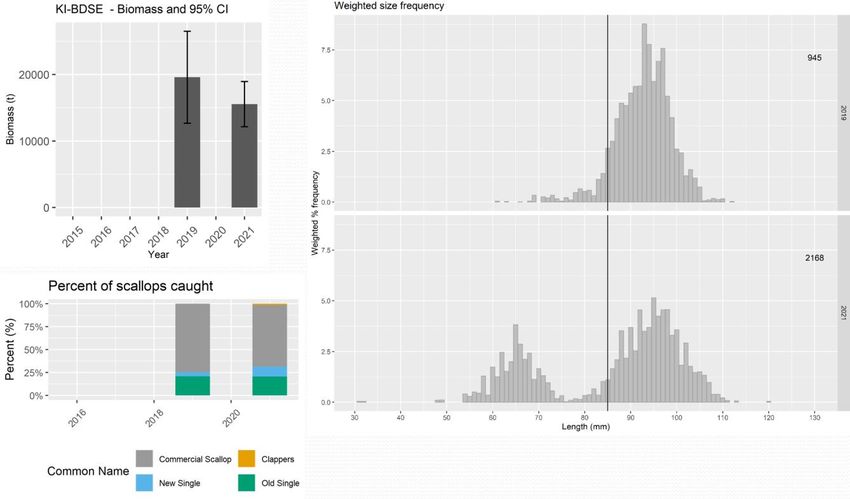
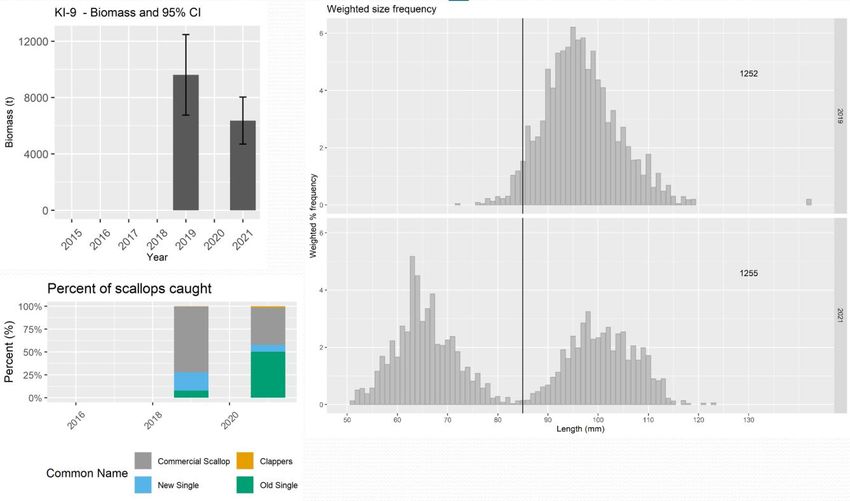
BSCZSF – 2021 Scallop Survey

Figure 4. Scallop density (kg / 1000 m2) within the KI-Mid, KI-7, KI-9 and JH-E beds. The top right scale bubbles
 reflect the estimated scallop density of each tow assuming a dredge efficiency of 33%. Red circles
 denote zero catches. ................................................................................................................... 26

Figure 5. Scallop density (kg / 1000 m2) within The Hill, AB2-E and 5 Hours sites. The top right scale bubbles
 reflect the estimated scallop density of each tow assuming a dredge efficiency of 33%. Red circles
 denote zero catches. ................................................................................................................... 27

Figure 6. Log transformed A) length and weight, B) length and height, C) length and width and D) height and
 width from each bed. .................................................................................................................. 28

Figure 7. Catch weighted size frequency from shots included in biomass estimates from each bed. The vertical
 line is at 85 mm. .......................................................................................................................... 29

Figure 8. Frequency of combined meat and gonad weights of scallops >85 mm measured from each bed binned
 into 2 g weight categories. ........................................................................................................... 30

Figure 9. Percent of scallops at each stage from each bed based on macroscopic staging criteria shown in Figure
 12. ............................................................................................................................................. 30

Figure 10. Percent catch composition by weight from all beds. ...................................................................... 31

Figure 11. Percent composition of clappers, live scallop, new single and old single shell from each Bed. ........... 32

Figure 12. Photos of scallops representing 1 and 2) Developing or spent; 3 and 4) Maturing or atretic
 (reabsorbing eggs as spawning is delayed) and 5 and 6) Partially spawned taken from Semmens et al.,
 2019).......................................................................................................................................... 36

Figure 13. Time series of biomass estimate, size frequency and percent of scallop (live/shell type) at the FI bed.
 .................................................................................................................................................. 37

Figure 14. Time series of biomass estimate, size frequency and percent of scallop (live/shell type) at the KI-BDE
 bed............................................................................................................................................. 37

Figure 15. Time series of biomass estimate, size frequency and percent of scallop (live/shell type) at the KI-BDSE
 bed............................................................................................................................................. 38

Figure 16. Time series of biomass estimate, size frequency and percent of scallop (live/shell type) at the KI-7 bed.
 .................................................................................................................................................. 38

Figure 17. Time series of biomass estimate, size frequency and percent of scallop (live/shell type) at the KI-9 bed.
 .................................................................................................................................................. 39

Figure 18. Time series of biomass estimate, size frequency and percent of scallop (live/shell type) at the AB2-E
 bed............................................................................................................................................. 39

Figure 19. Time series of biomass estimate, size frequency and percent of scallop (live/shell type) at the JH bed.
 Note that there was smaller mesh used during the 2019 survey to capture a greater percentage of the
 juvenile scallops. ......................................................................................................................... 40

Securing Australia’s fishing future AFMA.GOV.AU 6 of 41
BSCZSF – 2021 Scallop Survey

4 Acknowledgements
We would like to thank Glen Wisby and the crew of the Odete C and John, Graham and Dusty Cull and crew
of the Rachel Maree and Stuart and John Richey and the crew of the Dell Richey II for all of their assistance
and hard work in undertaking the 2021 survey. We also appreciate the efforts of Andy and Jake Watts for
endeavouring to make the Northern Star available for the survey. Dusty Cull and Jake Watts provided
valuable information used to define the new Apollo and Flinders Beds. The observers Jessica Kube, Michael
Davis and Andrew Sullivan worked very hard to collect all data required to a high quality standard. Heather
Johnston (AFMA), provided the logbook data used to guide the survey design. Heather, together with
ScallopRAG, ScallopMAC and the BSCZSF Co-Management Committee provided valuable input into the
survey logistics and design.

Securing Australia’s fishing future AFMA.GOV.AU 7 of 41
BSCZSF – 2021 Scallop Survey

5 Introduction
The main target species in the Bass Strait Central Zone Scallop Fishery (BSCZSF) is the Commercial Scallop,
Pecten fumatus. Commercial Scallops in wild populations live for between five and nine years, but have
been observed to die-off rapidly after only three to five years in some situations (Haddon et al., 2006). The
species is generally subject to high spatial and temporal variability in recruitment and abundance, variable
growth and mortality, and rapidly changing meat yield and reproductive condition. This variability means
that management of Commercial Scallops has to be adaptable to sometimes rapidly changing
circumstances, yet still ensure protection of the resource in line with the Commonwealth Fisheries Harvest
Strategy Policy 2018 (HSP).

Under the original HSP, the initial harvest strategy for the BSCZSF was developed during 2007. It was
revised during the 2012 season and in response to industry concerns about the cost-effectiveness and
flexibility, was further reviewed during 2014. The BSCZSF Harvest Strategy has two primary objectives. To:

 1. keep stocks within the BSCZSF at ecologically sustainable levels and, within that context, maximise
 the economic returns to the Australian community; and,

 2. pursue efficient and cost-effective management in attaining (1) above.

The Harvest Strategy uses a tiered approach designed to apply different levels of management and
research services depending on the state of the resource. Underpinning the tiered approach is the need to
balance the risk of over exploitation with obtaining initial knowledge on the status of the stock at the
commencement of the season through pre-season surveys.

At the start of each fishing season, the Australian Fisheries Management Authority (AFMA) provides a 150 t
research catch allowance to enable fishers to search for commercially viable scallop beds, defined as “…an
area or scallop bed containing no greater than 20 per cent of scallops of a size less than 85 mm”. To
increase the catch allowance above 150 t, industry members must undertake research surveys to
determine if the fishery can remain open under Tier 1 or Tier 2 level management arrangements.

 • Tier 1 management arrangements require initial closure of an area/s (not more than 2 scallop
 beds) that contain ≥1500 tonnes in total of high density scallops of a minimum size of 85 mm. The
 season begins with a 1000 t total allowable catch (TAC) that can be increased to 2000 t if good
 catches are achieved.

 • Tier 2 management arrangements require initial closure of an area/s (not more than 2 scallop
 beds) that contain ≥3000 tonnes in total of scallops of a minimum size limit of 85 mm of high
 density. The season begins with a 2000 t TAC that can be increased if good catches are achieved.

Research surveys must carry an independent observer or electronic monitoring that is able to verify catch
quantity, shell size and any other scientific data required to determine biomass estimates. This report
provides the results of the 2021 stratified random surveys.

5.1 Objectives
1. Estimate the scallop biomass and potential commercial catch rates in three different areas of the
 BSCZSF.
2. Measure the size frequency distribution of scallops in each area to calculate discard rates.
3. Report results to AFMA, ScallopRAG and ScallopMAC.

Securing Australia’s fishing future AFMA.GOV.AU 8 of 41
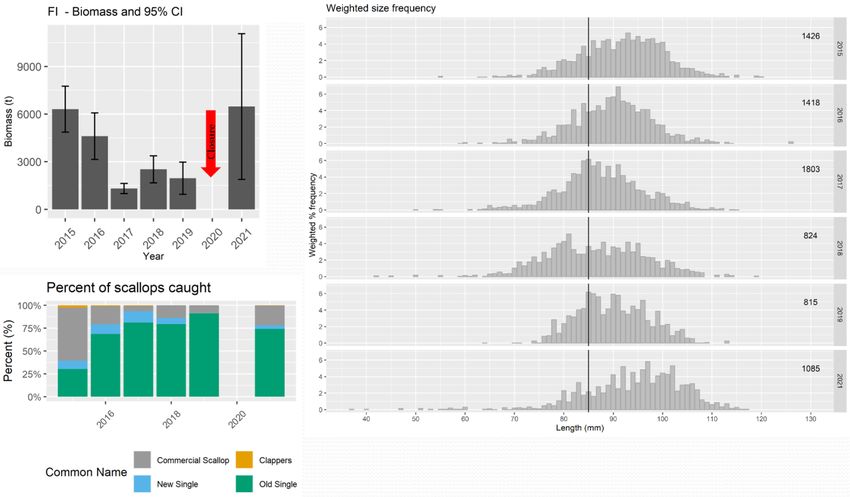
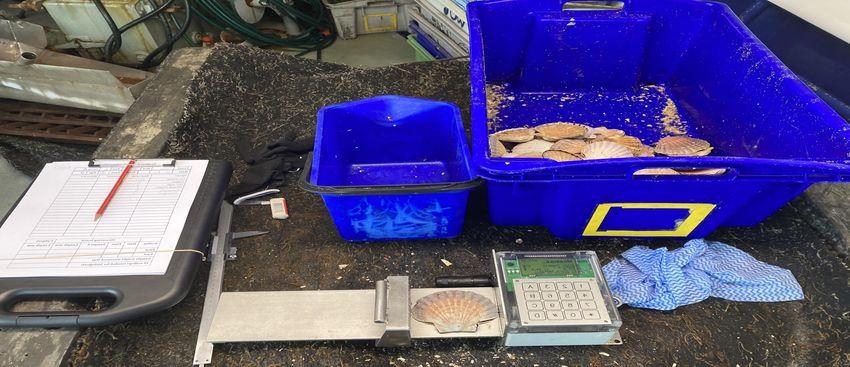
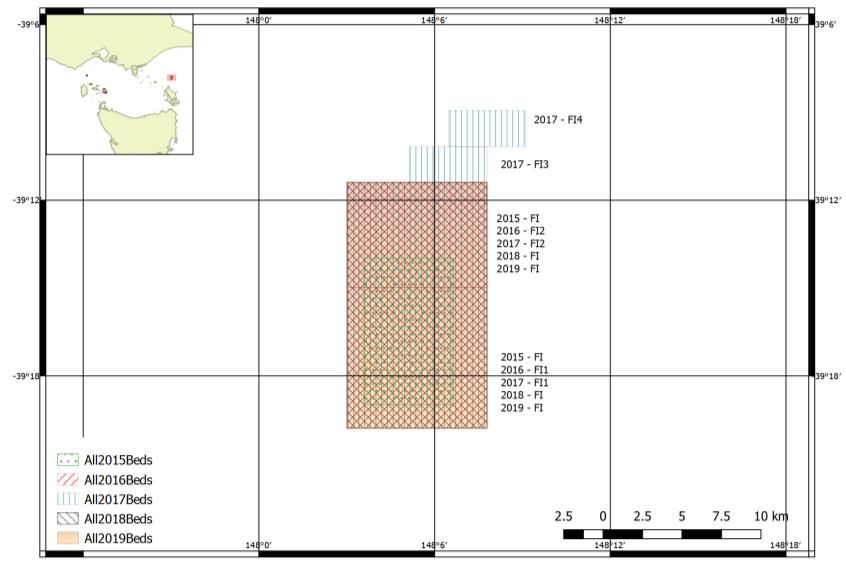
BSCZSF – 2021 Scallop Survey

6 Methods
6.1 Survey Design
Survey methods follow those of Knuckey et al. (2015), modified from those described in Harrington et al.
(2008). Initially, four vessel were selected to undertake the survey, but due to maintenance only three
vessels ended up being used to undertake a stratified random survey of scallop beds, each with
independent observers onboard to collect all of the necessary survey data.

The 2015 survey covered three beds off King Island and one off Flinders Island (Figure 1). To provide greater
flexibility in management arrangements regarding closures, this was expanded in 2016 with the addition of
an extra four sites off King Island and another site off Flinders Island (Figure 1, Table 1). In addition to the
extra sites, the boundaries of some of the 2015 sites were modified (for example northern and southern
boundaries of the bed known as KIMain in Knuckey et al. (2015) were brought in slightly, and the eastern
and western boundaries moved east slightly to form a bed titled KI-2 in Knuckey et al. (2016). The beds
surveyed during 2017 were based on advice from the Scallop Research Workshop and input from
ScallopRAG and the BSCZSF Co-Management Committee. They comprised previously surveyed beds,
modified beds and new exploratory beds. In 2018 two beds were added off King Island, while AB-3, AB-4,
FI-3 and FI-4 were not surveyed. In 2019 as well as the Flinders Island bed, Apollo Bay 1 and 2 were
surveyed, and two new beds (one stretching south-east of KI Bluedot Extended and another called the JH
bed comprising high density of juvenile scallops) were added. To protect the juveniles at JH, sampling
intensity was reduced, and a fine mesh cover was placed over half of the dredge to better sample small
scallops.

No survey was undertaken in 2020 because of concerns regarding the Covid-19 outbreak. The beds
surveyed in 2021 were based on previous surveys and advice from the ScallopRAG and the BSCZSF Co-
Management Committee. Changes to the beds surveyed since 2015 are outlined in Table 1.

Securing Australia’s fishing future AFMA.GOV.AU 9 of 41
BSCZSF – 2021 Scallop Survey

Figure 1 History of beds surveyed off Flinders Island (top left panel), King Island (top right panel) and Apollo Bay (lower
panel) from 2015 to 2 019.

Securing Australia’s fishing future AFMA.GOV.AU 10 of 41
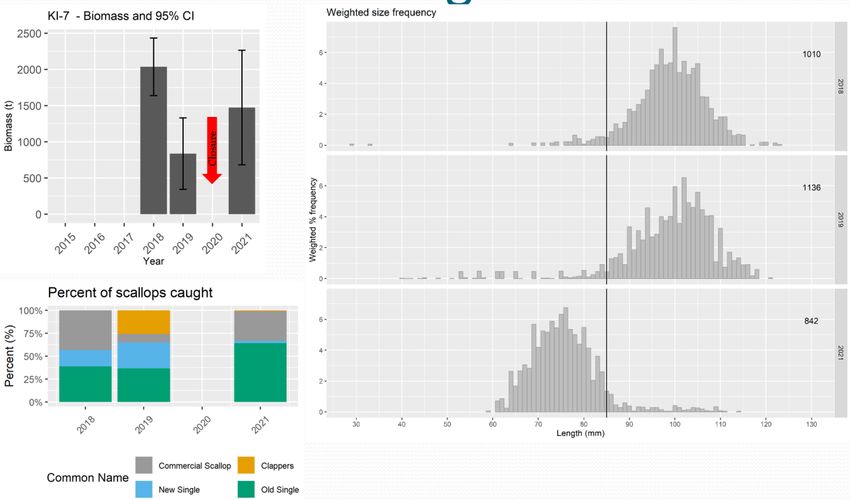
BSCZSF – 2021 Scallop Survey

Table 1. Description of beds surveyed since 2015. See Figure 1 for maps of beds.

 Bed Type Name Description

 KI-5S Originally a larger area that was surveyed in 2016, KI-5S was formed by
 extending the eastern boundary of KI-New south to -40˚S, and including
 the area of KI-5 to the east of that. This bed remained unchanged from
 the 2017 to 2019 when it was last surveyed.

 KI-New KI-New was a bed that was defined for management proposes (it formed
 the initial closure) after the 2016 survey, covering at least parts of three
 different beds surveyed in 2016. It comprised parts of a bed called KIEast
 which was surveyed during 2015, and again in 2016, along with two new
 adjacent beds, KI-4 and KI-5. KI-New remained unchanged from the 2017
 to 2019 when it was last surveyed.

 KI-BDE During the TAC setting by the MAC for the 2016 season, industry
 provided information regarding a dense bed of small scallops that would
 be more suitable for closure than the KI-New bed. This bed titled King
 Island Blue Dot was mapped out and then surveyed during August of
 2016. The area was expanded north and west to form an area closure
 that replaced the closure of KI-New. The boundaries of this expanded
 area are shown in Figure 1. This bed remained unchanged from the 2017
 to 2019 surveys.
 Previously surveyed

 AB-1 and Seven exploratory marks off King Island were provided by industry in
 AB-2 2017 to be explored and considered for additional survey beds.
 Only one of those showed enough promise to survey, and the skippers
 mapped out area, splitting it into two beds. Two additional smaller beds
 were added to each of the western and eastern boundaries, however
 these contained low densities of scallops and were dropped from the
 2018 and future surveys. The Apollo 1 and 2 bed boundaries remained
 unchanged during the 2018 and 2019 surveys. For the 2021 survey, only
 AB2 was surveyed, and the northern boundary was moved north to cover
 relatively high levels of commercial effort in that area.

 KI-6 Examination of 2018 commercial catch and effort data revealed
 significant catches in a large area at approximately longitude 144˚ 17’,
 latitude 39˚ 32’. The vessels mapped out this area to provide a smaller
 area with high density scallops with the boundaries shown in Figure 1.
 The bed boundaries remained unchanged from the 2018 survey, was
 resurveyed in 2019, but dropped for the 2021 survey.

 KI-7 Examination of 2018 commercial catch and effort data revealed
 significant catches in a large area at approximately longitude 144˚ 36’,
 latitude 39˚ 38’. The vessels mapped out this area to provide a smaller
 area with high density scallops with the boundaries shown in Figure 1.
 The bed boundaries remained unchanged from the 2018 survey, was
 resurveyed in 2019 and was surveyed in 2021 as a replacement for KI-Mid
 (in accordance with RAG recommendations) after exploratory revealed
 low densities there.

Securing Australia’s fishing future AFMA.GOV.AU 11 of 41
BSCZSF – 2021 Scallop Survey

 FI FI-1 was called the “Flinders Island” bed during the 2015 survey. For the
 2016 and 2017 surveys, the area was expanded and spilt into the two
 beds (FI-1 and FI-2). Two additional smaller beds were added to the
 northern boundary of FI2 in 2017, however because of low densities,
 these were dropped for the 2018 survey. For the 2018 survey, FI-1 and FI-
 2 were combined into a single large bed (Figure 1). The bed boundaries
 remained unchanged from the 2018 survey and was resurveyed in 2019
 and 2021.

 KI-8a and Examination of 2019 commercial catch and effort data revealed
 KI-8b significant catches in a large area at approximately longitude 144˚ 10’,
 latitude 39˚ 31’. Within the general area of this effort, there were three
 main patches of densely populated scallop beds separated by areas of
 low density and an underwater cable. The two largest of these small
 areas were selected to survey in that year. They were not surveyed in
 2021.

 KI-9 Examination of 2019 commercial catch and effort data revealed
 Previously surveyed

 significant catches in a large area at approximately longitude 144˚ 21’,
 latitude 39˚ 35’. The final boundaries were set based on a combination of
 fishing effort by the survey vessel in the previous year and exploratory
 fishing. This bed was resurveyed in 2021.

 JH An industry member provided two marks that bound a line of exploratory
 shots that contained relatively high densities of juvenile scallops
 (~50 mm). Being the most recent sign of significant recruitment there was
 interest in tracking the growth of this bed, however there was some
 sensitivity around the potential to disturb the bed by surveying it. As a
 compromise, a relatively small survey area was set with only 20 sampling
 sites. Based on advice from industry, the bed was extended to the south-
 east for the 2021 survey.

 KI-BDSE Examination of 2019 commercial catch and effort data revealed
 significant catches in a large area at approximately longitude 145˚ 00,
 latitude 39˚ 49. The final boundaries were set based on a combination of
 fishing effort by the survey vessel in the previous year and exploratory
 fishing. This bed was resurveyed in 2021.

 KI-Mid This bed remained unchanged from 2015, 2016, 2017 and 2018. In
 accordance with RAG recommendations, five exploratory shots were
 conducted at this bed during 2021 revealing low densities (no scallops
 were caught), and so KI-7 was surveyed instead.

Securing Australia’s fishing future AFMA.GOV.AU 12 of 41
BSCZSF – 2021 Scallop Survey

 Bed Type Name Description
 KI-10 Significant catches were taken from an area to the south-east of the KI-
 BDSE site during 2020. KI10 is a new bed that surrounds that catch.
 The Hill Industry members provided marks about 17 nm to the south-east of
 North Apollo 2 where significant amounts of scallops were caught in 2020.
 Based on commercial effort reported from the area, and notes made on a
 fishing vessel’s plotter, a bed was defined.
 Exploratory / New Beds

 Five Industry members provided marks about 19 nm to the south-east of
 hours Apollo 2 where significant amounts of scallops were caught in 2020.
 Based on commercial effort reported from the area, and notes made on a
 fishing vessel’s plotter, a bed was defined.
 Flinders Significant catches were taken from an area about 11 nm to the east of
 Island the FI site. Based on commercial effort reported from the area, and notes
 North - made on a fishing vessel’s plotter, a bed was defined.
 The
 Sisters
 Flinders Significant catches were taken from an area about 31 nm to the south-
 Island south-east of the FI site. Based on commercial effort reported from the
 South – area, and notes made on a fishing vessel’s plotter, a bed was defined.
 North of
 Babel

For the 2021 survey, Scallop RAG recommended including the following beds:

1. Apollo Bay 2 (extended)
2. Blue Dot Extended
3. Blue Dot South East
4. King Island 9
5. King Island 10 (exploratory mark)
6. JH extended
7. The Hill north (exploratory mark)
8. 5 hours
9. Flinders Island
10. Flinders Island North/ The Sisters (exploratory mark)
11. Flinders Island South/ North of Babel (exploratory mark)
12. King Island Middle

And that in accordance with the guidance provided in the BSCZSF Principles for Prioritising Survey Bed, the
RAG recommended that if the first five exploratory shots at King Island Middle yield less than 50 kg per shot
on average, then subject to the discretion of the skipper and observer on board, the survey vessel should
move onto King Island 7 and no biomass estimate is to be obtained for King Island Middle.

Survey bed names were given nick names to simplify for tables and figures. These are shown in Table 3 and
are sued throughout this report.

The number of survey points allocated to each bed was largely guided by sampling effort during past
surveys, with consideration given to the maximum number of tows that can be achieved in a 12-hour

Securing Australia’s fishing future AFMA.GOV.AU 13 of 41
BSCZSF – 2021 Scallop Survey

sampling block1. Primary sampling sites within each bed were randomly allocated using the QGIS Random
Points Tool. Additional survey points were allocated to each bed as “backup sites”, to be used where
“primary sites” were unfishable.

During 2021, surveys were conducted onboard the fishing vessels Rachel Maree (Scientific Permit#
1004985), Dell Richey II (Scientific Permit# 1004987) and Odete C (Scientific Permit# 1004989), which were
selected by an independent panel. To be considered a valid tow, the vessel must dredge within 100 m of
the tow location provided. Lotek LAT1400-64kb temperature-depth loggers were attached to the dredge at
the start of the first tow for each trip apart from the trip which surveyed AB2-E, The Hill and 5 Hours bed
when loggers were not available. They were set to record an observation at regular intervals so that
multiple records would be obtained for each trip.

6.2 Sampling methods
For each shot, estimates were made of weight of: total live scallop catch, dead shell and all bycatch by
species / species group. Dead shell were separated into:

 • Clappers (both valves still connected at the hinge)
 • Old single (single valve – inside appears old and overgrown with epiphytes / epifauna)
 • New single (single valve – inside appears new without any epiphytes / epifauna)

A random sample of at least 35 scallops (where available) was collected from each shot before they went
through the tumbler. The observer measured the length of those scallops using an electronic measuring
board. Either the first or last (or both) scallop from each shot measured using the measuring board was also
measured by hand using digital callipers or a metal ruler. This was done to ensure accuracy and consistency
of the measuring board throughout the survey. The sample weight of scallops measured was also recorded.

From every fifth shot, an additional 10 random scallops were taken before passing through the tumbler to
collect biological information. First, the whole scallop was weighed, then split and the gonad condition
staged according to the scale in based on Semmens, et al. (2018) (Figure 12). Adductor meat and gonad
were removed from the shell and weighed together to calculate number of meats per kg. Shell height and
width were also measured for morphometric analyses.

6.3 Data analysis
All data processing and analysis was undertaken in R (R Core Team, 2021). Estimates of biomass and
potential commercial catch rates followed the methods of Semmens and Jones (2014).

6.3.1 Biomass
The internal widths of the dredges used during the survey were measured in accordance with Semmens
and Jones (2014). Dredge widths used by the Odete C, Dell Richey II and Rachel Maree were 3.905 m, 3.875
m and 3.930 (Table 2). A dredge efficiency of 33% was assumed.

Swept area (S) of each tow was calculated as follows:

S=LxW

1 For OHS reasons, observers are restricted to a maximum of 12 hours of sampling in a 24-hour period.

Securing Australia’s fishing future AFMA.GOV.AU 14 of 41
BSCZSF – 2021 Scallop Survey

Where L is the tow distance (m) and W is the width of the dredge (m). Tow distance was calculated from
the straight-line distance between start and end tow positions.

Scallop catch in each tow (Cstandardised in kg/1000 m2) was calculated as follows:

Cstandardised = (C/S)x1000

Where C is the estimated catch in a shot (kg).

Assuming a 33% dredge efficiency, biomass (B) in tonnes and 95% confidence limits (CL) were estimated for
each stratum (bed) as follows:

B = meanD * A * 3.03 / 1000

Upper 95% CL= ((meanD + (tn-1 x SEmeanD)) x A)*3.03 / 1000

Lower 95% CL= ((meanD - (tn-1 x SEmeanD)) x A)*3.03 / 1000

Were meanD is the mean density (kg) of scallops per m2 swept, tn-1 is the t –value for the number of shots
(n) -1, SEmeanD is the standard error of meanD and A is the total stratum area (m2). The area of each bed was
calculated using the R package “geosphere” (Pebesma, 2018).

Biomass and upper and lower 95% confidence limits (CL) of scallops greater than 85 mm were calculated as
follows:

B>85mm = B * (1-discard rate)

Upper 95% CL >85mm = Upper 95% CL * (1-discard rate)

Lower 95% CL >85mm = Lower 95% CL * (1-discard rate)

where the discard rate was calculated using catch weighted length frequencies converted to weight.

An estimate of density in individuals per square metre (I) was obtained as follows

 = ∑ /

Were WLf is the weighted length frequency for each length class len, and S is the swept area (m2).

All densities (kg / m2 and individuals per m2) reported have been adjusted for the 33% assumed dredge
efficiency (see Harrington et al. (2008) for origin of the 33%2).

6.3.2 Biologicals
The length-weight relationship was calculated for each area separately, and the parameters of the
relationship are provided in the results. Length-weight relationship was applied to catch-weighted size
frequencies to calculate the discard rate at 85 mm. The discard rate was used in calculations of biomass of
scallops greater than 85 mm. Number of meats per kg was calculated separately for each bed by dividing
1000 by the mean meat and gonad weight in grams.

2
 Harrington, Semmens & Haddon (2008). 2008 Commonwealth Bass Strait Central Zone Scallop Fishery Survey. Survey
Final Report. Tasmanian Aquaculture and Fisheries Institute. University of Tasmania

Securing Australia’s fishing future AFMA.GOV.AU 15 of 41
BSCZSF – 2021 Scallop Survey

6.3.3 Quality Assurance
The survey was undertaken following Standard Operating Procedures. All tow and scallop catch data were
recorded in ORLAC Dynamic Data Logger (DDL), which contains quality assurance protocols including
automatic data capture (time, date and position), field restrictions, range checks, mandatory fields and
lookup tables. These data are maintained in the ORLAC Dynamic Data Manager (DDM) database on a cloud-
based server from which data are extracted for analyses. Data were manually error checked against data
sheets. Analyses were undertaken using R (R Core Team, 2021), and a subset of outputs were reproduced
and compared using an alternative software package. Scallops were measured using electronic measuring
boards, or callipers in the event of measuring board failure. The first or last (or both) scallop from each shot
was measured by both the measuring board and by hand using either digital callipers or a metal ruler. This
was done to ensure accuracy and consistency of the measuring board throughout the survey.

Results and their interpretations and conclusions were discussed amongst the research team, and draft
reports were reviewed by co-authors and AFMA managers. Where required, comments were addressed in
preparation of the final report.

7 Results
7.1 Survey shots
The 20121 BSCZSF survey was undertaken over four legs during May. During the first leg, the Rachel Maree
surveyed The Hill, 5 Hours and AB2-E (see Table 3 for explanations of bed names and nicknames) beds
between 5th May 2021 and 8th May 2021. The Dell Richey II conducted exploratory shots at KI-Mid and
surveyed KI-7, KI-9 and JH-E between 17th May 2021 and 21th May 2021. The Odete C surveyed KI-BDSE,
KI-BDE and KI-10 between 17th May 2021 and 20th May 2021, and FI, FIN-TS and FIS-NB between 17th May
2021 and 20th May 2021. Total area of each bed is shown in Table 3. The 5 exploratory shots at KI-Mid
(Figure 4) caught no Commercial Scallops, so in accordance with RAG advice, that bed was replaced with KI-
7, while 20 to 31 valid, random, non-targeted tows were undertaken in each of the survey beds (Table 5).

7.2 Biomass, size and potential commercial catch rates
Mean biomass estimates for 5 Hours, AB2-E and The Hill were 3,627 t (95%CI 1,979 t – 5,274 t), 818 t
(95%CI 209 t – 1,428 t) and 16,137 t (95%CI 12,261 t – 20,014 t) respectively (Table 5). The percentage of
scallops 85 mm were only slightly lower than total biomass estimates: 3,598 t, 814 t and 15,419 t
respectively (Table 6).

Mean biomass estimates for FI, FIN-TS and FIS-NB were 6,477 t (95%CI 1,890 t – 11,065 t), 1,078 t (95%CI
803 t – 1,352 t) and 5,587 t (95%CI 4,319 t – 6,855 t) respectively (Table 5). The percentage of scallops
 85 mm were only slightly lower than total biomass estimates: 1,023 t and 5,337 t respectively (Table 6).
The percentage of scallops 85 mm was
5,821.

Mean biomass estimates for JH-E, KI-7 and KI-9 were 633 t (95%CI 58 t – 1,208 t), 1,473 t (95%CI 681 t –
2,265 t) and 6,367 t (95%CI 4,700 t – 8,034 t) respectively (Table 5). The percentage of scallops
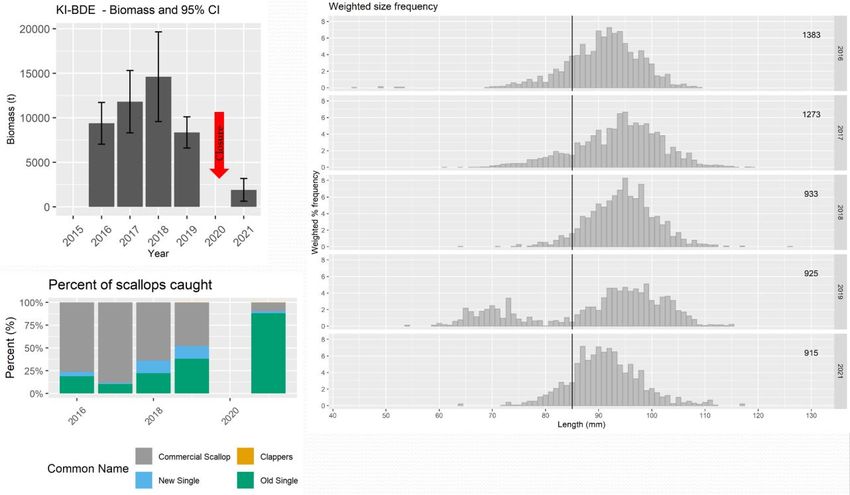
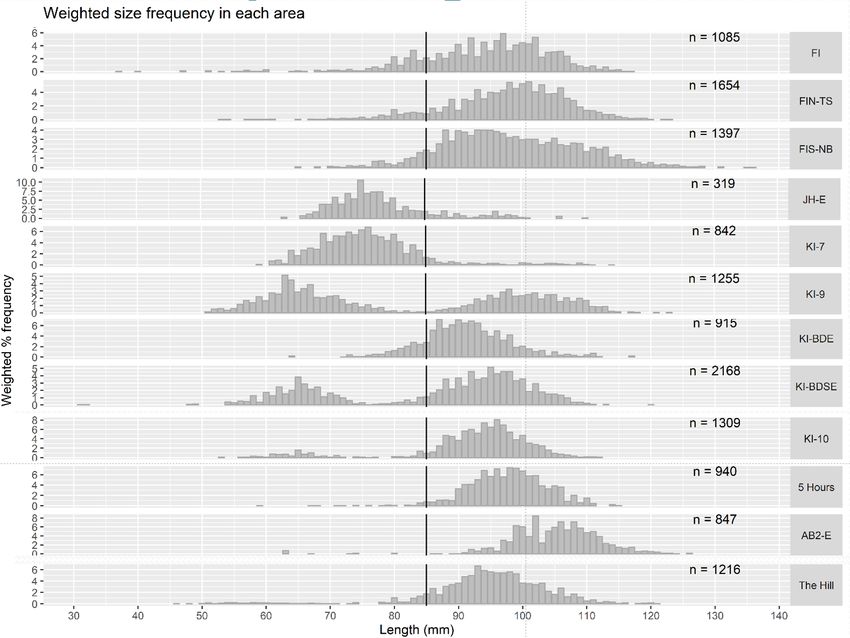
BSCZSF – 2021 Scallop Survey

were about 76.5% at JH-E, 85.8% at KI-7 and 25.8% KI-9 (Table 6). Resulting mean biomasses of scallops >
85 mm at JH-E, KI-7 and KI-9 were 149 t, 209 t and 4,725 t respectively (Table 6).

Mean biomass estimates for KI-BDE, KI-BDSE and KI-10 were 1,904 t (95%CI 626 t – 3,181 t), 15,550 t
(95%CI 12,146 t – 18,954 t) and 4,351 t (95%CI 3,699 t – 5,003 t) respectively (Table 5). The percentage of
scallops 85 mm of 1,721 t, 13,099 t and 4,154 t respectively (Table 6).

Densities in kg/1000m2 for the Flinders beds are shown in Figure 2. At FI, zero and low densities were
observed in the north and increased towards the south-east. Densities were relatively consistent
throughout FIN-TS, however there were some zero catches near the middle of the bed. Medium to high
densities were very consistently recorded from throughout the FIS-NB bed.

There was a wide range of densities recorded in the KI-BDE be, from zeros and low densities in the north-
west to medium-high densities in the east, and some low and medium densities in the south-west (Figure
3). Densities were consistently high throughout KI-BDSE and KI-10.

All 5 tows conducted at KI-Mid caught zero Commercial Scallops (Figure 4). KI-7 tows increased in density
from the south-west to the north-east, however the north of the bed was under sampled, and the two
shots conducted in the northern half had low densities. Tows at KI-9 had consistently medium-high
densities, highest in the south. Many zero shots were recorded throughout JH-E scattered throughout some
low density tows.

Densities at The Hill were very high, particularly in the north of the bed, with two low density shots in the
south-east (Figure 5). Apart from one medium density shot in the north-east, catches were zero and low
throughout most of AB2-E. Like at The Hill, densities at 5 Hours were very high in the north of the bed, with
some low and zero densities in the centre-south.

Estimated densities in numbers at the Apollo beds ranged from 0.221 individuals per m2 at AB2-E to 3.167
individuals per m2 at The Hill (Table 5). A high density was recorded at FIS-NB (1.566 individuals per m2),
with lower densities at FIN-TS (0.751 individuals per m2) and FI (0.602 individuals per m2). High densities
were observed at the KI-BDSE (2.928 individuals per m2), KI-10 (2.776 individuals per m2), KI-7 (2.300
individuals per m2) and KI-9 (2.820 individuals per m2). Densities at JH-E and KI-BDE were 0.183 and 0.331
individuals per m2 respectively.

Comparisons of biomass estimates, percent catch composition and size distributions of beds that have been
repeatedly surveyed and surveyed in 2021 are shown in Appendix 2. While the sampling methods have
been consistent, the areas of the beds have changed considerably. Care should be taken when interpreting
those results, and consideration of changes in bed areas over time should be made.

7.3 Biologicals
Mean length of scallops measured from beds ranged 80.6 mm at JH-E to 105.8 mm at AB2-E (Table 7).
Length frequency distributions from all sites are shown in Figure 7. Significant recruitment was observed at
JH-E, KI-7, KI-9 and KI-BDSE, while small signs of recruitment were observed at FI, FIN-TS, KI-10 and The Hill.
Beds that had similar size frequency distributions (potentially indicating they are subject to related
recruitment events) are FI and FIN-TS, JH-E and KI-7, KI-BDSE and KI-10 and 5 Hours and The Hill. It must be
noted however that there is considerable spatial separation between JH-E and KI-7. Scallop meats of shells
greater than 85 mm length were greatest at FIN-TS and FIS-NB and smallest at JH-E (Figure 8). Overall, most
meats were less than 15 g, and meats per kg ranged 71 at FIS-NB to 128 at The Hill (Table 7). The larger
meat weights at the Flinders sites is reflected in the maturity stages (Table 11), with the highest proportion

Securing Australia’s fishing future AFMA.GOV.AU 17 of 41
BSCZSF – 2021 Scallop Survey

of stage 2 gonads at FI, FIN-TS and FIS-NB. The greatest proportion of stage 3 gonads were at JH-E, KI-9, 5
Hours and KI-7.

Comparison of length-weight regressions revealed that the interaction term was significant (p
BSCZSF – 2021 Scallop Survey

 Bed Nickname Total Area (km2)
 FiveHours 5 Hours 23.61
 Apollo2 Extended AB2-E 30.21
 KI Middle KI-Mid 10.99
 King Island 7 KI-7 14.53
 King Island 9 KI-9 36.39
 JH - Extended JH-E 62.83
 King Island Bluedot SE KI-BDSE 66.95
 King Island Bluedot Ext KI-BDE 56.53
 King Island 10 KI-10 17.13

Table 4 Total commercial catch (t) and the number of vessels that fished within each 2021 survey bed during the 2020
fishing season based on logbook data. Records coloured red are confidential – they were used in the analyses but
removed for final report.

 Bed Catch (t) Number of vessels
 FI
 FIN-TS 140 5
 FIS-NB 453 6
 The Hill xxx 2
 5 Hours xxx 2
 AB2-E 130 5
 KI-Mid

 KI-7
 230 7
 KI-9
 JH-E
 KI-BDSE xxx 4
 KI-BDE
 KI-10 xxx 4

 814 9
 Outside of beds

 Total 2593 9

Securing Australia’s fishing future AFMA.GOV.AU 19 of 41
BSCZSF – 2021 Scallop Survey

Table 5. Biomass estimates, 95% confidence limits and number of tows included in analyses. Note that both densities have been adjusted for a 33% assumed dredge efficiency.

 Area Bed Number Mean density Standard Lower Estimated Upper Potential catch Density
 of tows (kg/1000 m2) deviation 95% CL biomass 95% CL rate (ind/m2)
 (kg/1000 m2) (t) (t) (t) (kg/hr)
 Apollo 5 Hours 25 153.6 169.0 1979 3627 5274 608 1.745
 AB2-E 25 27.1 48.9 209 818 1428 107 0.221
 The Hill 25 266.6 155.2 12261 16137 20014 1056 3.167
 Sub-total 75 20582

 Flinders FI 30 60.4 114.5 1890 6477 11065 239 0.602
 FIN-TS 30 79.9 54.4 803 1078 1352 316 0.751
 FIS-NB 26 177.6 99.8 4319 5587 6855 703 1.566
 Sub-total 86 13142

 King JH-E 24 10.1 21.7 58 633 1208 40 0.183
 KI-10 25 254.0 92.2 3699 4351 5003 1006 2.776
 KI-7 20 101.3 116.4 681 1473 2265 401 2.300
 KI-9 25 175.0 111.0 4700 6367 8034 693 2.820
 KI-BDE 31 33.7 61.6 626 1904 3181 133 0.331
 KI-BDSE 30 232.3 136.2 12146 15550 18954 920 2.928
 Sub-total 155 17454

 Total 316 64002

Heading 1 – Insert Document Title Here AFMA.GOV.AU 20 of 41
BSCZSF – 2021 Scallop Survey

Table 6. Percent weight of scallops > 85 mm (catch weighted by weight), and biomass estimates 95% confidence limits for
scallops greater than 85 mm.

 Area Bed % weight Lower Estimated Upper
 > 85 mm 95% CL Biomass 95% CL
 (t) (t) (t)
 Apollo 5 Hours 99.2 1963 3598 5232
 AB2-E 99.5 208 814 1421
 The Hill 95.5 11715 15419 19123
 Sub-total 19831

 Flinders FI 89.9 1699 5821 9943
 FIN-TS 95.0 763 1023 1283
 FIS-NB 95.5 4126 5337 6548
 Sub-total 12181

 King JH-E 23.5 14 149 284
 KI-10 95.5 3531 4154 4776
 KI-7 14.2 97 209 321
 KI-9 74.2 3488 4725 5961
 KI-BDE 90.4 566 1721 2875
 KI-BDSE 84.2 10231 13099 15966
 Sub-total 24055

 Total 56067

Table 7. Number of length measurements (N), median, mean and standard error (SE) of scallops measured, and % of
scallops measured (catch weighted by weight) less than and greater than 85 mm and mean number of meats per kg of
scallops greater than 85 mm from each bed.

 Length (mm) 85 mm Meats / kg
 Bed N Median Mean SE %< %> Mean
 5 Hours 940 97 97.0 0.2 0.8 99.2 90
 AB2-E 847 106 105.8 0.2 0.5 99.5 96
 The Hill 1216 96 93.9 0.4 4.5 95.5 128
 FI 1085 96 94.4 0.3 10.1 89.9 77
 FIN-TS 1654 98 97.3 0.2 5.0 95.0 76
 FIS-NB 1525 99 99.9 0.3 4.5 95.5 71
 JH-E 319 78 80.6 0.5 76.5 23.5 114
 KI-10 1515 94 92.4 0.2 4.5 95.5 85
 KI-7 842 77 78.3 0.3 85.8 14.2 NA
 KI-9 1255 94 86.0 0.5 25.8 74.2 93
 KI-BDE 915 90 90.0 0.2 9.6 90.4 86
 KI-BDSE 2168 93 89.4 0.3 15.8 84.2 85

Heading 1 – Insert Document Title Here AFMA.GOV.AU 21 of 41
BSCZSF – 2021 Scallop Survey

Table 8. Number of scallops retained for biological sampling, and parameter estimates for length weight relationships.
The Blue Dot Beds sub area included KI-BDE, KI-BDSE and KI-10.

 Sub Area N a b Adjusted R2
 FIS-NB 50 -4.737 1.936 0.42
 Flinders Island 99 -6.501 2.381 0.78
 Blue Dot Beds 169 -7.024 2.482 0.76
 KI-9 50 -7.564 2.575 0.918
 JK-E/KI-7 65 -12.580 3.700 0.678
 Apollo Bay 127 -7.659 2.649 0.70

Table 9. Catch of each species in each bed. (u) refers to undifferentiated species recorded at a higher taxonomic level.
 Catch (kg)
 5 AB2- The KI- KI- KI-
 Species Hours E Hill FI FIN-TS FIS-NB KI-10 BDE BDSE Mid JH-E KI-7 KI-9
 Commercial Scallop 2428.6 461.8 4540 1297 2116.9 2824.8 7081.3 787.5 5790 0 117.4 1080.3 2270
 Clappers 20 3.3 19.2 5.48 21.38 6.7 44 13 124 0 0.5 24 71
 New Single 76 54.5 134 224.3 529.2 807 620 182 937 0.7 251 84 413
 Old Single 217 44 241 4412 1373.7 1340.6 1000 7290 1780 0.8 252.5 2136 2801

 Algae - Phyllospora 0.3 0.7 0.5
 Angel Shark 22.4
 Ascidian (U) 6 138 110.4 1726.4 120 60 33 5 407 74 147
 Australian Angelshark 10
 Australian Handfish 0.05
 Australian Tulip Shell 65 80 80
 Banded Stingaree 0.6 0.7 1.5 0.06 3 5.1 3.2 1 1.4 12 1.6
 Beaked Salmon 0.2
 Blue Warehou 0.2
 Brittlestars (U) 0.47 4 0.1
 Bug 0.5 0.1 0.2 0.4 0.35 0.1 0.1 0.2
 Butterfly Gurnard 0.2
 Cockle 1 59.2 0.7 108
 Cocky Gurnard 0.4 1.6 0.2 0.2 0.2 0.2 0.5 0.1 1
 Common Gurnard Perch 0.1
 Common Stinkfish 0.5 0.9
 Cowrie (U) 0.08
 Crab (U) 0.2 0.67 0.77 0.5
 Cuttlefish (U) 1
 Dog Cockles 2.5
 Doughboy Scallop 10.2 6.2 14.98 28.5 30 0.1 97 102.5 50
 Draughtboard Shark 3 3 42 0.2
 Elephantfish 1
 Eleven-Arm Seastar 99 36.7 53 105 41 95 5
 Fish (U) 0.2
 Flounder (U) 0.4 0.1
 Greenback Stingaree 1 0.09 3.48 2.2 0.3
 Gurnard - Undifferentiated 0.08 0.45 0.5
 Hard Coral 4 10 30
 Hermit Crab (U) 2.3 1.6 3.7 33.33 126.8 69.9 80.5 4 18 0.9 6 14.2 13
 Holothurian (U) 9.2 1.2 26 0.4 4.6 32
 Leatherjackets - Undifferentiated 0.2
 Maori Octopus 12 3.6 8.1
 Melbourne Skate 3
 Nudibranch (U) 0.01
 Octopus (U) 4.3 3.3 5.9 3.49 1.71 1.4 1.1 30 34.1
 Oysters 17.6 10 218.2 20
 Painted Stinkfish 0.2
 Pale Octopus 7.4 9.9 9.4 36 2 11.5
 Peacock Skate 2
 Polychaete Worm (U) 0.1 0.1 0.01 0.05 0.05 0.1 0.2
 Pufferfish (U) 0.4
 Queen Scallop 3
 Razorfish (U) 1.7 3.7 2.9 2.36 6.5 0.3 0.3 0.1
 Red Cod 0.3
 Red Gurnard 0.2
 Sandyback Stingaree 3
 Sawshark 3
 Scorpionfish (U) 0.5
 Sea Urchin (U) 6.2 12.31 16.4
 Seapen (U) 1.2 5.5 0.5 0.5

Securing Australia’s fishing future AFMA.GOV.AU 22 of 41
BSCZSF – 2021 Scallop Survey

 Catch (kg)
 5 AB2- The KI- KI- KI-
 Species Hours E Hill FI FIN-TS FIS-NB KI-10 BDE BDSE Mid JH-E KI-7 KI-9
 Seastar (U) 0.5 0.3 1.5 0.9 0.09 0.4
 Shark Egg (U) 0.1
 Shaw Cowfish 0.2 0.2
 Skate (U) 3
 Sole (U) 0.16 0.6
 Southern Blue-Ringed Octopus 0.16
 Southern Sand Flathead 1
 Sparsely-Spotted Stingaree 0.3 1.9 2 2 3.5 0.2 3 2.2 0.3
 Spider Crab (U) 18.8 0.5 35 62.7 10.9 46 19 50 375 200
 Spiny Pipehorse 0.1
 Sponge (U) 234 34 476 1007.5 227.4 284 375 732 201 209 925 1753
 Sponges (Coral) 10 32 2
 Stargazers - Undifferentiated 1.3 5.5 6.5 12.9 6 5.3
 Stingray (U) 2 9
 Substrate - Broken Shell 20 6 122 4010 2081 1740.1 985 1675 1725 1.2 155 303 2510
 Substrate - Rock 60 6 20 325 27 26
 Tasmanian Numbfish 0.3 2 0.2 0.8 0.3
 Thornback Skate 0.4 0.8
 Tiger Flathead 0.6 0.6 0.8 0.3 0.5 0.2
 Velvet Leatherjacket 0.1
 Venus Shells 0.1 0.3
 Volute (U) 1 5.3 4 5.29 5 4.5 4.4 0.2 1.2 0.1 10 3.1
 Whelk 1.3 6.1 2.8 37.15 50.5 71 0.4 4.1 2.6 71.8 140 8
 Whitespotted Skate 1 2 3

Securing Australia’s fishing future AFMA.GOV.AU 23 of 41
BSCZSF – 2021 Scallop Survey

Figure 2. Scallop density (kg / 1000 m2) within the FI, FIN-TS and FIS-NB beds near Flinders Island. The top right scale
bubbles reflect the estimated scallop density of each tow assuming a dredge efficiency of 33%. Red circles denote zero
catches.

Securing Australia’s fishing future AFMA.GOV.AU 24 of 41
BSCZSF – 2021 Scallop Survey

Figure 3. Scallop density (kg / 1000 m2) within the KI-BDE, KI-BDSE and KI-10 beds. The top right scale bubbles reflect the
estimated scallop density of each tow assuming a dredge efficiency of 33%. Red circles denote zero catches.

Securing Australia’s fishing future AFMA.GOV.AU 25 of 41
BSCZSF – 2021 Scallop Survey

Figure 4. Scallop density (kg / 1000 m2) within the KI-Mid, KI-7, KI-9 and JH-E beds. The top right scale bubbles reflect the
estimated scallop density of each tow assuming a dredge efficiency of 33%. Red circles denote zero catches.

Securing Australia’s fishing future AFMA.GOV.AU 26 of 41
BSCZSF – 2021 Scallop Survey

Figure 5. Scallop density (kg / 1000 m2) within The Hill, AB2-E and 5 Hours sites. The top right scale bubbles reflect the
estimated scallop density of each tow assuming a dredge efficiency of 33%. Red circles denote zero catches.

Securing Australia’s fishing future AFMA.GOV.AU 27 of 41
BSCZSF – 2021 Scallop Survey

 A B

 C D

Figure 6. Log transformed A) length and weight, B) length and height, C) length and width and D) height and width from
each bed.

Securing Australia’s fishing future AFMA.GOV.AU 28 of 41
BSCZSF – 2021 Scallop Survey

Figure 7. Catch weighted size frequency from shots included in biomass estimates from each bed. The vertical line is at
85 mm.

Securing Australia’s fishing future AFMA.GOV.AU 29 of 41
BSCZSF – 2021 Scallop Survey

Figure 8. Frequency of combined meat and gonad weights of scallops >85 mm measured from each bed binned into 2 g
weight categories.

Figure 9. Percent of scallops at each stage from each bed based on macroscopic staging criteria shown in Figure 12.

Securing Australia’s fishing future AFMA.GOV.AU 30 of 41
BSCZSF – 2021 Scallop Survey

Figure 10. Percent catch composition by weight from all beds.

Securing Australia’s fishing future AFMA.GOV.AU 31 of 41
BSCZSF – 2021 Scallop Survey

Figure 11. Percent composition of clappers, live scallop, new single and old single shell from each Bed.

8 Discussion
Random stratified surveys were successfully undertaken on twelve scallop beds off Flinders Island, King
Island and Apollo Bay. Beds were selected based on a combination of previous surveys, distribution of catch
and effort, advice from ScallopRAG and marks provided by industry. In total, 316 valid, random survey tows
were undertaken across 12 beds. Biomass was calculated for each bed using area swept calculated from the
straight line distance between the start and end tow points and the measured internal width of the
dredges.

Biomass of Commercial Scallops greater than 85 mm at the was estimated to be 20,582 t at the three
Apollo beds, 13,142 t at the three Flinders Beds and 17,454 t at the King Island beds (Table 10). Total
biomass greater than 85 mm at all sites combined was 64,002 t. The percent of Commercial Scallops
greater than 85 mm was more than 90% at most sites, while only 14.2%, 23.5% and 74.2% of Commercial
Scallops were greater than 85 mm at KI-7, JH-E and KI-9 respectively, all three sites with significant
recruitment observed. Densities in individuals per m2 ranged 0.221 at AB2-E to 3.167 at The Hill (Table 10).

These results were presented at ScallopRAG on 15 June 2021 and at ScallopMAC on 18 June 2021.

Securing Australia’s fishing future AFMA.GOV.AU 32 of 41
BSCZSF – 2021 Scallop Survey

Table 10. Summary of data used to inform the 2021 ScallopRAG and ScallopMAC recommendation for harvest strategy
requirements and TAC.

Securing Australia’s fishing future AFMA.GOV.AU 33 of 41
BSCZSF – 2021 Scallop Survey

9 References
AFMAb, 2009. Ecological Risk Management, Bass Strait Central Zone Scallop Fishery. 18p.
AFMAa, 2012. Bass Strait Central Zone Scallop Fishery,Review of the Bycatch and Discarding
Work Plan, 1st June, 2009 to 31st May, 2011. 8p.
Haddon, M., Harrington, J.J. and Semmens, J.M., 2006. Juvenile Scallop Discard Rates and Bed
Dynamics: Testing the Management Rules for Scallops in Bass Strait. Tasmanian Aquaculture and
Fisheries Institute, Taroona, Tasmania.
Harrington, Semmens & Haddon (2008). 2008 Commonwealth Bass Strait Central Zone Scallop
Fishery Survey. Survey Final Report. Tasmanian Aquaculture and Fisheries Institute. University of
Tasmania.
Pebesma, E., 2018. Simple Features for R: Standardized Support for Spatial Vector Data. The R
Journal 10 (1), 439-446, https://doi.org/10.32614/RJ-2018-009
R Core Team (2021). R: A language and environment for statistical computing. R Foundation for
Statistical Computing, Vienna, Austria. URL https://www.R-project.org/.
Semmens, J.M., Mendo, Jones, Keane, Leon, Ewing, Hartmann., Institute for Marine and Antarctic
Studies, 2018, Determining when and where to fish: Linking scallop spawning, settlement, size and
condition to collaborative spatil harvest and industry in-season management strategies, University
of Tasmania, Hobart, June. CC BY 3.0
Semmens, J. and Jones, N. (2014). Draft 2014 BSCZSF survey report. Institute for Marine and
Arctic Studies. July 2014.

Securing Australia’s fishing future AFMA.GOV.AU 34 of 41
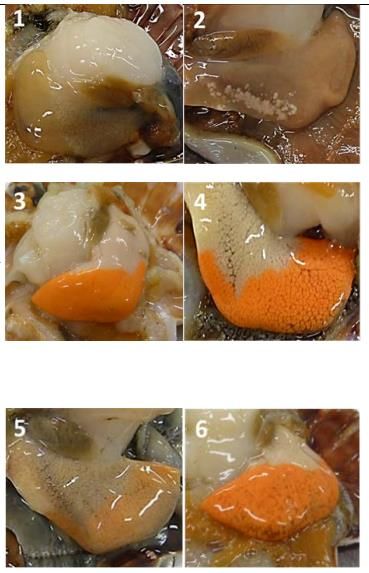
BSCZSF – 2021 Scallop Survey

10 Appendix 1 - Methods
 Stages Description
 Developing or Gonad is small, thin, translucent, brownish colour. Intestinal loop usually visible.
 spent Ovarian and testicular tissues difficult to differentiate.
 Maturing or Separate acini clearly visible, male (white) and female (orange) part of gonad
 atretic distinguishable. Gonad increases in turgor (rigidity) and becomes less granular in
 (reabsorbing eggs appearance as acini begin to fill until ovarian tissue appears uniform in colour.
 as spawning is
 delayed)
 Partially spawned Gonad reduced in size compared to previous stage. Ovary appears mottled,
 presumably due to some acini being voided. Intestinal loop usually visible, ovarian
 tissue uniform in colour, but interspersed with isolated specs of translucent (void)
 acini. Testicular tissues turn paler in colour.

Table 11. Gonad maturation scheme for macroscopic field staging of scallops (taken from Semmens et al., 2019).3

3
 Semmens, J.M., Mendo, Jones, Keane, Leon, Ewing, Hartmann., Institute for Marine and Antarctic Studies, 2018,
Determining when and where to fish: Linking scallop spawning, settlement, size and condition to collaborative spatial
harvest and industry in-season management strategies, University of Tasmania, Hobart, June. CC BY 3.0

Securing Australia’s fishing future AFMA.GOV.AU 35 of 41
You can also read