BBVA FOUNDATION INTERNATIONAL STUDY ON SCIENTIFIC CULTURE UNDERSTANDING OF SCIENCE
←
→
Page content transcription
If your browser does not render page correctly, please read the page content below
Department of Social Studies and Public Opinion

             BBVA FOUNDATION INTERNATIONAL STUDY ON
                       SCIENTIFIC CULTURE
                    UNDERSTANDING OF SCIENCE

The BBVA Foundation presents the results of its “International Study on Scientific
Culture”, based on a wide‐ranging survey as regards both sample size (1,500
interviewees in each of the 11 countries analyzed) and the variety of issues broached.
Surveys of public perceptions of science have a tradition dating back to the mid 1980s,
first in the United States and then in Europe. Their purpose is to assess citizens’
familiarity with and understanding of science, and the different lenses with which they
view it. This BBVA Foundation study not only reproduces the main measures and
indicators used to date, it also adds some new measures into the mix along with
conceptual and metrical innovations.
Studies of scientific culture look beyond conventional indicators of educational level to
consider the knowledge acquired outside the education system and assimilated by the
general population. They address the adult public in its entirety and avoid using the
typical formal educational tests applied to the student population. This particular study
also has an international character that permits comparison of how much the citizens of
different countries know about science.
A collective attuned to and familiar with science and technology is better equipped to
take individual decisions (as patients, consumers, in work and daily life) and, in the public
sphere, is more open to both innovation and the opportunities yielded by today’s global
changes.
Scientific culture presupposes the existence of channels of access to scientific contents,
and studies like this are an effective tool for detecting which channels find most
acceptance with the public.
The study was conducted in 10 European Union countries: Italy, Spain, Austria, the Czech
Republic, Poland, Germany, Netherlands, France, United Kingdom and Denmark, as well
as in the United States. Information was gathered through 1,500 face‐to‐face interviews
in each country (an approximate total of 16,500 interviewees) with the population aged
18 and over, conducted by TNS Opinion over October and November 2011. The design
and analysis of the study are the work of the BBVA Foundation’s Department of Social
Studies and Public Opinion.
The BBVA Foundation International Study on Scientific Culture is divided into two parts:
one cognitive and the other evaluative. The first part examines the level of
understanding of science of citizens in 10 European countries and the United States. This
means examining the extent of their interest and connection with science and, at the
same time capturing dimensions of their cognitive map such as level of knowledge and
understanding in regard to key scientific concepts, the way scientific knowledge is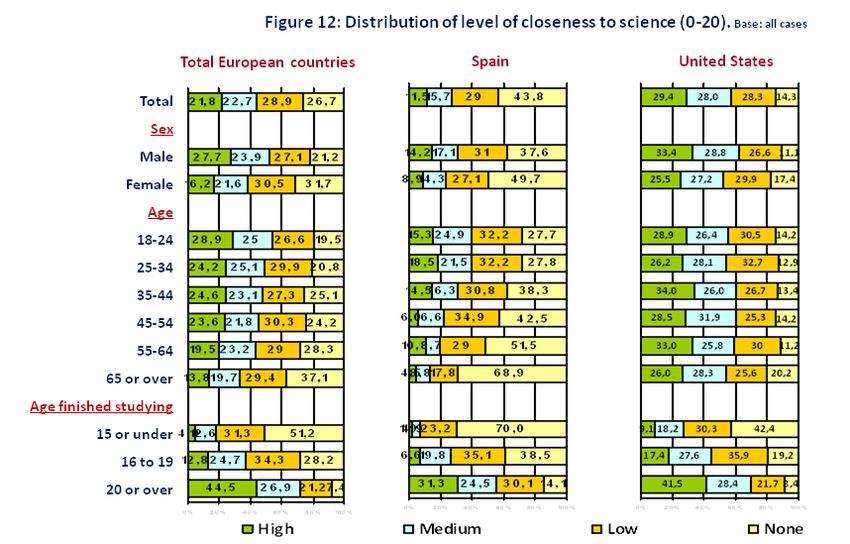
generated and the great figures in science, among other subjects. Specifically, the
following dimensions are explored:
1. Interest, practices and level of closeness to science, as gauged though the following
indicators:
1.1. Stated interest and information about scientific issues.
1.2. Attentiveness to scientific information through different channels: TV,
newspapers, Internet, radio.
1.3. "Exploring science" activities: visits to science and technology museums and
exhibitions, attendance at science conferences, membership of scientific associations,
among others.
1.4. Other connections with science and scientific professionals: knowing or working
with a scientist, having a friend or relative who is a scientist, frequency with which
science topics come up in day‐to‐day dealings with other individuals.
2. Level of scientific knowledge, measured through:
2.1. Level of knowledge of scientific concepts and theories: subjective knowledge of
key scientific terms and concepts, i.e., what do citizens think they understand when
confronted with certain scientific concepts, and level of objective knowledge of
scientific concepts and theories, according to a 22‐item test with true and false
answers.
2.2. Understanding of how scientific knowledge is generated: science as
experimentally tested and published knowledge.
2.3. Familiarity with the great scientists of all times and countries.
Highlights of the study are as follows 1:
Interest, practices and degree of closeness to science
Respondents feel more interested than informed about scientific issues: Stated
interest in news about scientific issues stands in the medium‐to‐high range (average
of 6.0 in the United States and 5.6 in Europe on a scale from 0 to 10). But this interest
does not automatically imply a similar level of information. Indeed the experience of
surveys is that stated interest in science invariably differs from the stated level of
information. This gap appears in all the countries surveyed and is particularly wide in
Spain: although Spaniards’ average interest is in line with the European average (5.7
on a scale from 0 to 10), their subjective level of information (average 4.7) stands
some way behind.
TV is the main source of information on science topics, with the newspapers in
second place. Citizens in the U.S. are likelier to follow scientific information then their
European counterparts. Within Europe, attentiveness is highest in Denmark, the
United Kingdom and the Netherlands, and lower by a significant margin in Spain, the
1
Mentions of Europe or the European average refer to the average of the European Union countries included
in the study (10)
2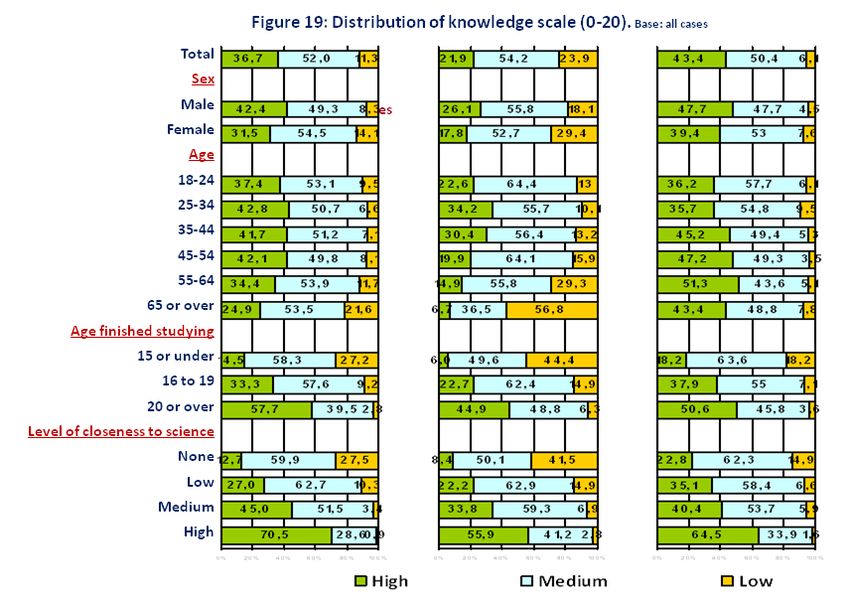
Czech Republic and Italy. Spain stands out as one of the European countries where
people are least in touch with this kind of news: 23% of Spaniards say they often
watch TV programs on science and technology topics against a European average of
41%, while 18% read news items or sections in the newspapers about science and
technology topics compared to Europe’s 32%.
Scant involvement in “exploring science” activities: Citizens have little custom of
visiting science museums or exhibitions though are likelier to do so in the United
States than Europe (32% and 25% respectively). Within Europe, the 30% mark is only
surpassed in Germany and the Netherlands (in Spain, meantime, 21% have visited
this kind of center in the last 12 months). Participation in conferences or talks on
science subjects is lower still (12% in Europe and the United States and 6% in Spain).
Diverse degrees of connection with the scientific career: Respondents’ direct,
connection with the “scientific career” is very weak indeed. Although a significant
percentage have met a scientist in person (40% European average, 44% in the United
States), only a minority have a friend who is a scientist (22% and 20% respectively)
and fewer still have thought at some point of taking up a science‐related career (17%
and 32% respectively), though note here the greater lead of the United States.
Spaniards trail the European average in the extent of their connection with the
scientific career: 22% have met a scientist in person, 17% have a friend who is a
scientist, and 16% have at some point thought of working in science.
Low and differing closeness to science among the European public: In order to
obtain a single measure of closeness to science, we constructed an aggregate
indicator spanning attentiveness to scientific information, involvement in “exploring
science” activities, and connection with the “scientific career”. This indicator
comprises 20 separate measures (range 0 to 20), which we divide into four closeness
brackets: “none”, “low”, “medium” and “high”.
The level of closeness to science found by the study is universally low, though the
United States scores ahead of the European average: 29% and 22% respectively
evidencing a high closeness to science against the 14% and 27% that register no
connection whatsoever.
Within Europe, the highest level of closeness corresponds to Denmark and the
Netherlands (around 40%), ahead of the United Kingdom, United States, France and
Germany (around 30%), with the Czech Republic, Spain and Italy trailing somewhere
below 15%. Also, around 40% in the Czech Republic, Spain and Italy register no
connection with science, against only 10% of the Danish and the Dutch.
Men, young adults and, most notably, citizens with a higher educational level have
a closer connection with science: In Spain, specifically, while 69% of the elderly adult
population have no connection with science (European average 37%), the percentage
drops to 28% among young people aged 18 to 24 (European average 20%). We can
see then, that the difference in closeness between Spain and Europe attenuates
significantly among the younger public.
3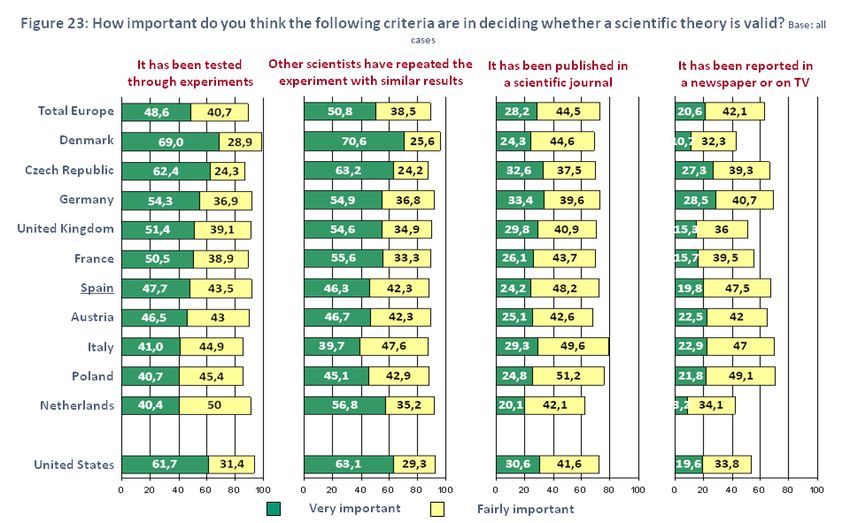
Level of scientific knowledge:
Denmark and the Netherlands register the highest knowledge levels and Spain the
lowest: Summing correct answers to the knowledge “test”, scores for European
countries included in this survey and the United States come out broadly similar, in
the medium to medium‐high interval. Denmark and the Netherlands appear at the
top of the knowledge map (over 15 correct answers to the 22 questions posed),
followed by Germany and the Czech Republic; in the middle ground stand Austria, the
United Kingdom, France and the United States (averages of 13 to 14 correct answers);
with Poland, Italy and Spain occupying the lower reaches. Spaniards score lowest of
all by the measure of objective knowledge (average of 11.2 correct answers vs. a
European average of 13.4).
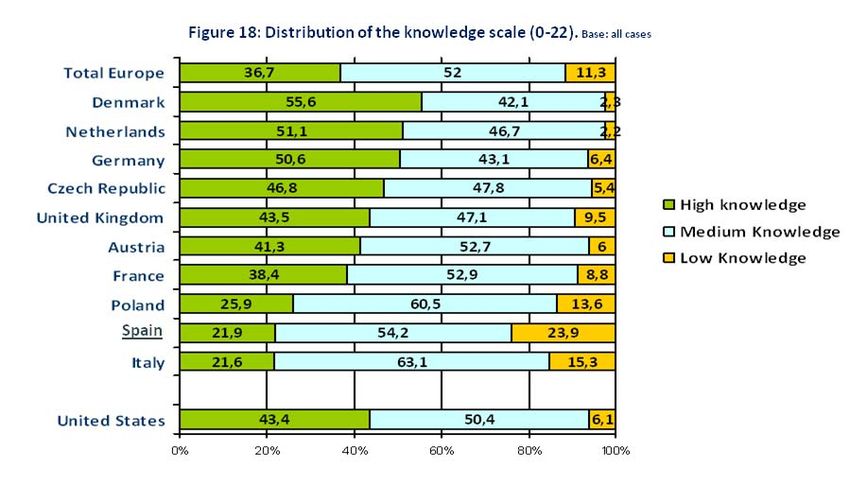
Grouping knowledge “test” answers into three segments (“high”, “medium” and
“low”) throws inter‐country differences into clearer relief. The bulk of the population
in all countries falls within the medium knowledge segment. However, major
differences emerge when we consider the high knowledge segment, which extends
to over 50% in Denmark, the Netherlands and Germany, compared to 25%
approximately in Poland, Italy and Spain.
Education and age influence knowledge disparities in Spain: The study allows us to
plot the relationship in each country between educational level and scientific
knowledge. In Spain’s case, around 44% of the population with fewer years of study
fall within the low knowledge segment compared to 6% of those who completed
their studies at 20 or older. Age too acts as a determinant of knowledge among
respondents in Spain. Hence 13% of young people aged 18 to 24 have a low level of
scientific knowledge compared to 57% of the over 65s.
Young Spaniards are closing the gap with Europe: The distance between Spaniards'
scientific knowledge and the European average shortens considerably among the
young adult population: 13% of 18 to 24‐year‐old Spaniards fall within the low
knowledge segment compared to 10% on average in the same age group in Europe.
In contrast, 57% of elderly Spanish adults are in the low knowledge group compared
to the 22% average of elderly adults Europe‐wide.
Map of countries by closeness to science and scientific knowledge: Closeness to
science bears a positive association with scientific knowledge, allowing us to classify
countries into three groups (see figure 5):
o Denmark and the Netherlands: countries with a higher level of closeness and
scientific knowledge.
o Germany, Austria, France, United Kingdom and United States: countries with
a medium level of closeness and scientific knowledge.
o Poland, Italy, Spain: countries with a lower level of closeness and scientific
knowledge. The Czech Republic shares a low level of closeness with this group
but deviates in its higher level of objective scientific knowledge.
Testing, the main way to validate a scientific theory: The majority affirm that for a
scientific theory to be considered true, it is vital that the results should be tested,
both by the researcher concerned and other scientists. Importance is accordingly
4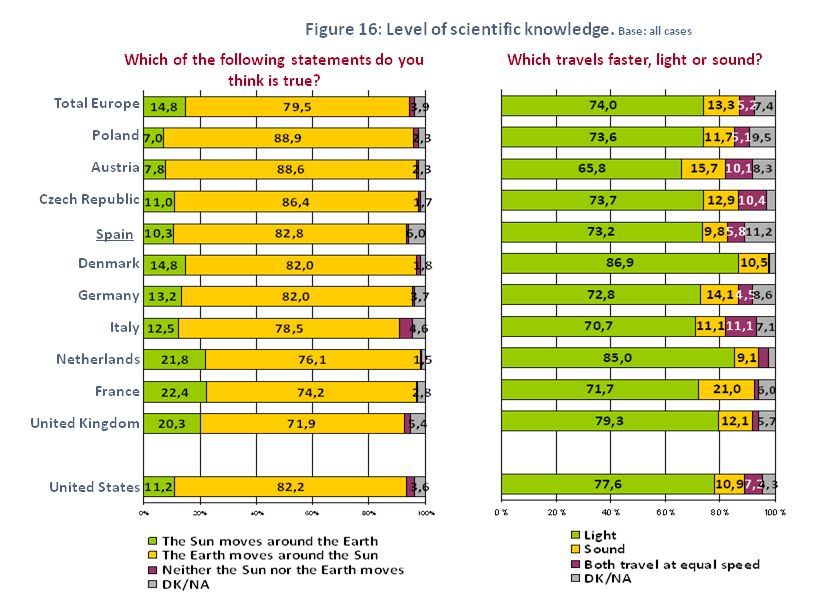
attached to whether It has been tested through experiments and, also, whether
other scientists have repeated the experiment with similar results (over 40% describe
these two criteria as “very important”). The publication of results is considered
another factor of weight. Between 20% and 30% in almost all countries refer to the
importance of results being published in a scientific journal, and between 10% and
20% to them being reported in a mass communication media like the newspapers or
TV.
Over 40% of Spaniards are unable to name any eminent scientist: Another measure
of familiarity with science is knowing the names of those who have contributed
signally to its progress. Respondents were accordingly asked to mention three
scientists of any country and historical period. The first thing that strikes us is the
difference between countries in the percentage unable to name a single scientist; a
fact presumably indicative of a weak scientific culture. Difficulties identifying even
one scientist affect a similar percentage in Europe and the United States (27%), but
rise to 46% in Spain.
Among those able to identify at least one scientist, Albert Einstein is the name
mentioned most frequently by citizens in the 11 survey countries. His 42% of
mentions in Europe and 50% in the United States place him far ahead of his nearest
rivals. Within Europe, the percentages mentioning Einstein run from 54% in Germany
and 51% in Denmark to 30% in Poland and 32% in Spain. A long way behind, a
consensus forms around the figures of Isaac Newton, Marie Curie, Louis Pasteur and
Galileo Galilei.
As a rule, national scientists figure more often and more prominently within each
country. Spaniards however accord little recognition to great national figures:
Santiago Ramón y Cajal is mentioned by around 5% and Severo Ochoa by 2.5%.
5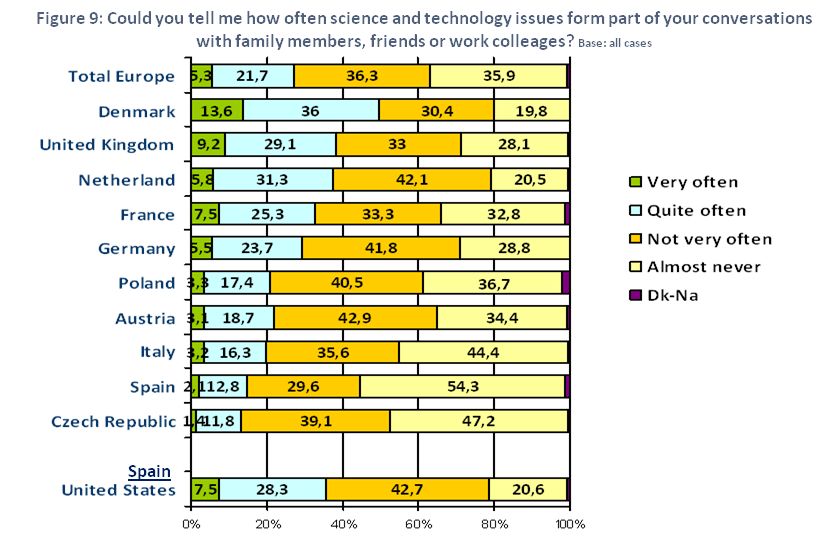
1. INTEREST, PRACTICES AND DEGREE OF CLOSENESS TO SCIENCE
1.1. STATED INTEREST AND INFORMATION CONCERNING SCIENTIFIC ISSUES.
Interest in news about scientific issues in the medium‐to‐high range
A useful starting point to explore citizens’ connection with science is the interest they
show in news items on scientific issues on a stand‐alone basis and in comparison with
news items in other domains.
Interest in science is one of the standard indicators in this kind of study – the first
precondition for an individual to elect to follow science topics, through one or other
channel, out of the multitude of news items competing for their attention.
In a majority of survey countries, the degree of interest stated in scientific issues (on a
scale from 0 to 10 where 0 means absolutely no interest and 10 means a great deal of
interest) stands in the medium‐high interval, equating to average scores of between 5
and 6 points. Set against the overall interest map, we find that interest in scientific issues
trails interest in health, environmental and economic issues and is on a par with the
levels stated for international and political issues, albeit with some differences between
countries (see table 1). In Spain, concretely, average interest in news about scientific
issues stands at 5.7 (close to the European average), some way below health (7.9),
environmental (6.7) and economic (6.7) issues and just a fraction ahead of international
issues (5.6). Spaniards are, with Poles and Czechs, those expressing least interest in
political issues (around 4.5).
Interest in scientific issues is medium to high in the United States and Europe as a whole.
It is possible to segment survey countries by this measure into three large groups:
High interest (average of almost 6 or more): Netherlands, Denmark, United States
and France
Medium interest (average from 5.4 to 5.7): Italy, Spain, Austria, United Kingdom,
Germany, Poland
Low interest (average below 5 points): Czech Republic.
6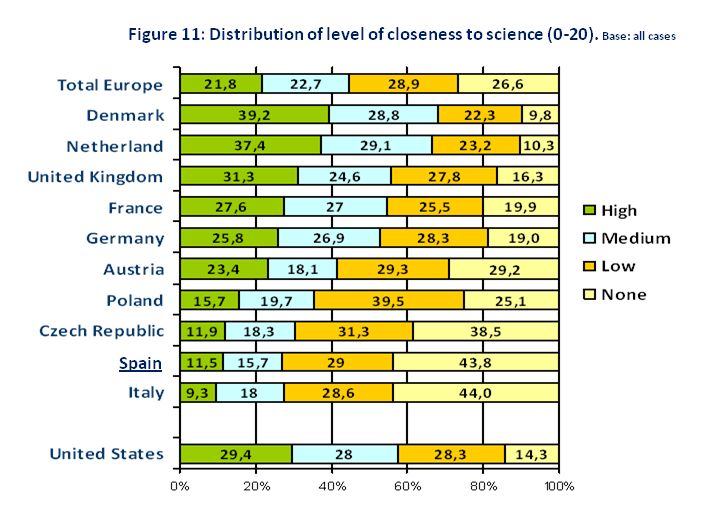
Table 1: Every day there is a great deal of news about a wide variety of issues. I am going to read a list of issues to you,
and I would be grateful if you could rate them according to your level of interest. Scale from 0 to 10 where 0 means you
have absolutely no interest and 10 means you have a great deal of interest in these issues. Base: all cases
                                       Environmental      Economic         International       Scientific
                     Health issues           issues         issues             issues           issues         Political issues
Total Europe               7.4                 6.6            6.1                5.7              5.6                 5.2
Netherlands                7.5                 6.8            6.8                6.7              6.4                 6.5
Denmark                    7.4                 6.9            6.8                6.5              6.1                 6.7
France                     7.7                 6.7            5.9                5.9              5.9                 5.0
Spain                      7.9                 6.7            6.7                5.6              5.7                 4.4
Italy                      7.1                 6.6            6.3                5.6              5.7                 5.3
Austria                    7.2                 6.8            5.9                6.2              5.6                 5.6
United Kingdom             7.6                 6.6            6.2                5.7              5.6                 5.1
Germany                    6.9                 6.7            5.7                5.9              5.5                 5.7
Poland                     7.1                 6.0            5.5                5.1              5.4                 4.6
Czech Republic             6.9                 6.1            5.5                5.0              4.3                 4.3
United States             7.8                 6.9               6.9               5.6               6.0              5.8

Respondents feel more interested than informed about scientific issues
Besides their interest in science, respondents were asked about how informed they felt
they were on scientific issues. As invariably happens, stated interest in science stood
some way above the stated level of information.
Specifically, the extent to which citizens felt informed about science issues was no more
than medium (close to 5 points in a majority of cases), with the Dutch and Danish
expressing a slightly higher level. Spaniards’ subjective level of information was below
the European average. In fact the citizens of Spain and the Czech Republic were those
feeling least well informed, with average scores of under five points and under four
points respectively.
As we can see from figure 2, almost all countries exhibit a difference of between half a
point and one point between the level of interest expressed by respondents and the
degree to which they feel well informed, the gap being widest of all in Spain.

                                                                                                                            7
8
1.2.   ATTENTIVENESS TO SCIENTIFIC INFORMATION VIA DIVERSE CHANNELS
Citizens follow scientific information mainly through television
Aside from the relative interest expressed in scientific matters, citizens in the survey
countries relied on some media more than others to keep up with science news.
Of the alternatives offered – television, newspapers, Internet and the radio – TV was the
most popular for following science and technology topics. The next most common
source, at quite a distance, comprised newspaper articles or supplements, followed by
searches on the Internet. Radio, finally, was the least used medium for following
scientific news.
As we can see from figure 3, attentiveness to scientific issues is higher in the United
States than Europe, taking the average of the countries surveyed. Within Europe, contact
with such information is highest in Denmark, the United Kingdom and the Netherlands
and lower by a considerable margin in Spain, the Czech Republic and Italy.

Attentiveness to science and technology issues varied significantly both between and
within countries (see figure 4). Focusing on Internet searches for scientific information,
we find that gender, age and education are all clear determinants of activity frequency.
Men score higher than women in the frequency of their online science consultations in
European countries, Spain and the United States. Age too is a clear differentiating factor
– more in Europe and Spain than in the United States – with the frequency of Internet
use for science‐related searches increasing significantly as the age group diminishes.
Finally, educational level is the variable most strongly determining online searches for
science news, which increase with years spent in education.

                                                                                        9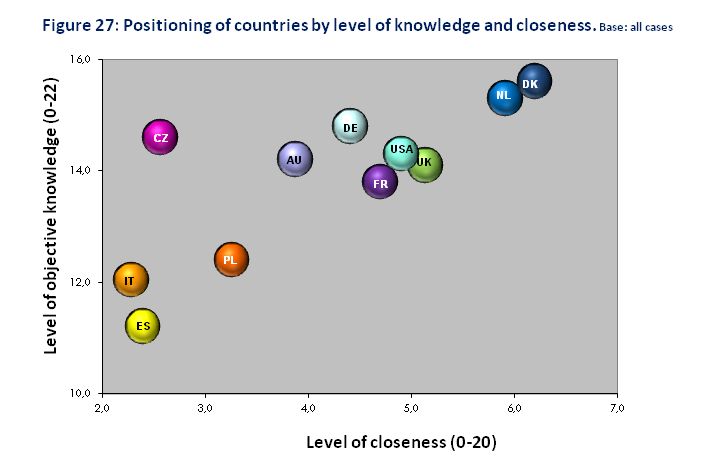
Limited access through more specialist media
A question about the use of other media like videos, specialist magazines or books on
science and technology subjects confirmed the prevalence of on‐screen information over
the written word. Further, the percentage saying they had watched a video or read a
magazine or book on science subjects in the last 12 months varied significantly from one
country to another (see figure 5).
Again the Danes stand out for their greater contact with this kind of information,
alongside the Dutch (in the case of science magazines and books), while Italians and
Spanish are the least likely of all to consume scientific information through more
specialist channels.
In order to identify which segment is the most attentive to scientific issues, we
constructed an aggregate indicator of respondents following science and technology
topics through these three media (videos, magazines and books). What is shows, as we
can see from the last chart in figure 5, is that the segment comprising the most active
followers of science issues is actually very small. It also serves to confirm the differences
between countries, with this most active group summing over 20% of respondents in
Denmark and the Netherlands and under 10% in the Czech Republic, Italy and Spain.

                                                                                          10
The most active group in following science information is a small minority in all
population segments, though certain marked differences do emerge. Men and, above all,
individuals with a higher educational level report the highest attentiveness through
specialist videos, journals or books. Age, finally, is not a determinant for attentiveness in
the United States, but certainly younger age groups are more active than their older
counterparts in Europe and, particularly, Spain (see figure 6).
111.3. “EXPLORING SCIENCE” ACTIVITIES
Little involvement in “exploring science” activities
To get a fuller picture of the connections citizens form with scientific issues in general,
they were asked about their involvement in a series of science‐related activities.
The percentage who had visited a science and technology museum or exhibition in the
last 12 months was low overall, with the United States some way ahead of Europe (32%
and 25% respectively). Within Europe, scores exceeded 20% across the sample, ranging
from 30% plus in Germany and the Netherlands to around 15% in Poland and Italy.
Attendance at conferences or talks on science matters was around 15% or less in most
survey countries excepting Denmark and the Netherlands (around 25%) (see figure 7).
Online involvement in these same activities (museum visits or conferences) extended to
no more than a small minority, below 10% in most cases. United States respondents
were the likeliest to report a virtual visit to a science and technology museum or
exhibition, and the Danish the likeliest to have participated in an online science‐related
talk.
12Involvement in science‐related activities also varied between population groups. Gender
was not a determining factor for visits to science and technology museums. Age,
meantime, marked something of a difference – more so in Europe and Spain than in the
United States – with this kind of visit being reported more frequently among young than
elderly interviewees. But the variable of most influence across all survey countries was
educational level, with visits clearly increasing with study years completed (see figure 8).
131.4. OTHER CONNECTIONS WITH SCIENCE AND SCIENCE PROFESSIONALS
Science topics receive scant and uneven attention in everyday conversations
A key factor in examining people’s connection with science is the extent to which
scientific topics form part of their dealings with other individuals; whether they come up
or not in their conversations with relatives, friends or work colleagues.
In general terms, scientific topics were found to come up with low‐to‐medium frequency.
Again, however, we can point to substantial differences between countries, with the
United States scoring higher than the European average (see figure 9). Within Europe,
the Danes are those conversing most frequently on this kind of subject (50% saying they
do so “often” or “quite often”, followed at a distance by the British and Dutch with
almost 38%). The Spanish stand at the opposite extreme, with over 50% (versus a
European average of 36%) affirming that science topics almost never arise in their daily
conversations. Further, only 15% of Spaniards say they converse often or quite often
about scientific topics compared to the European average of 27%.
Differing degrees of connection with the scientific career
The study also looks at whether citizens feel some kind of connection with the “scientific
career”, either through personal experience or because they have a friend, relative or
acquaintance working in the science sphere.
The connection respondents express with the “scientific career” is very weak. Although a
large percentage in some countries have met a scientist in person at some point in their
lives, only a small proportion have any direct connection with the scientific career. In
most countries, only a small minority say they have a scientist friend, and an even smaller
percentage say they have a relative who is a scientist or have thought at some point of
taking up a science‐related career. Finally, only the tiniest percentage claim membership
of a scientific association (see figure 10).
14Here too we can detect significant differences within Europe. The closest connection
with the scientific career is found among the Danish and the Dutch, followed by British
and French, while the Italians are those expressing the least connection, followed by
Spaniards, Poles and Czechs.
151.5. CLOSENESS TO SCIENCE: AN AGGREGATE MEASURE
Levels of closeness to science are low overall as well as differing sharply within Europe
In order to obtain a single measure of closeness to science, we constructed an aggregate
indicator spanning attentiveness to scientific information, involvement in “exploring
science” activities, and connection with the “scientific career”.
This indicator comprises 20 separate measures and accordingly has a range from 0 to 202.
The full distribution of the closeness scale throws up the contrasting positioning of the
countries surveyed. Scores are grouped into the following categories of closeness:
“none” (0), “low” (average score from 1 to 3), “medium” (average 4 to 7) and “high”
(average 8 or more).
The level of closeness to science found by the study is universally low, though the United
States scores ahead of the European average: 29% and 22% respectively registering a
high closeness to science against the 14% and 27% registering no connection
whatsoever.
Within Europe, the percentage of the population with a high level of closeness is clearly
greater in Denmark and the Netherlands (around 40%), ahead of the United Kingdom,
United States, France and Germany (around 30%), while languishing below 15% in the
Czech Republic, Spain and Italy. Also, around 40% of respondents in the Czech Republic,
Spain and Italy report no connection with science, against only 10% of the Danish and the
Dutch (see figure 11).
In effect, setting countries closest to science against those most remote we observe an
almost inverse distribution, such that the segment closest to science in Denmark and the
Netherlands has a similar weight (around 40%) to the segment in Spain, Italy and the
Czech Republic scoring lowest by this measure; conversely, the segment registering no
connection with science in Denmark and the Netherlands is about equal (around 10%) to
the segment closest to science in Spain, Italy and the Czech Republic.
2
This scale has a reliability of 0.8 for all Europe, as measured by the Cronbach’s alpha coefficient.
Component indicators are: 1‐ Could you tell me how often you read news items or sections in the
newspapers about science and technology topics?; 2‐ And how often do you listen to radio programs
covering science and technology topics?; 3‐ And how often do you watch television programs covering
science and technology topics?; 4‐ And how often do you search for or follow information on science and
technology topics on the Internet?; 5‐ Could you tell me how often science and technology issues form part
of your conversations with family members, friends or work colleagues?; 6‐ In the last 12 months, have you
visited at least once a science and technology museum?; Could you tell me which of the following
situations apply to your personal situation?: 7‐ You have watched a video on science or technology topics
in the last 12 months; 8‐ You have read a book on science or technology topics in the last 12 months; 9‐
You have attended a conference or talk on science or technology topics in the last 12 months; 10‐ You are a
member of a scientific association; 11‐ You have read a science or technology magazine in the last 12
months; 12‐ You have made a virtual visit to a science and technology museum via the Internet in the last
12 months; 13‐ You have downloaded an article on science and technology from the Internet in the last 12
months; 14‐ You have taken part in an online conference, talk or forum on science or technology topics in
the last 12 months; 15‐ You hold a university degree in science: physics, chemistry, mathematics, biology,
engineering, medicine, etc.; 16‐ You have at some point considered the possibility of pursuing a career
related to science, 17‐ You are working or have worked as a scientist on some occasion; 18‐ You have a
family member who is a scientist; 19‐ You have a friend who is a scientist; 20‐ You have at some point met
someone who is a scientist.
16Men, young people and, especially, citizens with a higher educational level evidence
the closest connection with science
Closeness to science not only varies between countries but also within each country
along the lines of gender, age and, most of all, educational level. As we can see from
figure 12, which for illustrative purposes presents data for the set of European countries,
Spain and the United States, men, young adults and, especially, those having completed
most years of studies score higher on average on the closeness scale than women,
elderly adults and the less educated. Differences by age group are more accentuated in
Europe and Spain in particular than they are in the United States.
In Spain’s case, age and educational level are strong determinants of closeness. Hence
around 70% of elderly adults register no connection with science against under 30% of
the population aged 18 to 34. Likewise, 70% of respondents with a lower educational
level register no connection with science against just 14% among their more educated
peers. Consequently the closeness gap between Spain and the European average is
widest among older adults and those with the fewest years of education.
1718
2. LEVEL OF SCIENTIFIC KNOWLEDGE
In this chapter, we examine the cognitive dimension of social perceptions of science, i.e.,
the extent to which citizens are familiar with and understand science and its method. We
accordingly assess the main dimensions used as standard in social perceptions of science
studies, namely:
   2.1. Level of knowledge of scientific concepts and theories:
       2.1.1. Level of subjective knowledge: the understanding interviewees think they
       have of selected scientific concepts and terms.
       2.1.2. Knowledge test: level of objective knowledge of selected scientific concepts
       and theories, i.e., the extent to which interviewees can identify correct
       statements regarding theories and principles drawn from disciplines like biology,
       physics, etc.
   2.2. Understanding of the way scientific knowledge is generated:
       2.2.1. Grasp of the concept of “probability”.
       2.2.2. Validation of science: science as experimentally tested and published
       knowledge.
       2.3. Familiarity with the great scientists of all ages and countries

2.1. LEVEL OF KNOWLEDGE OF SCIENTIFIC CONCEPTS AND THEORIES
2.1.1. LEVEL OF SUBJECTIVE KNOWLEDGE
Major differences between countries in citizens’ understanding of scientific concepts
In order to measure the cognitive dimension of perceptions of science, the “International
Study on Scientific Culture” starts by examining interviewees’ declared understanding of
certain specialist terms. Each subject is offered a series of key scientific concepts and has
to state whether they understand them completely, partly or not at all. What is being
measured, therefore, is not their objective knowledge but what they subjectively
perceive that knowledge to be.
Taking the percentage that claim to understand each term completely, we can say that a
significant portion of the citizens of the 11 survey countries regard themselves as
knowledgeable about concepts like the power of gravity, DNA, the greenhouse effect and
the hole in the ozone layer. A rather smaller proportion believe they understand terms
like gene, mathematical equation, cloning, molecule, atom, ecosystem, genetically
modified food and stem cells (see table 13).

                                                                                          19
Table 13: The news media often employ specialist terms and expressions. I would like you to tell me in each case if,
when you hear or read the term or expression, you understand it completely, partly or not at all. Base: all cases
“Percentage saying they understand completely”
TOT
DK DE NL FR PL UK AT ES IT CZ USA
EU
Power of gravity 55.7 80.0 72.5 63.9 39.9 54.1 57.9 59.8 51.9 47.0 50.9 63.1
Hole in ozone
53.4 64.2 65.8 62.8 61.7 48.6 49.1 50.2 48.1 42.0 36.1 39.6
layer
Greenhouse effect 53.3 67.1 65.1 67.4 61.7 47.2 49.4 47.1 45.6 44.1 31.7 39.3
DNA 52.8 69.8 60.5 67.7 62.6 49.9 50.5 45.6 45.9 42.2 34.7 44.9
Gene 47.9 67.6 57.9 63.9 55.1 49.5 45.4 43.2 38.8 34.3 33.4 42.9
Cloning 47.3 61.6 56.1 62.1 59.8 44.9 41.5 36.7 41.5 36.4 27.3 35.4
Genetically
45.7 55.1 55.6 52.0 60.9 43.4 40.5 41.0 37.4 34.9 20.0 32.8
modified food
Mathematical
44.7 55.3 54.2 45.3 42.1 56.4 43.2 40.4 40.4 32.0 46.9 45.2
equation
Atom 44.7 56.0 58.2 53.2 49.0 49.9 37.9 42.0 36.6 31.6 40.1 39.3
Molecule 44.3 60.0 51.4 59.3 53.5 46.2 40.0 38.6 37.0 31.9 41.3 37.6
Ecosystem 44.1 56.5 57.8 53.8 49.6 40.7 36.7 44.0 39.9 33.5 31.3 35.8
Stem cells 40.2 55.6 52.3 51.3 44.6 36.9 33.0 31.6 38.3 32.3 20.7 33.0
Citizens’ perceived level of understanding varies significantly from one country to the
next. In order to explore this synthetically, we constructed a summated scale of the
concepts they claim to understand completely. This scale ranges from 0 to 12 in keeping
with the 12 terms presented. The average level of subjective knowledge stands higher in
European countries than the United States (see figure 14). By country:
The set of countries where respondents claim to understand completely over half
the concepts inquired about comprises Denmark, Germany, Netherlands and, at a
distance, France.
Next comes the group with subjective knowledge of between 5 and 6 concepts:
Poland, United Kingdom, Austria and Spain. The United States too falls within this
group.
Finally we have the countries where respondents say they understand fewer than
5 concepts: Italy and the Czech Republic.
202.1.2. KNOWLEDGE TEST
Marked inter‐country differences by level of objective knowledge
As well as subjective understanding, the BBVA Foundation study scored respondents for
their level of objective knowledge of selected scientific concepts and theories according
to their number of correct responses to statements drawn from disciplines like biology,
physics, etc. For each statement, like, for instance, “The gene is the basic unit of heredity
of living beings”, respondents could answer totally true, probably true, probably false or
totally false. In some cases, the hypothesis presented was true and in others it was false.
Citizens of survey countries showed themselves more familiar with basic scientific
concepts, and less sure about more complex questions drawn from physics, biology and
biotechnology in particular. As a rule, they were also shakier on recent areas like those
related to genetic engineering (see table 15).
Over 80% of citizens in the majority of counties surveyed know that “Hot air rises (T.
true)”, that “The continents on which we live have been moving for millions of years
and will continue to move in the future (T)”, “The oxygen we breathe comes from
plants (T)” and “The gene is the basic unit of heredity of living beings (T)”
Over 70% in a majority of countries know that “Earth’s gravity pulls objects towards it
without them being touched (T)” and over 60% are able to answer correctly that
“Energy cannot be created or destroyed, but only changed from one form to another
(T)”; “Almost all microorganisms are harmful to human beings (F: false)”; “Generally
speaking, human cells do not divide (F)”; and “The earliest humans lived at the same
time as the dinosaurs (F)”.
21 However, levels of knowledge tail off considerably, as well as differing more between
countries, with regard to statements like: “Human stem cells are extracted from
human embryos without destroying the embryos (F)”; “Antibiotics destroy viruses
(F)”; “Atoms are smaller than electrons (F)”; and “Today it is not possible to transfer
genes from humans to animals (F)”.
Table 15: Could you please tell me for each of the following statements to what extent you think it is true or false. Base: all
cases
“Percentage answering correctly” (totally true or probably true – probably false or totally false as appropriate)
TOT DK NL DE CZ AT UK FR PL IT ES USA
EU
Hot air rises (T) 91.0 97.7 96.2 95.7 95.6 95.0 96.2 93.0 88.1 83.5 82.0 95.0
The continents have been moving 86.0 96.5 92.6 93.1 86.4 90.4 88.8 91.4 76.1 79.1 77.3 80.1
for millions of years and will
continue to move in the future (T)
The oxygen we breathe comes from 83.0 89.5 86.0 92.2 84.7 90.1 84.3 79.6 82.1 75.9 76.8 94.2
plants (T)
The gene is the basic unit of heredity 82.0 93.3 89.1 91.9 88.5 73.7 84.4 79.9 80.9 75.2 71.4 81.7
of living beings (T)
Earth’s gravity pulls objects towards 78.5 87.9 77.6 89.3 83.9 87.2 82.6 67.0 78.9 71.5 74.4 80.4
it without them being touched (T)
Energy cannot be created or 65.5 62.4 61.2 64.5 71.4 64.6 66.2 68.7 56.1 63.2 73.6 80.1
destroyed, but only changed from
one form to another (T)
Almost all microorganisms are 63.2 83.3 83.0 73.6 74.1 68.0 69.5 65.5 51.9 53.2 44.9 56.2
harmful to human beings (F)
Generally speaking. human cells do 62.5 76.9 78.1 74.4 71.7 65.7 65.8 67.4 56.0 51.4 43.2 57.6
not divide (F)
The earliest humans lived at the 61.0 69.6 69.6 75.7 77.1 71.9 59.9 68.8 52.2 42.1 51.6 42.5
same time as the dinosaurs (F)
Plants have no DNA (F) 59.7 72.0 74.0 65.7 61.7 61.7 67.6 64.5 53.5 49.2 45.1 64.4
The greenhouse effect is caused by 57.7 82.5 69.9 70.1 63.7 64.5 62.9 62.9 46.5 49.7 34.4 46.5
the use of nuclear power (F)
All radioactivity is a product of 55.8 72.4 65.6 69.5 62.8 64.5 59.5 57.4 44.2 45.6 41.3 61.6
human activity (F)
22TOT DK NL DE CZ AT UK FR PL IT ES USA
EU
Ordinary tomatoes, the ones we 54.3 71.0 73.4 66.0 59.7 62.9 55.4 53.1 47.8 49.9 35.4 47.6
normally eat, do not have genes,
whereas genetically engineered
tomatoes do (F)
It is the father’s gene that 51.6 45.3 51.7 44.1 52.8 54.9 56.3 53.4 44.7 62.0 47.1 75.1
determines a newborn baby’s sex;
whether it is a boy or a girl (T)
Lasers work by sound waves (F) 48.1 60.6 60.7 49.9 44.6 46.9 56.3 58.4 38.8 42.0 32.9 53.5
The light that reaches the Earth from 44.2 60.4 58.5 49.0 44.4 37.4 54.2 44.5 40.5 37.9 28.8 54.7
the sun is made up of a single color:
white (F)
Today it is not possible to transfer 40.7 50.4 52.9 45.6 52.9 49.5 48.4 40.8 40.1 30.0 27.6 42.8
genes from humans to animals (F)
Atoms are smaller than electrons (F) 38.1 47.6 39.0 37.5 55.4 40.7 33.9 45.9 42.0 34.8 30.4 49.9
Antibiotics destroy viruses (F) 36.4 43.1 46.5 36.0 26.2 33.8 42.0 49.3 27.5 32.9 24.3 46.5
Human stem cells are extracted 28.8 30.7 39.9 42.6 40.9 38.3 28.1 19.8 25.3 25.2 17.4 54.4
from human embryos without
destroying the embryos (F)
23To this battery we added two further knowledge questions whose format was different
but which also offered one correct and one incorrect answer.
A large majority in every country knows that the Earth moves around the sun, and not
vice versa, and that light travels faster than sound (see figure 16).
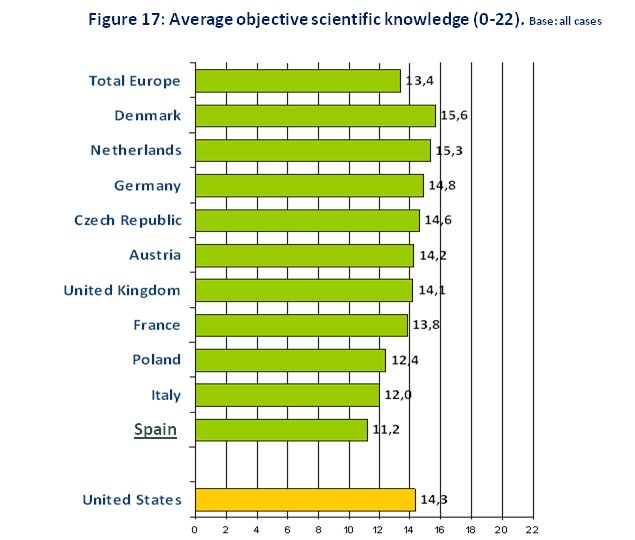
24Denmark and the Netherlands register the highest knowledge levels and Spain the
lowest
To more plainly illustrate inter‐country differences, we constructed a single knowledge
measure by summing the correct answers to the 20 questions in the knowledge battery
and the additional two about the Earth’s movement and the speed of light3.
On the resulting scale from 0 to 22, all countries score higher than the median value (11
correct answers out of 22). The United States comes out slightly ahead of the European
average. On the whole, countries occupy positions similar to those observed in the maps
of closeness to science and subjective knowledge of scientific terms, albeit with some
peculiarities. Specifically, Denmark, the Netherlands, Germany and the Czech Republic
appear at the top of the knowledge map, followed in the middle by Austria, the United
Kingdom, France and the United States, and with Poland, Italy and Spain occupying the
lower reaches. Spaniards score lowest of all by the measure of objective knowledge
(average of 11.2 correct answers vs. a European average of 13.4). The Czech Republic
stands out as occupying a higher position on the objective knowledge scale than on those
of closeness or subjective knowledge.
3
The scale has a high confidence level as evidenced by a Cronbach’s alpha coefficient of 0.90 for the
European sample as a whole.
25Grouping knowledge “test” answers into three segments (“high”: 16 to 22 right answers;
“medium”: 8 to 15 right answers and “low”: 0 to 7 right answers) throws inter‐country
differences into greater relief. A majority of respondents in Europe and the United States
fall within the medium knowledge segment. Where major differences emerge is in the
relative size of the high knowledge segment: over 50% in Denmark, the Netherlands and
Germany, around 40% or higher in the Czech Republic, Austria and the United Kingdom,
France and the United States, and around 25% in Poland, Italy and Spain. Also, compared
to countries like Denmark or Netherlands where only tiny percentages (2%) are excluded
from scientific knowledge – low knowledge level – over 20% of Spaniards are in this
situation. The low knowledge segment extends to around 15% in Italy and Poland and
less than 10% in the remainder of the survey countries (see figure 18).
Educational level and degree of connection with science are strong differentiating
factors for scientific knowledge
Inter‐country diversity in knowledge levels does not mean that levels are homogeneous
within each country or that nationality is the main differentiating factor. Within each
society, levels of knowledge are influenced by sociodemographic characteristics like sex,
age and educational level: the trend in the majority of countries is for men, young adults
and those of a higher educational level to score higher on the science “test”; while
women, elderly adults and those with fewer years of study come further down the scale.
Of the sociodemographic variables analyzed (sex, age, education), educational level
(measured as the age when respondents finished studies) was found to be the strongest
differentiating factor for knowledge in all the countries surveyed.
As we can see from figure 19, showing the distribution for all European countries, Spain
and the United States, knowledge disparities by sex, age and, above all, education,
acquire considerable importance. In Spain concretely, we can see that age and education
are stronger determinants of average knowledge than in European countries as a whole.
26The distance between Spaniards’ knowledge and the European average is considerably
wider among elderly than young adults. Specifically, 13% of young Spaniards fall within
the low knowledge segment compared to 10% on average in the same age group in
Europe. In contrast, 57% of elderly Spanish adults are in the low knowledge group
compared to the 22% average of elderly adults Europe‐wide.
Closeness to science (attentiveness to scientific information, involvement in science‐
related activities and connection with the scientific career) clearly stands in positive
relation to level of knowledge, such that knowledge is increasing with degree of
closeness. In the case of Spain, 56% of those evidencing a “high” closeness to science
have a high level of scientific knowledge, compared to just 8% of those in the “none”
group. In effect, closeness, alongside years of education, are the variables that most
influence knowledge level.
The influence of sociodemographic and attitudinal characteristics on knowledge levels is
also apparent when we look at specific items on the scientific knowledge scale (see figure
20). Taking the set of European countries and Spain on its own, we find that the strong
positive link between closeness to science (attentiveness to information, involvement in
activities, connection with the scientific career) and scientific knowledge is borne out by
the fact that the percentage of those giving correct answers to two items on the
knowledge scale is almost double among those evidencing a high degree of closeness
than those evidencing none. The importance of education as a differentiating factor for
knowledge is also confirmed by the fact that the number of correct answers rises
significantly among those who finished studying at an older vs. a younger age. Age too is
a determinant of knowledge, and significantly more so in Spain than elsewhere in
27Europe: the percentage correctly labeling as false the statement that plants have no DNA
was 59% in the 25 to 34 age group against just 20% among those aged 65 and over. Sex,
finally, had only a moderate influence, with men slightly ahead of women in the
percentage responding correctly to these items.
282.2. UNDERSTANDING OF HOW SCIENTIFIC KNOWLEDGE IS GENERATED
2.2.1. GRASP OF THE PROBABILITY CONCEPT
As well as knowledge of scientific concepts, the BBVA Foundation study examined
respondents’ grasp of key characteristics of the scientific method, including the concept
of probability.
Interviewees were presented with the following situation: “A doctor tells a couple that
according to their genetic tests, they have a one in four chance of having a child with a
hereditary disease”. They then have to choose one of the following alternatives to
express what the doctor meant by this4: If their first three children are healthy, the
fourth will inherit the disease; If the first child has the disease, the next three will not;
Each child the couple has will have an equal chance of suffering the disease; If they only
have three children, none of them will suffer the disease.
A majority in almost all countries said what the doctor meant was that “Each child the
couple has will have an equal chance of suffering the disease”. This response was a little
more popular in the United States vs. the European average. Within Europe, it found the
widest support in the Netherlands and Denmark, and the least support in Austria. In
Spain, it was the choice of 60%, a little below the European average (65%) (See figure
21). Only minority percentages across the sample answered that what the doctor meant
was one of the other three options.
Figura 21: Un médico le informa a una pareja que según su análisis genético tienen una posibilidad entre cuatro de
tener un hijo con una enfermedad hereditaria. ¿Cree usted que lo que el médico quiere decir con esto es que ...?
«Porcentaje que contesta afirmativamente» Base: total de casos
Cada uno de los hijos de la pareja Si los tres primeros hijos son Si el primer hijo tiene la Si sólo tienen tres hijos,
tiene el mismo riesgo de sufrir la sanos, el cuarto heredará la enfermedad, los tres restantes ninguno tendrá la
enfermedad enfermedad no la tendrán enfermedad
Total Europa 65,3 16,7 12,7 8,4
Países Bajos 91,0 8,7 5,4 2,9
Dinamarca 88,7 6,7 3,7 3,5
Reino Unido 74,2 13,8 9,2 4,6
Francia 66,1 16,1 12,8 10,7
República Checa 65,6 25,0 19,5 10,2
Alemania 65,1 19,5 13,5 10,8
España 60,0 14,5 10,1 5,0
Polonia 58,8 23,9 20,1 11,7
Italia 57,4 14,1 12,7 8,5
Austria 48,2 26,5 21,7 12,6
Estados Unidos 74,0 13,7 7,7 4,2
0 20 40 60 80 100 0 20 40 60 80 100 0 20 40 60 80 100 0 20 40 60 80 100
4
Alternatives are not mutually exclusive, since interviewees were asked to reply “yes”‐“no” to each of the
explanations offered.
29In order to track understanding of the probability concept across all survey countries, we
constructed an indicator of those answering correctly that when a doctor tells a couple
they have a one in four chance of having a child with a hereditary disease, he or she
means that “each child the couple has will have an equal chance of suffering the
disease”, while rejecting the other options (he or she means neither that “if their first
three children are healthy, the fourth will inherit the disease” nor that “if the first child
has the disease, the next three will not” nor that “if they only have three children, none
of them will have the disease”). By this yardstick of understanding, the segment
demonstrating a complete grasp of the concept of probability stands at around 80% in
Denmark and the Netherlands, 60% in the United Kingdom and United States, 50% in
France, Germany and Spain, and 40% in the Czech Republic and Italy, and attains its
lowest level in Austria and Poland (around 30%).
Table 22: Percentage answering correctly with regard to the concept of probability (saying that the doctor
means that “each child the couple has will have an equal chance of suffering the disease”, and neither that
“if their first three children are healthy, the fourth will inherit the disease” nor that “if the first child has
the disease, the next three will not” nor that “if they only have three children, none of them will have the
disease”. Base: all cases
Total Europe 48.5
Denmark 81.4
Netherlands 79.3
United Kingdom 59.8
France 50.7
Germany 48.4
Spain 45.7
Czech Republic 41.9
Italy 39.8
Austria 33.5
Poland 32.7
United States 60.6
2.2.2. VALIDATION OF SCIENCE
Testing is seen as the main way to validate a scientific theory
Besides understanding key scientific concepts and principles, another essential
dimension of scientific culture is knowing how knowledge is obtained and validated.
The majority of respondents in the survey affirm that for a scientific theory to be
considered true, it is vital that the results should be tested, both by the researcher
concerned and other scientists. Importance is accordingly attached to whether it has
been tested through experiments and, also, whether other scientists have repeated the
experiment with similar results (over 40% describe these two criteria as “very
important”). Adding on those who define it as “fairly important”, we find that over 85%
of citizens in all societies believe that experimental testing or the possibility of repeating
the experiment with similar results are key ways to validate scientific theories (see figure
23).
30The publication of results is considered another factor of weight, albeit less so than
testing. Between 20% and 30% in almost all countries say it is very important that the
results are published in a scientific journal, and between 10% and 20% that they are
reported in a mass communication medium like the newspapers or TV.
Citizens in the United States attach more importance to the testing and repetition of
experiments than the European average. Within Europe, the Danes are the most inclined
to see these two attributes as very important, but are also the least convinced, along
with the Dutch, of the importance of results being published in a mass communication
medium. Spaniards stand close to the European average in the importance assigned to all
these aspects.
Questioned about the validity of scientific theories, an ample majority in all survey
countries regard it as relative rather than absolute, i.e., they believe that a theory now
considered true will not necessarily be considered true in future.
Those likeliest to perceive scientific knowledge as subject to change are the Danes and
the Dutch, followed by French and Germans. Although only a minority in all countries
respond that a scientific theory will be true forever, this view finds widest support in Italy
(23%), Spain (18%) and Poland (17%). In Spain, specifically, although a majority believe
that scientific theories now considered true may cease to be so in future, the percentage
choosing this response is the lowest of any country in the survey. In effect, a significant
percentage believe the theory will be true forever or feel unable to state an opinion (see
figure 24).
312.3. FAMILIARITY WITH THE GREAT SCIENTISTS
Albert Einstein, the best known scientist
Another measure of citizens’ familiarity with science is their ability to identify those who
have made seminal contributions to science. They were accordingly asked to give the
names of three scientists of any age or country.
The first thing that strikes us is the difference between countries in the percentage
unable to name a single scientist; a fact presumably indicative of a weak scientific
culture. Difficulties identifying even one scientist affect a similar percentage in Europe
and the United States (27%), but rise significantly in Spain (46%), followed by Italy (31%),
the United Kingdom (27%), Poland (26%) and France (25%). In remaining countries,
around 20% could not name any scientists, and a smaller percentage in Denmark (15%)
(see table 25).
32Table 25: Percentage that cannot or prefer not to mention the name of any scientist. Base: all cases
Total ES IT UK PL FR CZ AT DE NL DK US
EU
27.1 45.9 30.5 26.8 26.0 24.5 23.4 20.2 19.4 18.8 14.7 27.4
Among those able to identify at least one scientist, Albert Einstein is the name
mentioned most frequently by citizens in the 11 survey countries. His 42% of mentions in
Europe and 50% in the United States place him far ahead of his nearest rivals. Within
Europe, the percentages mentioning Einstein run from 54% in Germany and 51% in
Denmark to 30% in Poland and 32% in Spain.
A long way behind, a consensus forms around the figures of Isaac Newton (13% in Europe
as a whole with his highest share of mentions in the United Kingdom, 24%), Marie Curie
(11% on average in Europe, 45% in Poland), Louis Pasteur (9% in Europe, 37% in France),
and Galileo Galilei (8% in Europe, 18% en Italy).
Scientists known as physicists, like Galileo Galilei and Newton, tend to be well
represented, while those whose names are associated with DNA or more recent
discoveries receive far less recognition.
National scientists feature prominently in most countries
Aside from these names, we observe a wide dispersion and heterogeneity among the
other scientists mentioned. Citizens in each country tend to include more national figures
in their lists or mention them in a higher position. For instance, 44% of Danes mention
Niels Bohr, 32% of Poles mention Nicolaus Copernicus, 15% of Americans mention
Thomas Edison and 11% Ben Franklin, 13% of Italians mention Rita Levi Montacini and
10% Leonardo Da Vinci, 11% of Germans mention Robert Koch and 10% Wilhelm Conrad
Röntgen, and 11% of the British mention Stephen Hawking. Spaniards however accord
far less recognition to great national figures, and mention them less frequently than
scientists from other countries. Hence Santiago Ramón y Cajal is mentioned by around
5% of Spaniards and Severo Ochoa, mentioned by 2.5%, does not even make into the top
five.
Table 26 on the next page shows the top ten names mentioned in each of the survey
countries.
33Table 26: Could you give me the names of the 3 scientists who you think have been the most important in all of
history? All mentions.
Germany Austria
Albert Einstein 53.9 Albert Einstein 47.6
Robert Koch 11.2 Isaac Newton 14.1
Galileo Galilei 9.8 Thomas Alva Edison 11.2
Wilhelm Conrad Röntgen 9.7 Galileo Galilei 10.4
Isaac Newton 9.7 Marie Curie 9.4
Marie Curie 9.9 Sigmund Freud 9.1
Thomas Alva Edison 6.1 Wilhelm Conrad Röntgen 6.1
Wernher von Braun 5.8 Charles Darwin 5.1
Alfred Nobel 5.0 Leonardo Da Vinci 4.8
Albert Schweitzer 4.8 Alfred Nobel 4.4
Denmark Spain
Albert Einstein 51 Albert Einstein 31.6
Niels Bohr 43.5 Isaac Newton 15.2
Isaac Newton 14.5 Alexander Fleming 6.4
Thomas Alva Edison 12.6 Thomas Alva Edison 5.8
Tycho Brahe 8.9 Marie Curie 5.5
Charles Darwin 8.9 Santiago Ramón y Cajal 4.8
Alexander Graham Bell 7.1 Steven Hawkins 4.4
Hans Christian Ørsted 5.8 Galileo Galilei 4.0
Sigmund Freud 4.6 Louis Pasteur 4.0
Marie Curie 4.2 Charles Darwin 3.9
France Italy
Albert Einstein 41.2 Albert Einstein 37.3
Louis Pasteur 37.1 Galileo Galilei 18.4
Marie Curie 26.2 Rita Levi Montalcini 12.7
Pierre & Marie Curie 9.4 Isaac Newton 12.4
Isaac Newton 7.9 Leonardo Da Vinci 10.3
Galileo Galilei 6.5 Alessandro Volta 6.8
Leonardo Da Vinci 4.5 Enrico Fermi 6.1
Alexander Fleming 2.6 Margherita Hack 6.0
Christiaan Barnard 2.6 Guglielmo Marconi 5.9
Thomas Alva Edison 2.5 Antonino Zichichi 5.2
Netherlands Poland
Albert Einstein 57.8 Marie Curie 45.3
Isaac Newton 15.8 Nicolaus Copernicus 32
Alexander Graham Bell 12.6 Albert Einstein 30
Charles Darwin 8.8 Isaac Newton 11.3
Thomas Alva Edison 8.3 Thomas Alva Edison 8.3
James Watt 6.9 Alfred Nobel 7.3
Marie Curie 6.2 Louis Pasteur 2.6
Louis Pasteur 5.8 Pythagoras 2.6
Leonardo Da Vinci 5.5 Charles Darwin 2.3
Sigmund Freud 4 Alexander Graham Bell 2
34You can also read