Beef & Sheep September 2020 - MARKET SNAPSHOTS - Meat & Livestock Australia
←
→
Page content transcription
If your browser does not render page correctly, please read the page content below
MARKET SNAPSHOTS

Beef & Sheep
September 2020

                 MLA INDUSTRY INSIGHTS   i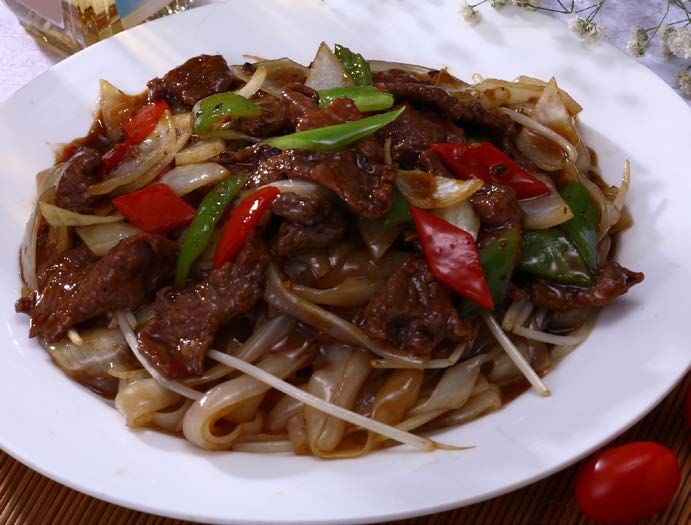
MARKET SNAPSHOTS
Beef & Sheep
Contents
Overarching impact of COVID-19 on the global market                                                                                                                       1

Australian exports – key cuts summary                                                                                                                                    4

Australia                                                                                                                                                              10

North America                                                                                                                                                          14

Japan                                                                                                                                                                 23

Korea                                                                                                                                                                 29

Greater China                                                                                                                                                         35

South-East Asia                                                                                                                                                       45

Middle East and Northern Africa (MENA)                                                                                                                                52

European Union (EU)                                                                                                                                                   59

© Meat & Livestock Australia, 2020 . ABN 39 081 678 364. MLA makes no representations as to the accuracy of any information or advice contained in MLA’s Market
snapshot and excludes all liability, whether in contract, tort (including negligence or breach of statutory duty) or otherwise as a result of reliance by any person on such
information or advice. All use of MLA publications, reports and information is subject to MLA’s Market Report and Information Terms of Use. Please read our terms of use
carefully and ensure you are familiar with its content.

FOR FURTHER INFORMATION VISIT US ONLINE AT: www.mla.com.au or email us at: globalindustryinsights@mla.com.au

                  MLA MARKET SNAPSHOT                         BEEF AND SHEEPMEAT                                                            September 2020               II
MARKET SNAPSHOT l BEEF & SHEEPMEAT
Overarching impact of COVID-19 on the
global market
COVID-19 has had an overbearing influence upon Australia’s domestic and global markets since the start of 2020. The outbreak of
COVID-19 has caused widespread global disruption and never before seen action from governments around the world, impacting all
industries. The impact of the pandemic across red meat markets varies and has been shaped by many pre-existing factors, such as a
country’s dependence on imports, the level of consumer disposable income and the prominence of red meat in consumer diets. The
market impact has also reflected evolving factors, such as the success of virus containment, the level of restrictions imposed by the
government and the speed of economic recovery.
COVID-19 has caused widespread social, economic, logistical, travel and trade disruptions and triggered unprecedented regulatory
and stimulatory action from governments around the world. The combined impact on the Australian red meat industry from the
economic slowdown, disruption to foodservice channels and dislodgement of supply chains is impossible to estimate as conditions
remain fluid.
The pandemic has created a volatile trading environment with many unique circumstances. Government restrictions have caused
significant changes to where Australian red meat is purchased and consumed. COVID-19 has also caused a significant downgrade in
the global economic outlook that will result in a recession that is both broader and deeper than the Global Financial Crisis (GFC), hitting
disposable income and, subsequently, purchasing behaviour. With no vaccine available, COVID-19 will continue to disrupt the
consumption of Australian red meat both domestically and internationally.
EVOLUTION OF IMPACT
The evolution of COVID-19 and its impact on markets, can be considered in a number of phases. The initial phase is shock and
reaction, followed by lockdown and adaption, and then a gradual shift to a ‘new normal’. However, as many countries have faced a
refreshed outbreak, it is unknown how these will evolve. Each of these stages have different impacts upon consumers, the economy,
logistics, channels of operation and ultimately how and what Australian red meat is consumed and purchased.
COVID-19 total monthly cases COVID-19 total monthly cases - excluding US
2,000,000 140,000
120,000
1,500,000
100,000
Cases
Cases
80,000
1,000,000
60,000
40,000
500,000
20,000
0 0
ne
ne
ay
ay
ry
ry
ch
t
y
y
ch
t
ly
ly
ril
ril
us
us
ar
ar
Ju
Ju
ua
ua
Ap
Ap
Ju
M
Ju
M
ar
ar
g
g
nu
ru
Au
Au
n
br
M
M
b
Ja
Ja
Fe
Fe
Australia US UK China Japan Korea Indonesia UAE Australia UK China Japan Korea Indonesia UAE
Source: European Centre for Disease Prevention and Control Source: European Centre for Disease Prevention and Control
MLA MARKET SNAPSHOT BEEF AND SHEEPMEAT COVID-19 September 2020 1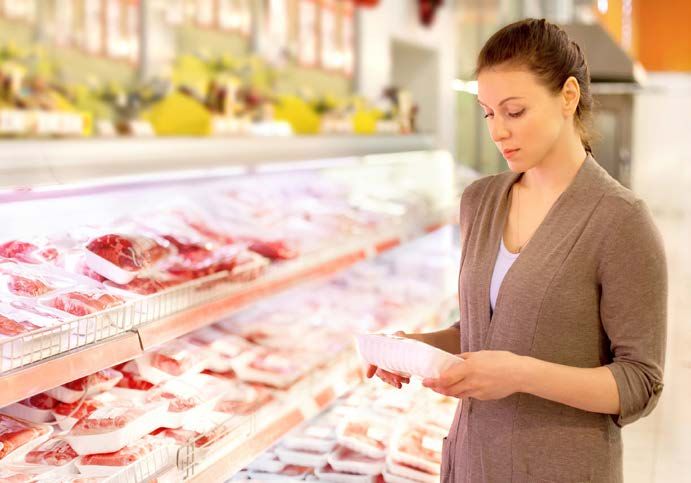
CONSUMER IMPACT
The multi-layered impact of COVID-19 has prompted some significant shifts in consumer purchasing behavior and perceptions. Broadly,
COVID-19 has led many consumers to seek products that they trust and have an increased focus on health, hygiene and quality.
Australia’s strong credibility, with high safety and quality standards, gained in
markets over decades of combined industry investment, should continue to
bolster strong consumer demand for Australian red meat.

When thinking about current concerns, COVID-19 is top of mind for consumers
globally (followed by unemployment and healthcare). However, consumer
sentiment varies significantly across countries impacted by COVID-19. Generally
optimism and anticipated spending are largely correlated globally and is typically
higher at the start and end life stages of the outbreak curve. More than two in
five consumers globally are spending more time cooking/preparing food at
home. While approaches to recipe and cuisine experimentation vary, familiarity
with red meat remains key at this time.

ECONOMIC IMPACT
The full impact of COVID-19 on the global economy will depend on when the virus comes under control, but much damage has already
been done. The global economy, and most of Australia’s key red meat markets, are facing a significant slowdown or outright recession
as a result of COVID-19.

                Real GDP growth – selected markets                                                                                          Total and per capita GDP – selected markets

  8.0                                                                                                                                  25                                                                             80
                                                                              Saudi
           US    China   Japan     UK    Korea   Canada Australia Indonesia   Arabia   Taiwan
  6.0                                                                                                                                                                                                                 70
                                                                                                                                       20
                                                                                                       Nominal GDP, ‘000 US$ billion

  4.0                                                                                                                                                                                                                 60

                                                                                                                                                                                                                           GDP per capita, ‘000 US$
  2.0
                                                                                                                                                                                                                      50
                                                                                                                                       15
  0.0
                                                                                                                                                                                                                      40
  -2.0                                                                                                                                 10                                                                             30
  -4.0
                                                                                                                                                                                                                      20
  -6.0                                                                                                                                  5
                                                                                                                                                                                                                      10
  -8.0
                                                                                                                                       0                                                                              0
 -10.0                                                                                                                                      US   China   Japan   UK   Korea Canada Australia Indonesia Saudi Taiwan
                                                                                                                                                                                                       Arabia

                                                                                                                                                        2019    2020f          2021f   2022f
                    2019         2020f    2021f       2022f         2023f
                                                                                                                                                 per capita 2020f (RHS)         per capita 2022f (RHS)
 Source: Fitch Connect                                                                                      Source: Fitch Connect

Dropping gross domestic product level across markets doesn’t determine demand for Australian red meat on its own. It does, however,
reflect the broader health of an economy and correlates with unemployment, consumer confidence and income – factors which directly
impact red meat sales. With many key markets now in the midst of an economic recession, tighter disposable incomes may encourage
greater consumption of lower-priced substitutes.
While the impact from COVID-19 on Australian red meat demand may be more severe than any economic downturn in recent history,
the industry will be more sheltered than many sectors. People still need to eat, and red meat plays a central role in a broad mix of
cultures and cuisines.
There are some lessons from recent economic downturns and the impact on consumer behaviour, which include:
   •     more budgeting/planning and reduced spending (particularly for non-essentials)
   •     price and promotions become more critical and private label becomes more acceptable
   •     discount retail grows; retailer variety becomes accepted.

            MLA MARKET SNAPSHOT                    BEEF AND SHEEPMEAT                      COVID-19                                                                                            September 2020                              2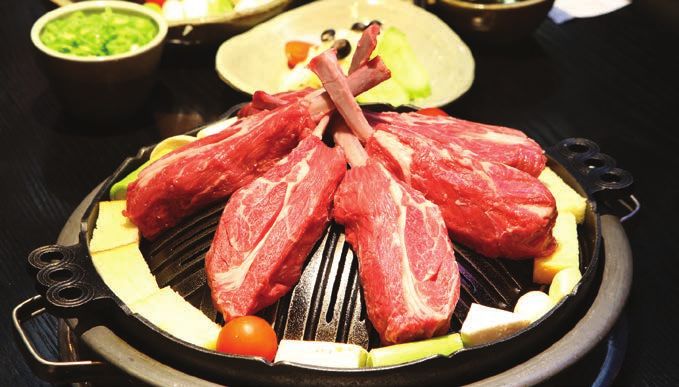
FOODSERVICE AND RETAIL IMPACT
The unprecedented nature of the outbreak has created a multitude of headwinds, one of which is the slowdown of global foodservice
industries, a key channel for Australian red meat. Correspondingly, the retail channel has experienced an increase in demand as
people have been restricted to home and spent more time cooking and preparing meals.
While increasing retail demand is a positive and has helped offset the slowdown in foodservice channels, a number of issues have
emerged from this shift. Typically, higher value loin cuts make their way into foodservice, balancing out the overall value of the carcase
for processors. With most markets facing a slowdown in foodservice demand, carcase balance has become a major challenge.
The impact of this shifting demand differs across markets, depending on the weighting of consumption between retail and
foodservice channels, as well as the ability for supply chains to adapt and repurpose products. It is clear, however, that the recovery
of the foodservice sector, a key channel for higher-value beef and lamb cuts, will be critical for the future demand prospects of
Australian red meat.
While fundamental consumer needs for foodservice are likely to remain
unchanged, their behaviour towards foodservice will be influenced by the
economic situation, channel choice (online/offline) and experience during the
pandemic (i.e. more cooking at home, supporting local community etc.). Some
operational trends that appear to have emerged in the foodservice channel due
to COVID-19 are around sanitation, cashless/contactless services, delivery,
changed offerings, hybrid operations, ghost kitchens and automation/innovation.
Unlike the foodservice channel, retail has largely benefited from the COVID-19
outbreak. The retail shopper’s response changes and evolves over the various
COVID-19 stages from stockpiling and switching to online, to a focus on fresh/
local and finally a shift to health/value. Similarly, retailers have adapted as well,
with many ramping up online capacity, creating new partnerships, developing
new ways of delivery and generally adjusting to meet new or evolved
consumer needs.

SUPPLIER IMPACT
COVID-19 difficulties have been compounded by the logistical and operational barriers it has created, such as port bottlenecks, limited
refrigerated container availability, disruptions to air-freight and labour shortages. These factors have all complicated red meat supply
and caused temporary disruptions across markets. Australia’s ability to adapt to various supply chain difficulties and continue supplying
product with as much normality and consistency as possible will enable it to continue servicing demand, which is particularly important
for markets that rely on imports for national food security.

          MLA MARKET SNAPSHOT         BEEF AND SHEEPMEAT        COVID-19                                             September 2020      3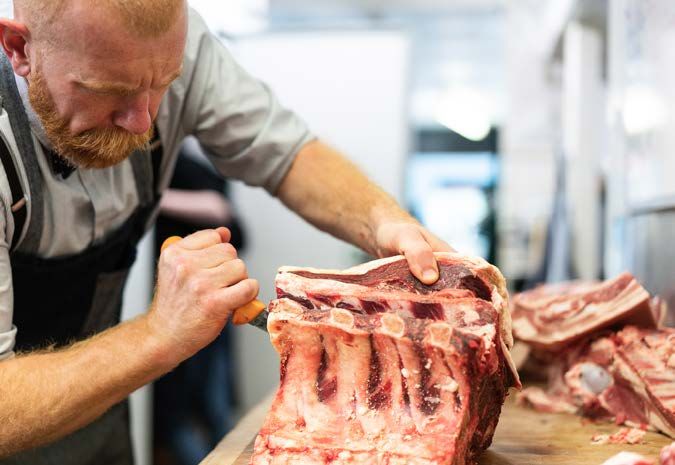
MARKET SNAPSHOT l BEEF & SHEEPMEAT
Australian exports – key cuts summary
BEEF
• In 2019–20, Australian beef production increased by 1% year-on-year, while export volume was up 5% from year-ago levels.
• 1,778,000 tonnes carcase weight (cwt), or 76% of Australian beef produced in 2019–20, was exported to overseas markets.
Australian beef export volume by market
350
300
250
200
‘000 tonnes swt
150
100
50
0
ina
n
US
ea
sia
an
s
da
m
a
ia
e
E
d
ds
ne
bi
pa
UA
or
an
ys
na
lan
iw
r
na
ne
Ch
ra
Ko
ap
pi
Ja
ail
ala
et
Ta
iA
Ca
do
er
ilip
ng
Th
Vi
M
th
ud
In
Ph
Si
Ne
Sa
Source: DAWE, major markets only 2018–19 2019–20
• Australian beef exports are heavily geared towards Asia, with 74% of total beef exports in 2019–20 destined for the region. The
remainder was split between North America (21%) and the Middle East region (2%).
• Asian markets have been consistent customers of forequarter cuts, taking more than 95% in 2019–20. Their share of total
manufacturing and loin cuts also increased from 57% in 2018–19 to 60% in 2019–20.
• A large proportion of export growth in Asia in 2019–20 was driven by China, as the country increased imports of all proteins,
including beef, as a result of the protein shortage caused by African Swine Fever (ASF) wiping out 40-50% of China’s pig herd.
• There has been a strong increase in chilled grassfed fullsets* to the US, registering a 23% year-on-year rise during 2019–20.
* Fullsets are commonly a set of 12~14 cuts. Some fullset exports may be captured under individual cuts.
Australian beef exports by cut
450
400
350
‘000 tonnes swt
300
250
200
150
100
50
0
g
e
k
e
et
in
nk
bs
p
s
in
*
se
ck
ck
ts
e ll/
et
kle /
d /
ll
er
uc nk
ll
ib
tsi de
an
ad
id
rin
m
ro
cu
ey ro
lo
lo
lls
ro
isk
u
Ne
a
Ri
fla
Sh e
th
tr
ins
kn fla
Ru
rip
er
Ch
rc
sh
ou rsi
tu
Bl
Fu
k
b e
er
O
or
Br
in
uc
Ca
nd
ac
Ri ub
ick
in/
e/
lve
St
th
Sh
Th
Ch
id
uf
Te
C
Th
O
Si
ps
an
To
M
Source: DAWE. * Ground beef, hamburger patties and other mince products 2018–19 2019–20
MLA MARKET SNAPSHOT BEEF AND SHEEPMEAT AUSTRALIAN EXPORTS – KEY CUTS SUMMARY September 2020 4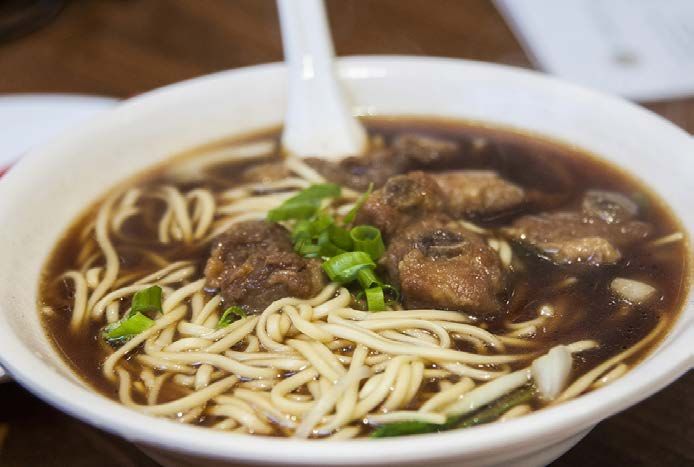
KEY CUTS SUMMARY
     Brisket
     • Brisket has long been a popular cut with Chinese buyers for local processing into the foodservice sector, suited to slow-cook and hot
       pot recipes popular with Chinese consumers. Besides strong overall demand for Australian beef across sectors, the growth in chilled
       brisket exports was also supported by affluent Chinese consumers, who prefer chilled products for home cooking, which they have
       been doing more of due to COVID-19.
     • This cut has also continued to see strong demand from Japan and Korea, where it is a popular ingredient in various local dishes such
       as gyudon (beef rice bowl in Japan) and in many soups in Korean cuisine. That said, more Japanese and Korean buyers likely shifted
       from Australian to US product recently with increasing supplies of US shortplates, combined with strong competition from China for
       Australian briskets.

                          Brisket – exports by market                                                          Brisket – volume change by market
                                                                                                 15
                      1%
                    2%                                                                           12
                              5%
                     6%                                                                          9
al                                                      China

                                                                               ‘000 tonnes swt
                                                        Japan
                                                                                                 6
                              Total                     Korea
17             16%
                          115,617
                                        42%             Indonesia                                 3
                                                        Vietnam
                              tonnes                    US                                       0
                                swt                     Other
                                                                                                 -3
                         29%
                                                                                                 -6
                                                                                                       China       Japan      Korea     Indonesia       Vietnam    US

      Source: DAWE, 2019–20                                                    Source: DAWE                            2018–19 vs. 2017–18        2019–20 vs. 2018–19

     Chuck roll
     • Korea remains as the largest destination for Australian chuck roll. The ongoing challenge of price pressure from US product, as well
       as the tightened supply of Australian beef, saw exports into Korea decrease year-on-year. The cut is mostly imported frozen and
       utilised across the foodservice sector in casual and mid-level eateries as well as the catering sector.
     • China emerged as the second largest market for Australian chuck roll (particularly chuck eye roll and chuck roll five-rib), a cut already
       popular for its versatility for foodservice processing. In line with overall exports to the market, Australian chuck roll exports to China
       have continued to grow, more than doubling from 2018–19 levels. However, 2020 has seen stronger growth in demand for chilled
       chuck roll than frozen, due to consumers buying more beef at retail for cooking at home as a result of COVID-19, based on the
       convenience, quality, nutrition and taste advantages of chilled over frozen meat.

                       Chuck roll – exports by market                                                    Chuck roll – volume change by market
                                                                                                 12
                      1%                                                                         10
                    1%
                              5%                                                                  8
                      3%                                                                          6
                                                        Korea                                     4
                                                                               ‘000 tonnes swt

                                                        China
                                                                                                  2
                22%           Total                     Japan
                                                                                                  0
                                        40%             Taiwan
                          72,068                        Thailand                                 -2
                              tonnes                    US                                       -4
                                swt                     Other                                    -6
                                                                                                 -8
                          28%                                                                    -10
                                                                                                 -12
                                                                                                       Korea       China      Japan      Taiwan         Thailand   US

      Source: DAWE, 2019–20                                                    Source: DAWE                            2018–19 vs. 2017–18        2019–20 vs. 2018–19

                MLA MARKET SNAPSHOT        BEEF AND SHEEPMEAT        AUSTRALIAN EXPORTS – KEY CUTS SUMMARY                                           September 2020    5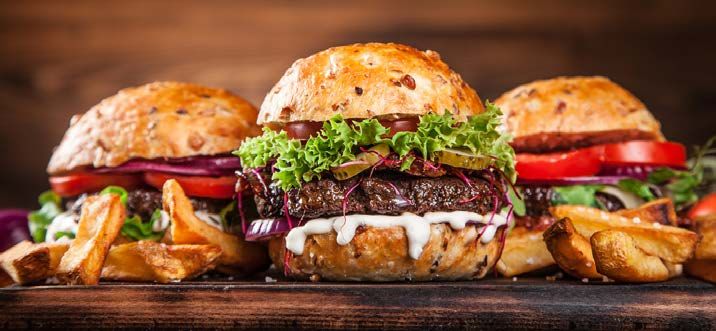
Loin cuts (striploin, tenderloin, cube roll/ribeye roll)
• The Japanese foodservice sector is one of the largest outlets for Australian loin cuts, however the market suffered a significant loss
  in demand from weddings and business functions in 2020 as a result of the COVID-19 pandemic.
• In 2020, demand in China for chilled beef, particularly the favoured loin cuts of cube roll/ribeye roll and striploin, saw notable growth
  in retail as affluent consumers increased their purchase of higher quality beef products for home consumption during and post the
  lockdown period. This has seen these chilled loin cuts grow faster than frozen in 2019–20 compared to the year before – by 83% and
  24% year-on-year, respectively.
• Albeit from a small base, loin exports to South-East Asia have been gradually growing, supported by the region’s economic growth
  and international tourism.

                   Loin cuts – exports by market                                                        Loin cuts – volume change by market

                                                                                           5

                                                                                           4
                                                    Japan
       2%                17%                        China                                  3
      2%                                            US
                                                                                           2
         3%                                         Korea

                                                                         ‘000 tonnes swt
        3%                Total        25%          Indonesia                              1
                                                    Singapore
        3%           87,065                         Canada
                                                                                           0
        4%               tonnes                     Vietnam                                -1
                           swt                      Taiwan
           7%                                       Hong Kong
                                                                                           -2
                                  19%               Other                                  -3
                   15%
                                                                                           -4
                                                                                                Japan    China   US      Korea   Indonesia Singapore Canada    Vietnam   Taiwan   Hong Kong

 Source: DAWE, 2019–20                                                   Source: DAWE                                 2018–19 vs. 2017–18           2019–20 vs. 2018–19

Manufacturing beef
• The US is a dominant buyer of 90 Chemical Lean (CL) manufacturing trim, however volumes to the market during 2019–20 declined,
  largely due to tight supply from Australia combined with COVID-19 related foodservice disruptions across the market.
• 65CL and 85CL are the most popular items among Japanese importers, with demand during 2019–20 supported by firm
  performance of the market’s fast food sector.
• In China, consumers seeking higher eating quality items has driven more demand for ‘better burgers’ (higher-fat content burgers such
  as ‘Wagyu’ burgers). However, growth in demand for low CL content manufacturing beef is likely more driven by the growing use of
  manufactured beef products for traditional cuisine, such as thinly sliced beef used in hot pot.

                                       Manufacturing beef – exports by Chemical Lean (CL) group

         1%
       1%
      2%
                                                                         33%
        4%                                               11%                                                                                                      39%
                                                                                                                                 13%
       5%
                         90                             8%      70-89                                                      4%                 0-69
                         +CL                                     CL                                                        5%                  CL
                                                        8%
                                   87%                                                                                           9%
                                                             10%                30%
                                                                                                                                                         30%

                                  US    China   Japan    Canada     Indonesia                      Korea         Philippines            Other
 Source: DAWE, 2019–20

           MLA MARKET SNAPSHOT           BEEF AND SHEEPMEAT     AUSTRALIAN EXPORTS – KEY CUTS SUMMARY                                                        September 2020              6
Beef offal
• As the largest volume market for Australian beef offal exports, Indonesia mainly takes manufacturing (mostly tongue roots), heart,
liver and lungs for further processing.
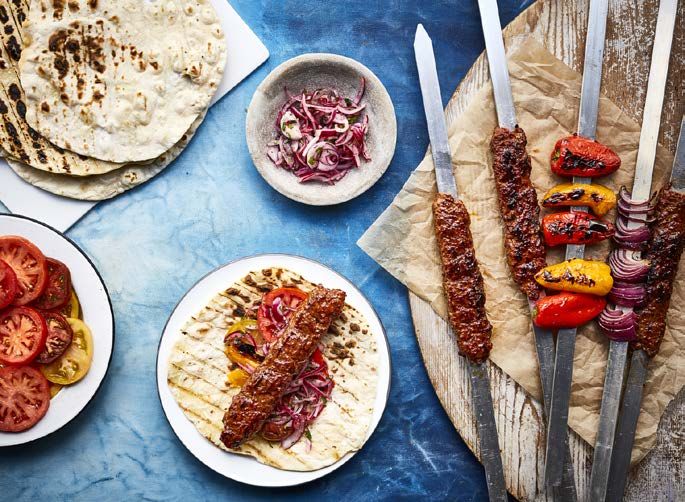
• Shipments to Japan and Korea are predominantly higher value items for yakiniku (table-top barbecue) dishes, namely tongue (mainly
for Japan), intestines and skirts. Korea is also a major buyer of cheek meat and tripe.
• Australia does not have market access to China to export tripe. However, popular offal cuts to the market include heart, tail, tendon
and kidney. Hong Kong is the largest destination for tripe, taking 52% of total exports.
Offal – exports by market Offal – exports by cut
40
35
13% Indonesia
3% 21% Korea 30
3% Japan
‘000 tonnes swt
3% Total Hong Kong
25
6% 175,712 South Africa
Egypt
20
tonnes Taiwan 15
7% swt 19%
Thailand
10
China
11% Other 5
14%
0
Tripe Liver Manufac- Skirt Heart Tongues Intestine Tail Cheek Lungs
turing meat
Source: DAWE, 2019–20 Source: DAWE 2018–19 2019–20
SHEEPMEAT
• For sheepmeat, 2019–20 production was back 6% on 2018–19, influenced by a reduced breeding flock, following high levels of ewe
turn-off through 2018. Exports mirrored this drop, easing by 7% year-on-year, accounting for 75% of total production volumes for the
2019–20 period.
Australian sheepmeat export volume by market
160
140
120
100
‘000 tonnes swt
80
60
40
20
0
Gu ua
ea
a
US
E
ia
ar
ea
n
a
re
an
da
UK
an
ait
in
bi
pa
UA
ys
w ap
at
o
in
w
rd
iw
r
na
Ch
ra
Ko
ap
Ja
Q
ala
Ku
Ne P
Jo
Ta
iA
Ca
ng
h
M
ud
ut
Si
So
Sa
Source: DAWE, major markets only 2018–19 2019–20
• Greater China was the largest destination for Australian sheepmeat exports in 2019–20, taking 35% of total shipments. North
America and the Middle East followed, taking 20% and 19% respectively.
• Shipments to the Middle East have been hampered by the decrease in air traffic during the COVID-19 pandemic, as most chilled
shipments are via air freight. Despite this challenge, the region remained as the largest destination for chilled sheepmeat exports
during 2019–20, representing 50% of all chilled shipments (mostly lamb carcases).
MLA MARKET SNAPSHOT BEEF AND SHEEPMEAT AUSTRALIAN EXPORTS – KEY CUTS SUMMARY September 2020 7
• The US remains the largest destination for leg (taking 24% of total volume), followed by China (22%) and EU (11%).
• Manufacturing is the third largest sheepmeat cut exported to China, comprising 13% of sheepmeat exports to the market in 2019. The
bulk of this product is processed in China into thin slices/rolls for use in hot pot restaurants.
Australian beef exports by cut
180
160
140
120
‘000 tonnes swt
100
80
60
40
20
0
se
g
p
er
g
k
k
in
ck
in
r
n
p
p
rte
c
an
oi
Le
fla
rin
tra
um
tlo
lo
ld
Ra
Ne
a
sl
a
rc
Sh
tu
ou
ks
in
or
&
Ch
qu
es
Ca
ac
e-
c
Sh
st
Sh
re
Ba
el
n
ea
uf
Bo
Fo
n
an
Br
Bo
M
Source: DAWE, major cut groups only 2018–19 2019–20
KEY CUTS SUMMARY
Carcase
• The fall in exports of carcase to China is relatively small and is largely a result of softer demand from foodservice during the
COVID-19 period. A drop in mutton carcase shipments was only partly offset by an increase in lamb carcase shipments.
• By contrast, the fall in carcase exports to Middle East markets is more a reflection of the sudden loss of air freight capacity as
international air travel slumped. Air freight flights were chartered to help meet demand from the Middle East region, with funding
support from governments.
• The US remains as a major destination for chilled lamb and frozen mutton carcase shipments. Reduced trade with the Middle East
markets was likely to have assisted US buyers to secure slightly more mutton carcase during 2019-20.
Carcase – exports by market Carcase – volume change by market
15
2%
3% 6% China 12
US
3% 25% Qatar 9
4%
‘000 tonnes swt
UAE
4% Total Malaysia 6
Jordan
6% 134,680 Kuwait 3
tonnes Singapore
swt Saudi Arabia
0
11% 19% Oman -3
Other
15% -6
China US Qatar UAE Malaysia Jordan Kuwait Singapore Saudi Oman
Arabia
Source: DAWE, 2019–20 Source: DAWE 2018–19 vs. 2017–18 2019–20 vs. 2018–19
MLA MARKET SNAPSHOT BEEF AND SHEEPMEAT AUSTRALIAN EXPORTS – KEY CUTS SUMMARY September 2020 8Shoulder
• Shoulder is a popular item in Asian markets due to its versatility for various cuisines, including hot pot, Genghis Khan sheepmeat
barbecue and stir fry.
• An increase in lamb shoulder exports to China more than offset a decline in mutton shoulder shipments to the market.
• While lamb shoulder shipments to Malaysia were impacted by strong demand from China, the market maintained its position as the
largest destination for mutton shoulder during 2019–20.
Shoulder – exports by market Shoulder – volume change by market 2020/19
7
1% 6
2% 11% China
2% 25% Malaysia 5
Korea 4
3%
‘000 tonnes swt
US
5% Total Japan 3
50,824 Jordan 2
tonnes 15% UAE
12% swt Canada 1
Mexico 0
Saudi Arabia
14% 15% Other -1
-2
China Malaysia Korea US Japan Jordan UAE Canada Mexico Saudi
Arabia
Source: DAWE, 2019–20 Source: DAWE 2018–19 vs. 2017–18 2019–20 vs. 2018–19
Rack
• 87% of rack exported during 2019–20 was lamb, with the US remaining as the largest customer. Mutton rack was largely distributed
to the Middle East markets, China and a small proportion to Indonesia.
• Demand for frozen rack softened across the Middle East region and China due to the impact of COVID-19 on foodservice, where the
bulk of this product is used. Demand for chilled rack in the Middle East, by contrast, has remained stable as consumers have been
eating at home more, where chilled product is preferred.
• After a slump in 2018–19, Korea re-emerged as a growing destination for lamb rack, supported by rising interest from foodservice, as
well as e-commerce platforms.
Rack – exports by market Rack – volume change by market 2020/19
1,000
2% 800
2% 11% US
2% UAE 600
China
4% Korea
Total
tonnes swt
400
4% Canada
5%
17,008 Saudi Arabia 200
tonnes Japan
swt 39% Hong Kong 0
6% Oman
8% Singapore -200
8% Other
-400
US UAE China Korea Canada Saudi Japan Hong Oman Singapore
Arabia Kong
Source: DAWE, 2019–20 Source: DAWE 2018–19 vs. 2017–18 2019–20 vs. 2018–19
MLA MARKET SNAPSHOT BEEF AND SHEEPMEAT AUSTRALIAN EXPORTS – KEY CUTS SUMMARY September 2020 9MARKET SNAPSHOT l BEEF & SHEEPMEAT
Australia
The domestic market is the largest destination for Australian red
meat. Despite a small population, Australian consumers have
comparatively high disposable incomes, allowing them to spend on
premium food items that meet their needs and lifestyles.
While the Australian red meat market is dominated by home-grown products, a changing demography and competitive pressures from
other proteins remain strong. Targeted messaging on provenance, quality, environmental credentials and animal welfare – along with food
integrity and transparency – provide opportunities to enhance consumer preferences for red meat and grow community trust.
Meat consumption
Population1 Household number by disposable income2 per capita3
1,444 US$35,000+ US$75,000+
24.4 24.2 24%
47% 105
kg
6%
16.1
5.9 23%
million
26 10.6 Australia
million
million
3.8 Grocery spend4
2.9 3.3
Australia
Australia
126
Japan
A$
51
China
Korea
Japan
Korea
5,387
Japan
China
Korea
China
26.6 million by 2024 93% of total households 52% of total households per person
(+3% from 2021) (95% by 2024) (59% by 2024)
The Australian domestic market is the largest destination for Australian beef, consistently consuming almost
30% of total beef production volume.
Australia is also the largest market for Australian sheepmeat, consuming about 35% of total production. Lamb
occupies 95% of domestic distribution, while the majority of mutton produced is exported to overseas markets.
Beef domestic utilisation5 Sheepmeat domestic utilisation6 Retail fresh meat value share7
(share of produced volume) (share of produced volume)
‘000 tonnes cwt ‘000 tonnes cwt
1,977
211
1,732
231
206
214
200
1,778
248
1,700
190
1,716
1,489
1,586
216
1,379
1,397
1,416
Beef – 35% (0.3)
1,329
139
1,329
119
Chicken – 30% (-0.6)
324
246
Lamb – 11% (-0.5)
2020
233
232
230
220
216
216
212
0.58 0.58 Pork – 11% (0.2)
177
171
750
745
705
Seafood – 10% (0.3)
725
713
675
643
705
637
617
584
638
Other – 3% (0.2)
2010-11
2011-12
2012-13
2013-14
2014-15
2015-16
2016-17
2017-18
2018-19
2019-20
2010-11
2011-12
2012-13
2013-14
2014-15
2015-16
2016-17
2017-18
2018-19
2019-20
Domestic utilisation Exports Domestic utilisation Exports
Australian retail
meat price8 (¢/kg) Single person households1 Median age in Australia1
2500
2.90 million
2000
2.73 million
2.69 million
35 38 42
1500
1000 years years years
500
0
Mar-00
Mar-02
Mar-04
Mar-06
Mar-08
Mar-10
Mar-12
Mar-14
Mar-16
Mar-18
Mar-20
2019 2020e 2024f
Beef Lamb Pork Chicken 1998 2019e 2050f
1 2 3
Data source for charts: Fitch Solutions, Fitch Solutions (Disposable income = earnings after taxes and social security charges), Fitch Solutions, GIRA (per person per year in cwt excluding fish/seafood),
4 5
IGD, 2021f, (It is defined as the total annual grocery retail market turnover in a given year, divided by the population for the same year. Grocery retail market data excludes VAT/sales tax), DAWE, ABS,
6 7 8
IHS Markit, MLA calculations, DAWE, ABS/IHS Markit, Nielsen Homescan, MAT to 14/07/2020 (year-on-year change), ABARES, calculated using ABS data
MLA MARKET SNAPSHOT BEEF AND SHEEPMEAT AUSTRALIA September 2020 10Beef
CONSUMERS
• Australian consumer demand for beef is impacted by many What things do consumers look for on pack/on shelf when buying
factors such as demographic shifts, income growth and beef?
changes in people’s attitudes and beliefs towards food from
family, friends and the media. Price per kg Price per pack
• Overall awareness of beef is high among Australians. Beef is
the largest animal protein type ranked by value and has also
All natural Quality grading or guarantee
grown on year-ago levels. (Source: MLA Global Consumer Tracker
Australia, 2018, Nielsen Homescan).
Colour of meat
Source: MLA Global Consumer Tracker Australia, 2018
Protein image profiles
Australia beef consumption per capita
35
Kg per person, p.a. in cwt
30
Beef Lamb Chicken Pork Seafood
25
Easy everyday
20
Goodness
15
10
A little bit special
5
Source: MLA Global Tracker Australia, 2018. * Tick = Area of strength vs other proteins 0
2008
2009
2010
2011
2012
2013
2014
2015
2016
2017
2018
2019
2020f
2021f
2022f
2023f
• Beef’s strengths are around its perception of being a ‘trusted
quality’ product and as ‘the greatest meat’. It is also perceived Source:ABS, DAWE, IHS Markit, MLA calculations
as ‘suitable for everyday meals’ when compared to other
proteins such as lamb, seafood and pork, but is behind chicken
on this measure (Source: MLA Global Consumer Tracker Australia, 2019).
Australia’s increasingly diverse population
• There is an opportunity to increase beef’s appeal by reinforcing
quick, easy and convenient ways that it can be prepared for High levels of immigration are driving Australia’s
everyday healthy meals, especially when it comes to boosting population growth and leading to an increasingly
consumers’ confidence in preparing beef (Source: MLA Global diverse population. The most recent Australian Bureau
Consumer Tracker Australia, 2019). of Statistics Census showed around 30% of Australia’s
residents are now born overseas. This is leading to
• When consumers are shopping for beef, the key information
foodservice and retailer operators looking at adjusting
they look for on the pack relates to freshness and then price,
in-store/menu space to better target these changing
followed by elements such as ‘naturalness’ and quality grading
demographics. The COVID-19 outbreak has seen cost,
or guarantee (Source: MLA Global Consumer Tracker Australia, 2018).
health and ‘easiness’ rise in importance when consumers
• While domestic consumption of beef has steadily declined over are selecting products (Source: Global Data).
the past two decades, Australia remains ones of the world’s
largest consumers, with per capita consumption sitting well
above the global average.
FOODSERVICE
• Beef is one of the largest fresh meat proteins consumed • The COVID-19 outbreak has had a great impact on the
through foodservice in value terms and has been growing foodservice sector and brought uncertainties in the future.
steadily year-on-year (Source: RIRDC/Fresh Agenda, Global Data). Delivery has became more important, however, it has not offset
the loss of on-premises sales. It has been estimated that it will
• The foodservice sector is a key channel for beef as
take at least a year to recover from the negative impact.
approximately 28% of domestic beef and veal supply is sold
Consumer needs for hygiene and value are out-weighing
through this channel (Source: RIRDC/Fresh Agenda).
others like connectivity and shareability. It will take some time
• The foodservice landscape is large and competitive, with to reach a new balance.
around 87,000 places to eat out. It is highly fragmented, with
many individual companies having a small market share.
• Australians spend 40% of food expenditure on ‘eating out’ and Food delivery apps having an impact
this percentage is growing. Many factors contribute to the Food delivery apps have been a contributor to the
choice to eat out or not – most are occasion-based. growth in the foodservice sector and are establishing
• The top three appealing factors for eating out are: partnerships with the major quick service restaurants.
convenience, variety and hard to recreate at home. This is driving two key trends – some restaurants are
• Beef’s share in foodservice is under threat from lower-cost changing to cater to this delivery channel (specific
proteins such as chicken and pork. menus and store format), while others are focusing
on ensuring customers continue to come in for
seated meals by offering unique dining experiences.
MLA MARKET SNAPSHOT BEEF AND SHEEPMEAT AUSTRALIA September 2020 11RETAIL
• Total fresh meat is the largest supermarket category (excluding • Woolworths (AU): Grocery sales were worth A$48 billion in
liquor and tobacco) and plays a key role in driving store traffic 2019 and are forecast to be A$53 billion in 2022 (Source: IGD).
and store loyalty (Source: Nielsen Homescan).
• Coles: Grocery sales were worth A$35 billion in 2019 and are
• Beef had the highest share of retail sales of any meat in the last forecast to be A$38 billion in 2022. (Source: IGD).
12 months, with around a 35% share of fresh meat sales (by
value) (Source: Nielsen Homesan). • IGA (Metcash): Grocery sales are steady at $12.7 billion with
an annual growth rate of 5% expected out to 2022 (Source: IGD).
• Beef is a critical product for retailers, with the average grocery
basket typically worth A$24. This jumps to around A$77 when • Aldi (AU): Grocery sales were worth A$10 billion in 2019.
the basket includes beef. Rapid expansion has continued, with the chain forecast to
operate 645 stores and be worth A$13.6 billion in 2022 (Source:
Grocery retail sales by channel IGD).
60 18 • Costco: Grocery sales were A$2.2 billion in 2019 and are
16
forecast to be A$2.8 billion in 2022, with sales expected to
50 continue to grow (Source: IGD).
14
40 12 Main supermarket of purchase – beef and lamb
US$ billions
% growth
10
30
8
Coles – 34%
20 6
Woolworths– 33%
4
10 Butcher – 19%
2 Aldi – 7%
0 0 IGA – 2%
Supermarkets Specialist stores Discount Online/ Convenience
and others Grocery retail stores Other – 4%
None of these – 1%
2020 2024 Growth % 2020–2024 (RHS)
Source: IGD, Growth % = Compound annual growth rate (CAGR) 2020–2024, IGD forecast
Source: MLA’s Global Tracker 2018
• Retailers are responding to changing consumer needs and
continue to seek category differentiation in the pursuit of • There’s a growing food box meal kit trend in Australia (such as
sustainable growth and profitability. An example of this is the Hello Fresh and Marley Spoon). These generally include
growth in premium products across the retail market. Red meat portioned ingredients and simple recipes that allow consumers
is seeing more premium cuts and healthier options to quickly create their meal. It has grown 1.5 times faster than
experiencing growth ahead of the total category. This has been total online growth and 10 times faster than total grocery
balanced with retailers introducing more affordable value growth in 2019 (Source: Nielsen).
offerings with fixed priced packaging at smaller transactional
price points (Source: Nielsen). However, as a result of the COVID-19
outbreak, it is expected that the need for value options will The changing face of retail
increase, with some consumers experiencing ongoing financial The retail sector in Australia is expected to undergo
concerns.
significant change in the near future, with the rapid
• The Australian grocery market is highly concentrated by global increase in Woolworths and Coles sales through
standards, with the two big retailers making up more than 60% their online channels, and localism trends creating an
of the market. However, during COVID-19, local channels have opportunity for smaller retailers like local butchers.
taken an increasing share from the big supermarkets as a result Emerging health trends and local sourcing are also two
of a more convenient location, better product availability and growing trends which are becoming more important to
the growing consumer trend of localism.
consumers.
• 81% of fresh meat is sold in supermarkets, predominantly
Woolworths and Coles, with butchers making up the other 19%.
Butchers have gained a 2% share since the onset of the
COVID-19 outbreak, which aligns with the localism trend.
Place of fresh meat purchase by average customer spendand
market share
Value share $ per trip
Australia 100% 20.3
Aust. supermarkets 81% 18.5
Aust. non supermarkets 19% 35.1
Source: Nielsen Homescan MAT Jun 2020
MLA MARKET SNAPSHOT BEEF AND SHEEPMEAT AUSTRALIA September 2020 12Sheepmeat
CONSUMERS
• Lamb remains one of Australia’s favourite proteins and has a • When consumers are shopping for lamb, the key information
unique role in the national diet of Australians, who are some of they look for on-pack relates to freshness (meat colour and
the largest per capita consumers of lamb in the world (Source: use-by date) and then price (Source: MLA Global Consumer Tracker
OECD). Australia, 2019).
• As awareness of lamb is high among Australians, the main
What things do consumers look for on pack/on shelf when buying
opportunity sits with increasing frequency of purchase and
sheepmeat?
demonstrating the value of lamb so people are happy to pay
more, and thus keep consuming lamb. (Source: MLA Global Consumer
Tracker Australia, 2019). All natural Colour of meat
• Consumers perceive lamb as ‘special’ relative to other proteins
and are often choosing lamb as it ‘tastes delicious’. However, Price per kg Quality grading or guarantee
there is an opportunity to focus on lamb’s versatility and recipes
that are easy to prepare (Source: MLA Global Consumer Tracker Australia, Price per pack
2019). Source: MLA Global Consumer Tracker Australia, 2018
FOODSERVICE
• Within foodservice, lamb is strong in the dining-out segment, Top 10 most popular ethnic cuisines in Australia
which currently accounts for 60% of the foodservice lamb
volume, with an opportunity to expand in the takeaway Thai
channel (Source: RIRDC/Fresh Agenda). Chinese
• A key trend for lamb has been the emergence of fast casual Italian
outlets that have forced up the expectations of consumers. Japanese
This trend has created a race among traditional quick service Indian
restaurant operators to ‘premiumise’ their brands and offering Mexican
– including the removal of additives and introduction of natural Korean
ingredients (Source: GlobalData).
Greek
• Cuisines and food concepts are very diverse in Australia and Lebanese
lamb is regarded as a good protein source to fit most cuisines.
Turkish
• There are also opportunities in new concepts for example,
presenting lamb in non-traditional ways beyond roasts and Source: “The Drop” – An analysis of Google Trends data by Chef’s pencil Oct 2019 –
premium grilling cuts, such as protein bowls, burritos and the-drop.com.au/most-popular-ethnic-cuisine-in-australia
salads.
RETAIL
• In retail, lamb has a similar market share to pork, with around 11% Main supermarket of purchase – beef and lamb
share of fresh meat sales (by value) in the last 12 months, behind
beef and chicken (Source: Nielsen Homescan).
Coles – 34%
• Lamb buyers are premium buyers for retailers, with the average
Woolworths – 33%
grocery basket value typically worth A$24. This jumps to around
Butcher – 19%
A$84 when the basket includes lamb (Source: Nielsen Homescan 12
Aldi – 7%
months to to June 2020).
IGA – 2%
• More than 80% of lamb is purchased at supermarkets, mainly Other – 4%
from Woolworths and Coles. None of these – 1%
• However, other supermarkets (e.g. Costco) and butchers are
growing in both share and absolute sales (source: Nielsen Homescan
Source: MLA’s Global Tracker 2018
12 months to June 2020).
• Australia’s consumption of lamb has come under pressure in the
last year, as volatile supply and strong international demand
combined to drive domestic prices into record territory.
© Meat & Livestock Australia, 2020. ABN 39 081 678 364. MLA makes no representations as to the accuracy of any information or advice contained in MLA’s Market snapshot and excludes all liability,
whether in contract, tort (including negligence or breach of statutory duty) or otherwise as a result of reliance by any person on such information or advice. All use of MLA publications, reports and
information is subject to MLA’s Market Report and Information Terms of Use. Please read our terms of use carefully and ensure you are familiar with its content.
FOR FURTHER INFORMATION VISIT US ONLINE AT:
www.mla.com.au or email us at: globalindustryinsights@mla.com.au
MLA MARKET SNAPSHOT BEEF AND SHEEPMEAT AUSTRALIA September 2020 13MARKET SNAPSHOT l BEEF & SHEEPMEAT
North America
Globally, the United States (US) has the highest number of
households earning disposable incomes over US$35,000 and
US$75,000 per year. This affluent consumer base, combined with
large and increasing meat consumption, means the country remains
(United States, Canada and Mexico) highly attractive and influential in the global protein trade landscape.
While the COVID-19 pandemic continues to cast a shadow on the US economic recovery and its foodservice sector, fundamental
consumer needs for quality and healthy lifestyles remain strong. Opportunities exist for Australian red meat to enhance its profile in the
US, on the back of growing demand from consumers for natural, healthy and environmentally sustainable products.
Meat consumption
Population1 Household number by disposable income2 per capita3
US$35,000+ US$75,000+
1,444
94.3 31%
million
43% 120
kg
0.5%
25%
44.8
million
333 10.6
5.9
Grocery spend4
million 126 26 24.2 24.4
Australia
3.3 3.8
A$
Australia
Japan
Australia
7,139
Japan
China
China
Japan
China
US
US
US
338.5 million by 2024 72% of total households 34% of total households
per person/year
(+2% from 2021) (76% by 2024) (39% by 2024)
The US is Australia’s third largest export market for beef in both volume and value. Traditionally a
manufacturing beef market, the country is also the largest export destination for chilled grassfed beef.
Australian beef Australian beef Australia’s share of
exports – volume5 exports – value6 beef imports7 Country of origin8
1% 26% 1%
Chilled grass
53% of US consumers
know the country of
origin of the beef they purchase
38%
Chilled Australia
Chilled grain
Frozen grass 62% Frozen 23% Other
countries
Frozen grain
72%
Total 243,459 tonnes swt Total A$2.3 billion
The US is the second largest export customer for Australian lamb, growing almost 70% in volume during the last
decade. It is also the second highest value destination for Australian sheepmeat, superseded by China.
Australian sheepmeat Australian sheepmeat Australia’s share of Americans enjoy eating
exports – volume5 exports – value6 sheepmeat imports7 lamb at foodservice 8
26%
Chilled lamb
17%
Chilled lamb Australia
64% have eaten lamb
at a restaurant
81%
40%
Frozen lamb 55%
Frozen lamb Other
Frozen mutton 28% Frozen mutton countries
34%
Total 76,020 tonnes swt Total A$888 million
1 2 3
Data source for charts: Fitch Solutions, Fitch Solutions (Disposable income = earnings after taxes and social security charges), Fitch Solutions, GIRA (US data only, per person per year in
4
cwt excluding fish/seafood), IGD, 2021f, (US data only. It is defined as the total annual grocery retail market turnover in a given year, divided by the population for the same year. Grocery
5 6 7 8
retail market data excludes VAT/sales tax), DAWE (2019–20), ABS/IHS Markit (FY 2019–20), IHS Markit, (FY 2019–20), Global Tracker 2019, note there is no country-of-origin labelling
requirements in the US for beef
MLA MARKET SNAPSHOT BEEF AND SHEEPMEAT NORTH AMERICA September 2020 14United States – Beef
CONSUMERS
• The US is one of the largest global consumers of animal protein, • Two-thirds of US shoppers are looking for ‘better for me’
with the level of meat consumption near maturity. Going forward, options at the meat case and tie production claims to both
within the beef category, the growth opportunity will be to grow their own health and animal welfare. During the COVID-19
value, through premium products like chilled grassfed beef, pandemic this trend has also been evident, with grassfed beef
rather than grow volume of more conventional beef. growing much faster than conventional beef, with sales up by
• Beef consumption has increased since 2015, in line with higher 60–70%, while conventional beef has increased by around
US beef production and a return to a more favourable price point 40% (from March to August 2020) (Source: IRI).
for US consumers, especially in the ‘better for me’ category, • Purchasers of grassfed beef are more interested in quality and
which includes grassfed beef, organic beef and beef with no ‘naturally raised’, with concerns for animal welfare and
added hormones or antibiotics. environmental sustainability also being major factors
• However, due to the impact of COVID-19 on many consumers’ considered when purchasing grassfed beef.
financial situations, some shoppers will return to more cost- • Australia is well positioned to meet the demands for quality and
effective options for a while. animal welfare with superior food safety, traceability protocols
• The majority of US consumers would consider buying imported and a unique quality grading system (Source: MLA Global Tracker
beef and are aware of grassfed beef. 2018, Voice of Consumers 2018, Menu Matters 2018, USDA).
Awareness of different types of beef – top four in US
Top three reasons to buy Top three perceptions of
grassfed beef Australian grassfed beef
Grassfed beef 78
Better quality beef Consistent quality
Organic beef 65
Regular or Higher quality than beef from other
conventional beef 62 Natural
countries
Grainfed beef 51 Better taste than beef from other
Better for my health
countries
HGP-free beef 50
Source: Voice of consumer 2018
Source: MLA Global Consumer Tracker US, 2019
FOODSERVICE
• Pre-COVID saw stable foodservice growth, especially for • Grassfed beef is most common in fast-casual and fine dining
full-service restaurants. Retail foodservice has seen strong restaurants, however, growth is solid across all segments,
expansion. However, the COVID-19 outbreak has had an tripling within the last 10 years. In fact prior to COVID-19, US
impact, especially for high-end restaurants. industry researcher, Datassential predicted grassfed beef will
• The COVID-19 outbreak has impacted foodservice, with grow by 27.9% over the next four years to achieve 4.9%
restrictive dine-in regulations and consumers’ rising health penetration across foodservice operations overall. Post
concerns becoming a challenge for the sector. Foodservice COVID-19, it is predicted that some high-income consumers
has seen a significant decline, which has not been offset by will look for healthy comfort foods, like grassfed beef.
the increase in delivery. Dining-in will remain a concern in the
near future. Penetration by restaurant segment – Grassfed beef
• Manufacturing beef for burgers and other processed beef
All 3.8% (+95%)
products make up a large proportion of Australian beef sold
into the foodservice sector in the US, while chilled grassfed Fine dining 9.3% (+120%)
beef is largely destined for full-service restaurants and retail. Fast casual 5.1% (+79%)
Casual 4.5% (+64 %)
Midscale 2.4% (+78%)
Quick service 2.1% (+++%)
restaurant
(Bracket percentage) = 4 year % change 2018 vs. 2014, +++% indicates growth over 200%
Source: Dataessential, beef and lamb menu analysis, 2018
• Wagyu is another fast growing product in foodservice, with a
high conversion rate from ‘tried’ to ‘liked’, especially in fine
dining (Source: Datassential, beef and lamb menu analysis 2019).
MLA MARKET SNAPSHOT BEEF AND SHEEPMEAT NORTH AMERICA September 2020 15RETAIL
• Although grassfed beef in US retail is a relatively small offering, • Grassfed beef is perceived as healthy and natural which
it has seen some of the strongest growth in the meat case, with matches rising consumer needs. However, the trend of localism
predictions indicating no slow down in demand for the coming may continue to grow in the advent of COVID-19, which could
year. While ground grassfed beef is now quite common, act as a barrier to Australian beef.
demand for higher value chilled grassfed beef is increasing.
Some of the most popular cuts include tenderloin, striploin and Motivation to choose and eat beef – top five
ribeye. Important themes ranked by relative importance
• Limited ‘country of origin’ labelling at point of purchase is a
challenge for Australian product to be differentiated in the Freshness
sector, with retailers preferring ‘local’ callouts in their meat case.
Natural
On the contrary, research indicates US consumers consider
Australia as aspirational and able to deliver ethical production Value
claims on their grassfed beef purchases. Quality/safety
North American beef consumption Environmental
50
Source: MLA Global Consumer Tracker US, 2019
Kg per person, p.a. in cwt
40
Grocery retail sales by channel
30 20
500
18
20
400 16
10 14
US$ billions
300 12
% growth
0 10
2004
2005
2006
2007
2008
2009
2010
2011
2012
2013
2014
2015
2016
2017
2018
2019
2020f
2021f
2022f
2023f
2024f
200 8
6
US Canada Mexico 100 4
Source: Fitch Solutions 2
0 0
• Reflecting the retail environment in the US, supermarkets are the Supermarkets Hypermarkets Convenience Discount Online/
stores Grocery retail
main purchase channel for Australian grassfed beef, followed by
independent and regional butchers, online retailers and 2020 2024 Growth % 2020–2024 (RHS)
warehouse club stores. Source: IGD, Growth % = Compound annual growth rate (CAGR) 2020–2024, IGD forecast
• Australian grassfed beef is perceived to provide higher quality
steak than other imported products (Source: MLA Global Tracker, 2019,
Voice of consumers 2018, Grassfed Shop-a-long research, 2018).
COMPETITIVE LANDSCAPE
• The main competitors in the US market are US domestic beef • Australia is one of the largest importers of grassfed beef, and is
and imported beef from Canada and Mexico. growing faster than its largest competitor, New Zealand. In
addition, 99% of New Zealand imports are manufacturing beef,
US beef imports by market share – 2019–20
whereas 26% of Australian exports are chilled cuts.
• In recent years imports from South American countries have
Canada – 28% seen continued growth in volume, although they are still coming
Mexico – 24% from a smaller base.
Australia – 23% US beef imports by major supplier
NZ – 13%
Nicaragua – 7% 1,200
Uruguay – 3%
Other – 2% 1,000
‘000 tonnes swt
800
Source: IHS Markit
• As most of the Australian beef into the market is grassfed beef, 600
the key competitors are New Zealand, and increasingly the
400
growing mobilisation of local US grassfed beef production.
Other smaller suppliers include Uruguay and Nicaragua, which 200
have access to smaller quotas.
• Australia maintains its preferred access status to the US, only 0
2010 2011 2012 2013 2014 2015 2016 2017 2018 2019
behind United States-Mexico-Canada Agreement (USMCA)
partners (Canada and Mexico – with no quota restrictions). New Canada Australia Mexico NZ Nicaragua Uruguay
Zealand has an annual quota of 213,402 tonnes tonnes shipped Other
weight (swt), with an out-of-quota tariff of 26.4% (within quota Source: IHS Markit
4.4¢/kg).
MLA MARKET SNAPSHOT BEEF AND SHEEPMEAT NORTH AMERICA September 2020 16US – Market access overview
Trade agreements Import tariffs Competitors Volume restrictions Technical access
Australia-United States Zero within quota Canada and Mexico: USMCA, no quota; Australian beef quota: E. coli and Salmonella
Free Trade Agreement (7.04% above quota) New Zealand: 213,402 tonnes quota, with an 43,214 tonnes swt sampling programs, label
(AUSFTA) in-quota tariff of US4.4¢/kg approvals and port mark
compliance
Nicaragua and Costa Rica: CAFTA-DR with
US, shares the same 65,000 tonnes with other
countries, in quota 4–4.4¢/kg, 26.4% out of
quota tariff
Uruguay and Argentina: no FTA, quota of
20,000 tonnes each, tariff 4–4.4¢/kg in quota
and 26.4% out of quota
Best access Major challenges
Source: Trade agreements DFAT, MLA
Australian beef exports to North America – summary table
Volume – in tonnes swt 2019–20 % of 2018–19 % of five-year average % of change 2019–20
total total (2014–15 to total vs five-year average
2018–19)
% in tonnes swt
Total 259,092 259,904 324,323 -20 -65,231
Chilled 69,919 27 66,916 26 72,087 22 -3 -2,169
Storage
Frozen 189,173 73 192,988 74 252,236 78 -25 -63,063
Grassfed 253,285 98 253,479 98 313,495 97 -19 -60,209
Meat type
Grainfed 5,807 2 6,425 2 10,829 3 -46 -5,022
Chilled grassfed 65,657 25 62,463 24 64,027 20 3 1,630
Chilled grainfed 4,262 2 4,453 2 8,061 2 -47 -3,799
Storage/meat type
Frozen grassfed 187,628 72 191,016 73 249,468 77 -25 -61,839
Frozen grainfed 1,545 1 1,972 1 2,768 1 -44 -1,223
Source: DAWE
Value – in A$ 000 % in A$ 000
Total 2,452,653 2,060,544 2,327,541 5 125,112
Chilled 927,968 38 765,328 37 727,568 31 28 200,400
Storage
Frozen 1,524,685 62 1,295,216 63 1,599,973 69 -5 -75,288
Source: ABS/IHS Markit
Australian beef exports to US – by major cut
Volume – in tonnes swt % in tonnes swt
Manufacturing 143,496 59 146,981 61 191,855 64 -25 -48,359
Fullset 39,606 16 27,349 11 16,683 6 137 22,923
Thin flank 16,854 7 16,727 7 19,229 6 -12 -2,375
Topside/inside 10,953 4 15,750 7 21,063 7 -48 -10,110
Striploin 5,809 2 5,275 2 4,772 2 22 1,037
Other 26,741 11 28,287 12 44,458 15 -40 -17,716
Total 243,459 240,368 298,060 -18 -54,600
Source: DAWE
Australian beef exports to Canada – by major cut
Volume – in tonnes swt % in tonnes swt
Manufacturing 10,820 72 12,306 66 18,305 71 -41 -7,484
Cube roll/ribeye roll 1,377 9 1,531 8 1,131 4 22 245
Striploin 1,101 7 1,471 8 928 1 19 172
Other 1,826 12 3,239 17 5,377 21 -66 -3,551
Total 15,124 18,547 25,741 -41 -10,617
Source: DAWE Note: Import tariff on Australian beef is 0% within quota (35,000 tonnes swt) and 17.6% for over quota. Canada is a member of the Comprehensive and Progressive Agreement for Trans Pacific
Partnership (CPTPP).
Australian beef exports to Mexico – by major cut
Volume – in tonnes swt % in tonnes swt
Thin flank 424 83 955 97 508 97 -17 84
Other 84 17 33 3 14 3 501 70
Total 508 988 522 -3 -14
Source: DAWE Note: Australia shares 200,000 tonnes swt quota with other non-NAFTA countries. Import tariff within quota is 0% (over quota is 16% for chilled and 20% for frozen beef). Mexico is a member of the
Comprehensive and Progressive Agreement for Trans Pacific Partnership (CPTPP).
MLA MARKET SNAPSHOT BEEF AND SHEEPMEAT NORTH AMERICA September 2020 17Canada – Beef
CONSUMERS
• Most Canadian consumers already buy imported beef. The • When purchasing beef, ‘naturalness’ is something buyers look
gowing majority of grassfed beef buyers are aware of the for, and grassfed is seen as an authentic differentiator. However,
‘country of origin’ (68%), and most would consider buying the appeal of grassfed beef has plateaued. At the same time,
imported beef (82%) (Source: MLA Global Tracker). newer descriptors have become more prevalent like organic,
hormone-free, non-GMO and antibiotic-free. It appears
• Compared to global consumers, Canadian beef buyers are
consumers are not fully aware of the differences between these
more concerned about ‘naturalness’, price and no added
types of beef.
hormones.
FOODSERVICE & RETAIL
• Full-service and quick service restaurant channels continue to
lead the Canadian foodservice sector, generating more than
Main supermarkets for purchasing beef
60% of total revenue.
• Beef is the most valuable meat category for commercial TORONTO VANCOUVER
foodservice operators (such as restaurants, cafés, hotels and
leisure venues etc.), and is forecast to represent a 37% value
share of total animal protein in this channel in 2021 (Source:
GlobalData – Canada, The future of foodservice to 2021).
• The majority of imported Australian grassfed beef is
‘manufacturing’ grade and is used in quick service restaurants.
• At the retail level, Australian beef is mainly purchased from
supermarkets, and as the retail sector is quite fragmented in Loblaws – 23% Safeway Canada – 33%
Canada, each city has a different leader in claimed total beef Metro – 17% Fairway – 2%
WholeFoods – 1% Buy Low – 2%
sales (Source: MLA Global Tracker Canada).
Longos – 6% IGA – 6%
• The COVID-19 outbreak will likely have a lasting effect on Sobeys – 6% Urban Fair – 1%
foodservice, with consumers focusing more on healthy and Other – 47% Other – 52%
cost-effective products. Source: MLA Global Tracker Canada
COMPETITIVE LANDSCAPE
• The Comprehensive and Progressive Agreement for Trans-
Pacific Partnership (CPTPP) is a free trade agreement (FTA)
between Australia and another 11 countries, including Canada
and Mexico, signed in 2018.
• Under the trade agreement, Australia has favourable market
access into Canada and a good trading environment, with no
tariff in 2023. The majority of Australian beef exports to Canada
are grassfed and follow a similar trend to the US.
• The main competitors are US beef and product from New
Zealand. Australia is a modest supplier of beef to Canada.
Canada – Market access overview
Trade agreements Import tariffs Competitors Volume restrictions Technical access
Comprehensive and Current tariff at 13.2%, US and Mexico: 35,000 tonnes out of E. coli and Salmonella
Progressive Agreement for 0% in 2022 USMCA, no quota; quota pays tariff sampling programs, label
Trans-Pacific Partnership New Zealand: approvals and port mark
(CPTPP) 29,600 tonnes quota, in compliance
quota 0% tariff, out 13.2%
Best access Major challenges
Source: Trade agreements DFAT, MLA
MLA MARKET SNAPSHOT BEEF AND SHEEPMEAT NORTH AMERICA September 2020 18You can also read