BENCHMARKING AFRICA'S MINIGRIDS - Shell Foundation
←
→
Page content transcription
If your browser does not render page correctly, please read the page content below
BENCHMARKING
AFRICA’S MINIGRIDS

             Authored By

                           1
Benchmarking
Africa’s Minigrids

                     2
Forward

Forward
With this report, the Africa Minigrid Developers Association (AMDA) is opening the door to a new era in the
minigrid sector. One of continental transparency in performance, cost, and scale information that will allow
decision-makers in national governments, donor institutions, and investors to make more informed choices
than ever before. And it will help minigrid companies understand how they are performing vis-à-vis their peers
for the first time as well.

AMDA’s mandate from day one has been to improve policy and financing environments for private sector
minigrids by expanding the evidence base of sector performance and also by providing expert guidance and
advocacy around best practices and sector needs. We are therefore extremely proud to release our first major
publication, “Benchmarking Africa’s Minigrids,” to deliver on this mandate. With less than ten years left until
the globally agreed 2030 deadline to deliver universal energy access for all, this publication and all our work
at AMDA is focused on offering insight into what the sector needs to radically scale up progress towards this
objective.

This report makes a great leap forward in this regard, showing how minigrid companies are rapidly reducing
costs and are already significantly cheaper on a per connection basis in rural areas than their state utility
counterparts. We also show the immense need to support regulatory streamlining across Africa, without
which, achieving universal access in a timely manner will not be possible.

We invite you to read and absorb the insights found in this report and to reach out to the AMDA team to
collaborate both on overcoming the barriers keeping minigrids from scaling as quickly as needed, and more
broadly on our work to ramp up the progress of this essential sector.

Aaron Leopold
Chief Executive Officer
Africa Minigrid Developers Association (AMDA)

                                                                                                            3
Acknowledgements

Acknowledgements
“We are exceedingly grateful to the over two dozen industry experts who lent AMDA their time and expertise
again and again over the past two years to ensure the methodology used to create this report was not only
academically rigorous, but also safe in terms of intellectual property and do-able for the minigrid companies
providing the data. Above all we thank you for helping us make this report valuable for decision-makers and
broader sector stakeholders who can help us deliver on our mission to scale-up the minigrid sector
across Africa.”

Andrew Allee (Rocky Mountain Institute), Svet Bajlekov (AMMP), Ian Baring-Gould (National Renewable
Energy Laboratory [NREL]), Kieran Campbell (PowerGen), Robert Cunningham (RVE.Sol / Kudura Power
East Africa), Gabriel Davies (CrossBoundary Energy), Sam Duby (TFE Consulting), Hunter Dudley (Odyssey
Energy Solutions), Caroline Eboumbou (Rockefeller Foundation), Kendall Ernst (Rocky Mountain Institute),
Olumide Fatoki (Deutsche Gesellschaft für Internationale Zusammenarbeit [GIZ] Nigeria), Arthur Jacquiau-
Chamski (SparkMeter), John Kidenda (PowerGen), Maria Knodt (Energy4Impact), Franz Kottulinsky (Rift
Valley Energy), Michael Goldbach (New Sun Road), Ray Gorman (Power Africa Off-grid Project [PAOP]),
Osahon Iyalekhue (Community Research and Development Centre [CREDC]), Erika Lovin (CrossBoundary
Energy), Gerald Massawe (PowerCorner), Emily McAteer (Odyssey Energy Solutions), Emma Miller (Shell
Foundation), Emily Moder (SteamaCo), Jonathan Shaw (Nuru Energy), James Sherwood (Rocky Mountain
Institute), Brian Somers (Standard Microgrid), Oluwatobi Soyombo (Havenhill Synergy), Jay Taneja (University
of Massachusetts at Amherst), Robert Wang’oe (Jumeme), Humphrey Wireko (CrossBoundary Energy), and
Nathan Williams (Rochester Institute of Technology).

We are furthermore extraordinarily grateful to the following peer reviewers whose insight, expertise and
attention to detail significantly improved this report from previous draft versions. Thank you.

Andrew Allee (Rocky Mountain Institute), Kelly Carlin (Rocky Mountain Institute), Sam Duby (TFE Consulting),
Hunter Dudley (Odyssey Energy Solutions), Steven Hunt (UK Department for International Development
[DfID]), Jaryeong Kim (SEforAll), Daniel Kitwa (AMDA), James Knuckles (World Bank ESMAP), Frédéric
Madry (Engie PowerCorner), Eva Lee (Power for All), Emily McAteer (Odyssey Energy Solutions), Emma Miller
(Shell Foundation), Emily Moder (SteamaCo), James Sherwood (Rocky Mountain Institute), Sam Slaughter
(PowerGen), Ruchi Soni (SEforAll), Jay Taneja (University of Massachusetts at Amherst), Naomi Wagura
(SEforAll), and Nathan Williams (Rochester Institute of Technology).

The lead analysts and authors of this report from Economic Consulting Associates are Almar Barja and Ester
Vespasiani. Lead authors from AMDA are Jessica Stephens and Aaron Leopold.

Funding support for AMDA and this work was provided by Omidyar Foundation, DOEN Foundation, and
Shell Foundation.

Front cover photo credit: Standard Microgrid

                                                                                                          4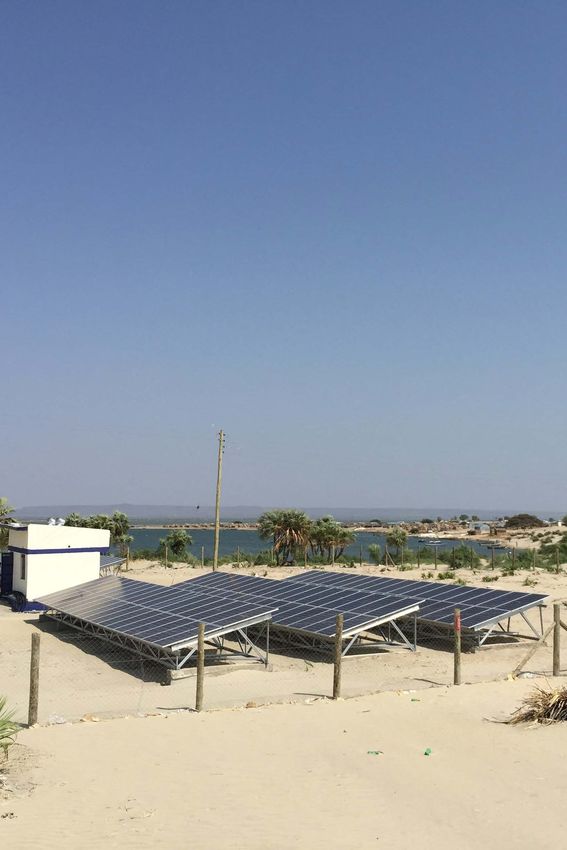
Contents

Contents
Benchmarking                                                                 2
Africa’s Minigrids                                                           2
Forward                                                                      3
Acknowledgements                                                             4
Contents                                                                     5
1. Executive summary                                                         7
Key Findings                                                                 8
Recommendations for decision-makers:                                         9
2. Introduction                                                             11
2.1 Who We Are                                                              12
3. Methodology                                                              15
4. Sector Growth                                                            19
4.1 Electricity Access and Growth of Energy Services                        20
4.2 Total connections                                                       20
4.3 Total installed kW and number of sites                                  21
4.4 Concessional Funding: True Scale Requires Systemic Support              21
4.5 National Government subsidies in the electricity sector                 25
4.6 Key insights                                                            25
5. Costs                                                                    27
5.1 CAPEX trends                                                            28
5.2 Explaining 2019 Costs through Economies of Scale and Market Expansion   31
5.2 Operational Expenses                                                    33
5.2.1 Overview of operating expenses                                        34
5.3 Key insights                                                            35
6. Consumption and Growing the Load                                         36
6.1 Average revenues                                                        39
6.2 Increasing Consumption by Increasing Incomes: Productive Energy         40
6.3 Sector job creation                                                     41
6.4 Key insights                                                            43
7. Service Quality                                                          45
7.1 Service uptime                                                          46
 7.2 Performance & Service Quality                                          47
7.3 Percentage of customers within communities served                       48
7.4 Key insights                                                            49
8. Policy and Regulation will Make or                                       50
Break Chances of Achieving SDG 7                                            50
Policy and Regulation will Make or Break Chances of Achieving SDG 7         51
8.1: Licensing and regulatory frameworks                                    51
8.2 Key insights                                                            54
9. Conclusion and Next Steps                                                55
Conclusion and Next Steps                                                   56
9.1 Next steps                                                              56
10. References                                                              58

                                                                                 5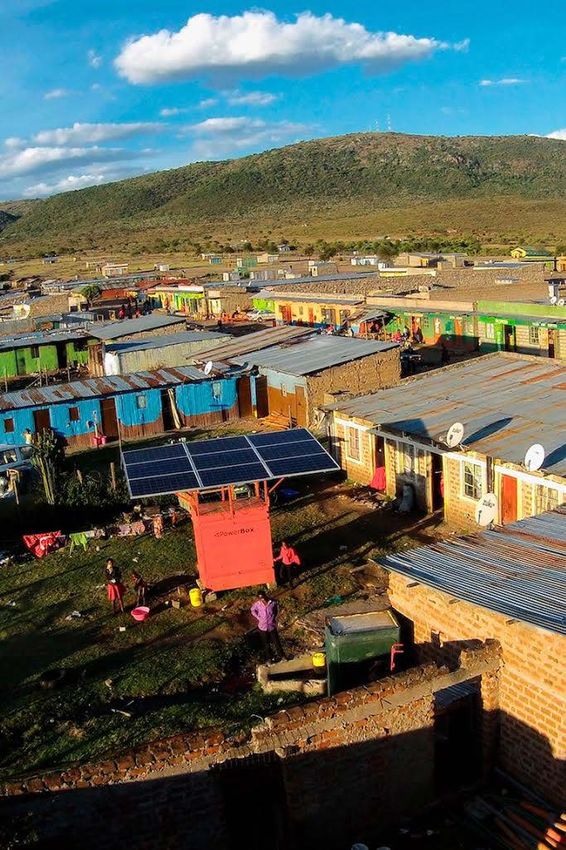
Contents

Contents
Table 3.1: Overview of developers and reported sites                               18
Table 3.2: Overview of quality of data received                                    18
Figure 4.1: Overview of total number of connections                                20
Figure 4.2: Installed capacity and commissioning of new sites   4                  21

Figure 4.3: Funding Received by Region                                             22
Table 4.2: Funding received                                                        23
Figure 4.4: Comparison of funding by type                                          23
Figure 4.5: Lead time of funding on new connections                                24
Figure 4.6: Growth rates for minigrid deployment                                   24
Figure 5.1: Comparison of relative installed costs                                 29
Figure 5.2: CAPEX costs                                                            30
Figure 5.3: Average and median total installed costs with one standard deviation   30
Figure 5.4: CAPEX per connection trends by experience                              31
Figure 5.5: CAPEX per connection trends by experience                              32
Figure 5.6: Comparison of costs for established and new developers                 33
Figure 5.7: Number of sites per developer                                          33
Figure 5.8: Breakdown of OPEX                                                      34
Figure 6.1: Comparison of average monthly consumption per user       15            37

Figure 6.2: Difference in average consumption per user within a single developer   38
Figure 6.3: Comparison of average reported performance against ARPU                39
Table 6.1 Power requirements, costs and indicative payback periods of
selected income-generating appliances                                              40
Figure 6.4: Minigrids local value chain                                            42
Figure 6.5: Village jobs and local employees                                       42
Figure 7.1: Percent uptimes of sites with generation capacity                      46
Figure 7.2: Project sites with diesel generators by year installed                 47
Figure 7.3: Electrification rate and connections within minigrid communities       48
Figure 8.1: Evolution of average licensing time                                    52
Figure 8.2: Average time to obtain licences in countries that require licenses26   52

Figure 8.3: Licencing Timeline in months                                           53
Source: Nigerian Electricity Regulatory Commission                                 53
Box 8.1: Nigeria’s regulatory framework                                            53

                                                                                        6
Executive Summary

         1. Executive summary

                                Photo Credit: EngiePowerCorner

                                                                 7
Executive Summary
Executive summary
Over the last decade, leading authorities have repeatedly heralded minigrids as
essential to providing electricity to approximately half of all unelectrified communities
in Africa. Despite this, investment, political buy-in, and scale have remained elusive.
One of the key reasons this has been the case is that to date, national-level decision-
makers, investors and donors have had to rely on data and evidence from individuals
or small groups of companies. This being because there has been a general lack of
reliable, neutral information available on the sector as a whole.
With this report, the African Minigrid Developers Association’s (AMDA) and Economic
Consulting Associates (ECA) present analysis of a one of a kind dataset collected from
nearly all established market leaders across Africa as well as a significant sample of
smaller, newer companies that together represent the vast majority of private sector
minigrid companies on the continent. This report provides the most comprehensive
analysis on minigrid financing, economics, regulation, service quality, & impact
available to date, and also offers key insights into the barriers facing the sector and
what can be done to overcome them.
Key Findings
Overall, the African minigrid market is behaving predictably both as a nascent
industry, with significant price reductions emerging as investments increase, and
also as a rural electrification sector, in that public funding has proven an essential
catalyst to bring in private investors and kickstart cost reductions through the scale-up
process. Logic holds that continued public support will see continued scale-up and
price reductions.
The data demonstrates a fundamental interconnection between concessional
funding, private investment, political environments and deployment of con-
nections. AMDA’s data illustrates how these different pieces of the enabling environ-
ment feed off one another to build the trust, confidence, and experience necessary to see
increased delivery of energy access. These elements are so fundamentally intertwined
that disruptions within the cycle can derail growth or even devolve into negative feedback
loops.
AMDA’s data shows the sector is beginning an impressive scale-up phase. As
donor funding steadily increased over the reporting period, connection numbers did
In well established
markets, as well; going from under 2,000 connections in 2016 to over 41,000 in 2019. These
experienced connections have provided over 250,000 people, businesses and community facilities
firms were on with high quality, productive energy. To date, this growth has largely taken place in
average 41% less East African markets, where the sector got an earlier start.
expensive than
new developers The sector’s growth over 2014-2018 also coincided with a tremendous drop in
in those same costs, with the average price per connection falling from US$ 1,555 at the beginning
markets, again of our reporting period to US$ 733 in 2018. Established developers have been able
illustrating the to reduce CAPEX pricing by 57% over the reporting period. Cost for new companies
logical evolution entering a market has reduced by 33% in the same period. Another interesting
of sector as
contrast between new and experienced developers is that in well-established markets,
companies gain
experienced firms were on average 41% less expensive than new developers in those
experience and
same markets, again illustrating the logical evolution of sector as companies gain
scale.
experience and scale.
8Executive Summary
Taken together, our data show that rural minigrid connections are often
thousands of dollars cheaper than those of state-run utilities. With the
primary concern of governments today being the higher kilowatt costs of minigrids,
these enormous cost savings could easily be transferred into end-user subsidies
or other cost reductions tools, and still save governments and donors billions vis-
à-vis traditional grid expansion across the continent.
Our most alarming finding is that across the continent, regulatory
compliance processes on average take more than one year per site. With
the World Bank estimating that Africa requires 140,000 minigrids, regulation
represents an enormous barrier to sector growth and to SDG 7. Neither will be
achievable without the urgent development and adoption of more automated and
bundled approval processes that allow for higher volumes of approvals at greatly
increased speeds.
An unsurprising but confirmatory key finding is the challenge of low consumption.
The average consumption per customer is only 6.1 kWh per month across the
continent. Low consumption makes it difficult to ensure operational costs can be
covered for residential consumers, let alone that a return on investment might
be possible. Interestingly, the data does not show a correlation between higher
average revenue per user and a higher level of consumption, utilisation rates or
installed generation capacity. This is likely due to tariff pricing effects, as well
as difficult operating environments where external factors and the demographic
make-up of customers create large variabilities in revenue generation.
Recommendations for decision-makers:
Support is urgently In summary, concessional funding is working to unlock private capital and
needed however catalyse investment that is allowing the sector to grow and reduce costs as it
to address the gains experience and scale. Support is urgently needed however to address the
dual issues of dual issues of low demand and complex regulatory environments. Only once
low demand and these issues are mitigated will the sector be able to grow quickly enough to play
complex regulatory
the role it is being called on to play in ending energy poverty for good.
environments.
With this in mind, AMDA has identified three key areas for decision-maker action
based on the evidence presented in this report:
1. Public funding has been very successful at crowding-in other investors
and more is needed. While these investments have already begun a scaling
effect that is significantly lowering prices, because the sector is still in its early
stages, broad, systemic public funding is still is needed to bring in private
investment continentally and realize true economies of scale. Therefore
large-scale, multi-country funding programs would be the most ideal tools
to give investors and minigrid companies predictable, easy to understand
pathways to invest and build across multiple geographies.
92. Low consumption is a systemic problem that requires coordination and
collaboration among all stakeholders. Because of this systemic challenge,
bankability will remain elusive until a systemic, long-term collaborative
response from minigrid companies, the donor community and national
governments is deployed at scale. While not based on the evidence presented
in this report, experience shows that ideally, a broad-scale demand-growth
program would likely need be a combination of micro-finance (for appliance
purchases), micro-entrepreneurship training (ensuring appliances and small
businesses are increasing incomes) and agricultural extension work (minigrid
sites and customers will remain largely agrarian for some time). Right now,
systemic efforts to address this core sectoral issue do not exist, and helping
fill this gap will be a key area of AMDA’s work moving forward.
3. Minigrid regulations must be made more appropriate to the projects
they are regulating. Current regulations are largely based on regulator
experiences approving and monitoring small numbers of large energy
projects, and must urgently be re-designed to do the inverse - approve
hundreds or thousands of small projects over a short period of time. Digitizing
processes as much as possible, while making use of smart- and remote-
monitoring technologies will go a long way in allowing regulators to reduce
up-front application burdens, as well as allow approvals to move in batches
rather than one-by-one.
10Introduction
2. Introduction
Photo Credit: REDAVIA
11Introduction
Introduction
Minigrids are standalone energy systems that offer grid-quality electricity for an entire community, its businesses
and even small-scale industry. Since the prices of components and technological advancements in renewable
energy systems have dramatically improved over recent years, minigrids are more and more being seen as a
core solution to the energy needs of rural and remote communities around the world.
With over 600 million Africans still living without access to electricity, minigrids are particularly recognized as
the most appropriate technology for around half of this energy-poor population. Indeed, the World Bank has
estimated that over 140,000 minigrids are needed in Africa alone to solve this problem1. However, because the
sector is relatively new and the customer base for these minigrids represents poor, rural and often vulnerable
and marginalized groups, there are both government sensitivities and investor scepticism around wholesale
support of this technology from their respective viewpoints.
One of the reasons for this is that there is very little robust data available on the sector due to its small
scale and due to the remoteness of their operations. Governments and investors genuinely do not have good
understandings of the sector, its performance or its ability to deliver at scale. This report represents a major
milestone in closing this information gap, permanently.
In 2019, after more than a year of efforts to collaboratively create a robust data collection and sharing
methodology, AMDA partnered with Odyssey Energy Solutions and Economic Consulting Associates (ECA)
to respectively collect and analyse a significant dataset collected from AMDA members across the continent.
What has resulted is this report. The first of its kind, this report offers insights never before seen into the
performance of minigrid companies across Africa, as well as key insights into the barriers the sector is facing
and how we can work together to overcome them.
The data presented here cover up to a 10-year period in some cases. We focus on important metrics such as
installed and operating costs, financing, revenue per user, quality of service and various other key
sector indicators.
Results show that installation costs have decreased rapidly over the period to far below the average of state-
run utility connection costs, and the number of new sites and connections have grown radically since 2016.
Our analysis indicates that much of this gain can be attributed to funding coming into the sector and the steps
taken by governments to create conducive regulatory frameworks for
minigrid developers.
The data also shows, however, that much more work is needed on both of the funding and regulatory fronts
before we see the scale and cost reductions needed to bring minigrids into the mainstream.
An unsurprising but confirmatory key finding is the challenge of low consumption. Moving forward, it will be
fundamental for developers, donors and national governments to work together to enable and encourage
customers to increase productive energy use that can bring economic benefits to rural communities. This will
in turn ensure a financially viable operating environment for minigrid companies.
2.1 Who We Are
Africa Minigrid Developers Association (AMDA) was created by private sector minigrid developers and
operators, donors and investors interested in improving the political economic environment for minigrid
companies. AMDA’s work focuses primarily on helping the sector scale up using data, evidence and member
experiences to inform policies, regulations and investment.
1
World Bank ESMAP. (Forthcoming, 2020). Minigrids for Half a Billion People
12Introduction
It is AMDA’s and our members’ belief that the fastest, most economical way to deliver universal energy access
is through a mix of public and private approaches. The private sector can play a pivotal role given its ingrained
incentives to seek profitability by reducing costs, innovating ways to increase demand and operational
efficiency while providing high quality services. Hence, AMDA’s membership is currently limited to growth-
oriented (mostly private sector) companies.
Today, AMDA represents over 30 companies (encompassing all market leaders) who are operating minigrids
across 12 countries (see highlighted countries in map below). The minigrid market is growing rapidly but
is still small. For this report, our members provided data on their combined 288 sites, serving over 40,735
connections. Because of our private sector focus and membership, you will see that countries which do indeed
have hundreds of minigrids, such as Senegal, are not included in this analysis because these are state-owned.
In efforts to deliver on our mission to help the sector scale, AMDA members and sector stakeholders agreed that
one of the most helpful roles we can play is to work to create transparency around industry performance. Key
decisions on how to electrify rural and remote populations cannot be made effectively without a comprehensive
understanding of technologies, business performance and trends.
One of the biggest challenges for minigrids in Africa is that they are inherently located in hard to reach, hard to
monitor areas. This, coupled with the fact that their customers are often vulnerable, marginalized and remote
communities, means that there are both challenges in understanding minigrid operations and also in ensuring
that their customers are indeed being served well and served fairly.
It is within this context that AMDA has produced this first data benchmarking report with our partners Odyssey
Energy Solutions and Economic Consulting Associates (ECA).
Odyssey Energy Solutions is an online investment and asset management platform developed to facilitate
large-scale deployment of capital into the energy access sector. The Odyssey platform manages data across
the full lifecycle of distributed energy portfolios, helping to streamline project development, financing, and
operations. Odyssey also has powerful data analytics tools that provide secure data-sharing and analysis
between industry stakeholders. The platform integrates large data sets of information from all angles of the
sector into standardized key performance indicators, allowing for easy and clear evaluation of minigrids and
other energy access projects. It allows governments,
investors, donors and minigrid companies themselves
to better visualize and understand the sector.
Currently, the Odyssey platform is being used in more
than 30 countries across Africa, facilitating nearly US$
500 million of capital into solar minigrids and other
distributed energy projects. The platform is supported
and used by leading financiers, governments,
private companies and industry organizations to
manage and share critically important sector data
with key stakeholders. As a leader in results-based
financing (RBF) technologies, the Odyssey platform
is managing sector-leading RBF programs, including
some of the largest rural electrification financing
programs in history. Odyssey’s advanced analytical
tools are being used to remotely monitor tens of
thousands of distributed energy systems, verify
electricity connections, measure system performance
and reliability, and track program impact.
13Introduction
Odyssey has proven that digital technologies can significantly reduce the cost of large-scale deployment
and financing of minigrids and other distributed energy projects, while increasing transparency, efficacy, and
visibility to all stakeholders. Odyssey, in partnership with AMDA, aims to provide a data-driven approach to
decision-making and investment into the minigrid sector.
Economic Consulting Associates (ECA) is an economic and regulatory consultancy specialized in advising
private companies, governments, regulators, utilities, and donors on issues relating to the energy, water, and
infrastructure sectors. One of ECA’s core competencies is advising on market assessments, investment
planning, and energy access frameworks and financing across the world, with a special focus on mini-grid
development. ECA has prepared minigrid policy and regulatory frameworks for governments, conducted
market due diligence and project feasibility studies for developers and investors, and designed financing
facilities for donors and private financiers across Africa, Asia, and the Pacific region.
14Methodology
3. Methodology
Photo Credit:EngiePowerCorner
15Methodology
Methodology
The data in this report represents the culmination of work of AMDA’s data working group of minigrid
developers and operators, alongside researchers, investors and other key sector stakeholders2.
This group collaborated for over a year to develop a methodology and set of metrics that delivers information
that decision-makers need while also protecting the interests, anonymity and intellectual property of private
minigrid businesses. The resulting data collection tool pulled together information on over 60
different indicators.
All AMDA members and two developers that were not members submitted data. This represents the vast
majority of companies on the continent and encompasses all market leaders and a good sample of smaller,
newer companies as well. The flowchart below outlines the process for developing and executing the
benchmarking study.
01 02 03
AMDA Develops Reporting External Stakeholder Review Multiple NDAs signed
Structure and Structuring - Between developers and AMDA
Metrics designed over multi-day Multi-day meeting with 20 sector - Between AMDA and Odyssey
internal workshop addressing data experts to ensure metrics and - Between ECA and AMDA
needs, collectability, calculations and methods were in line with sector - Between Odyssey and ECA
intellectual property concerns needs, professional research
standards and external expectations.
04 05 06
Data upload to Odyssey AMDA grants ECA access to Preparation of data analytics
- Developers input site and company raw, anonymized data and report
- ECA cleans data
data, and maintain ownership of their - ECA aggregates and analyses
- ECA poses queries to AMDA where
data gaps & uncertainties exist anonymized data points.
- Odyssey anonymizes data - AMDA works with developers to - ECA writes initial draft report
- Developer grants AMDA access to rectify data issues or links developed
data outputs only, not raw data with ECA
07 08 08
Peer Review Odyssey data tool hosted on Publication and
- Key researchers and institutions AMDA's website Dissemination
peer review the report. - Interactive map - Published report presented to key
- Peer review comments/ - Visualisation of sector information stakeholders via webinars, blog
suggestions were incorporated into at continental and national levels. posts, bilateral meetings, and public
the document. events.
Participants in design: Rockefeller Foundation, Shell Foundation, CrossBoundary Energy, Energy4Impact, RMI, TFE Consulting,
2
University of Massachusetts at Amherst, Carnegie Mellon University, SparkMeter, SteamaCO, Odyssey, GIZ, New Sun Road, AMMP,
National Renewable Energy Laboratory (NREL), and the Power Africa Off-grid Project (PAOP).
16Methodology
The data questionnaire was separated into three sections (the template can be found in Annex A):
• Projects – Data was requested for each minigrid site owned and operated by developers in this study.
The data collected includes capital and operating costs, operational data, sales, number of connections
and other technical and operational data.
• Organisations – The data was collected at a developer level and included data on time required for
acquiring licenses and number of employees for every year of the developer’s operations.
• Finance – Finance data was also collected at a developer level and included the amount received, funding
source, the type of funding and year of receiving the funding. The developer’s own equity and interest
rates on debt were excluded from the data collection.
The data was collected through three Microsoft Excel data templates, corresponding to the sections listed
above. All developers were given a randomised unique ID to preserve anonymity. Developers reported on
site-specific data for all operational sites commissioned before June 30, 2019. In one case, this included
historical and technical data dating back to 2010. The vast majority of data, however, was from 2016-19, and
operational data such as operational expenses (OPEX) and average revenue per uses (ARPU) were collected
for the 12-month period from July 2018 – June 2019.
While the data in this report represents the most robust sectoral data in Africa, there are several limitations
of the dataset. It only represents private sector minigrids and does not provide comprehensive comparisons
to national utility operations, as very little data exists for them. We have provided national utility figures where
possible, but much more research and analysis is needed in comparing the two. This will really only be
possible if more transparent national utility data is made available however.
In line with most industry datasets, this report relies on self-reporting. In this case, from 28 developers
operating across 12 countries. The data presented for revenue, consumption and operations costs all comes
from a single year and therefore we are unable to track longitudinal trends in this study. Changes over time will
however be analysed in subsequent benchmarking studies as our dataset grows.
While all developers reported on most metrics, there are some gaps in the data from a subset of the developers
that limited the analytics that could be derived. Responses for 90% of the questions were standard and required
no clarification or follow-up. After collection, a data cleaning process was undertaken to identify outliers and
consult with developers to correct any errors. Where validation of the data was not possible, outliers were
excluded from the dataset. Care was taken to only exclude outliers resulting from an error in the data
collection process.
Due to the amount of commercially sensitive information in the dataset, steps have been taken to ensure
information presented here cannot be traced back to any single developer. These steps included not visually
presenting data in tables and charts from periods when few developers were operating and providing regional
data rather than country-specific data for countries where identifying companies would be possible due to the
small number of operators there.
Given this, the categorisation of Western & Central Africa and Eastern & Southern Africa was developed to
ensure the anonymity of data. The countries included in each region are:
• Western & Central Africa – Benin, Cameroon, Mali, Mauritania, Nigeria, Sierra Leone, Togo
• Eastern & Southern Africa – DRC, Kenya, Madagascar, Tanzania, Zambia.
17Methodology
Solar photovoltaic (PV) was the prevalent generation technology in the dataset, with two hydropower sites as
the only exceptions. Because there is a significant difference in the cost structure and operating behaviour of
hydropower and solar PV, the two hydropower sites have been excluded in all cost analytics. Nonetheless,
their exclusion was not statistically significant to influence the outcome of the analysis.
Table 3.1: Overview of developers and reported sites
Total sites Number of developers Year of first site Year of latest site
Benin 1 1 2019 2019
Cameroon 7 1 2014 2019
Democratic Republic of
1 1 2017 2017
Congo
Kenya 192 6 2010 2019
Madagascar 7 2 2014 2019
Mali 23 1 2007 2018
Mauritania 2 1 2017 2018
Nigeria 3 4* 2017 2018
Sierra Leone 3 1 2019 2019
Tanzania 43 7 2012 2019
Togo 1 1 2019 2019
Zambia 5 2 2018 2019
Total 288 28
* Includes non-AMDA developers who provided partial data
Table 3.2: Overview of quality of data received
Data category Responses received Complete Partial responses Limited responses*
responses
Project data 288 67 19 91
Organisational data 79 47 25 7
Financing data 64 64 0 0
*Limited responses are all responses that did not provide sufficient data to be included in cross-sectional analytics. Most responses
included under this heading were not incorrect, but due to the developers’ business models, short reporting period or data gaps, they could
not be used in the analysis
.
18Sector Growth
4. Sector Growth
Photo Credit: PowerGen
19Sector Growth
Sector Growth
4.1 Electricity Access and Growth of Energy Services
The analysis in this section shows that the minigrid sector i s on the cusp of commercial scale. By 2019, more
than 200,000 people and over 40,000 households, health facilities, schools and businesses were electrified
by the developers represented in this study. We estimate that developers represented in this report account
for approximately 35% of operational, non-utility-owned renewable energy minigrids across all of Africa and
60% of Solar PV and Hybrid Solar PV minigrids in the countries represented in this study3. NGOs, government
utilities, and captive power minigrids make up the vast majority of remaining minigrids.
Our data show that in 2017, connection rates began to increase rapidly, showing impressive year-on-year
growth. The rapid growth in the last three years overlaps precisely with the timelines of various policy/regulatory
changes and donor programs that, particularly in East Africa, began exploring how to support the sector more
robustly. Our data reassuringly shows that, like any other sector in any other market, good policy and the right
incentives foster growth that lowers costs and improves service.
In what follows, the numbers of connections are correlated to single accounts tied to unique electricity meters.
While occasionally a household and business connection may be combined into one, for the most part, behind
every connection there is a household, facility or business that now has access to electricity for their lighting,
social, heating, and productive needs.
4.2 Total connections
In 2010, there was a single AMDA member operating and less than 1,000 connections. By beginning of 2016, there
were still less than 5,000. However, just three years later in 2019, services had been extended to 288 communities
across 12 countries, increasing the number of connections to over 40,000.
Of all the countries in which AMDA members operate, two countries in particular have shown the greatest growth in the
number of connections - Kenya and Tanzania. Together they account for approximately 70% of all new connections in
the dataset, over 28,000 in total.
Figure 4.1: Overview of total number of connections
45,000
40,000
35,000
30,000
25,000
20,000
15,000
10,000
5,000
2010 2011 2012 2013 2014 2015 2016 2017 2018 2019
Eastern & Southern 85 85 85 407 778 1014 1,892 4,428 17,102 29,860
Western & Central 0 0 0 0 10 10 40 616 1,421 10,875
Total Connections 85 85 85 407 788 1,024 1,932 5,044 18,523 40,735
3
Cross referenced using the Bloomberg NEF global minigrids project database (Publication forthcoming)
20Sector Growth
With construction ramping up in Nigeria, and programs starting to come online in Benin, Sierra Leone, Zambia and
many others in development elsewhere, we expect this balance to shift in the coming years. Note that under normal
circumstances, those with a head start would stay in the lead. However, due to policy and regulatory hurdles now being
seen in Kenya and Tanzania, we are seeing slow-downs in connection rates in established markets and a migration of
developers and donor funding into new markets.
4.3 Total installed kW and number of sites
Alongside increasing connection numbers, the installed generation capacity of developers has also increased
over ten times from January 2013 to June 2019, from 203 kilowatts (kW) to just under 2,500kW of solar
PV capacity. At the same time, the number of new sites has been increasing rapidly, with over 81 sites
commissioned in 2019. The total installed capacity for minigrids across the continent is projected to grow in
direct proportion to the concessional funding available, as this funding is essential in enabling growth.
Figure 4.2: Installed capacity and commissioning of new sites
Figure 4.2: Installed capacity and commissioning of new sites4
Installed capacity and new sites
35 3,000
30 2,500
Installed capacity (KW)
25
2,000
20
1,500
15
1,000
10
500
5
0
2013 2014 2015 2016 2017 2018 2019
New sites Cumulative
commissioned installed capacity
4.4 Concessional Funding: True Scale Requires Systemic Support
Similar to rural electrification efforts worldwide5, sub-Saharan Africa needs some degree of subsidy to bridge
the gap between the high cost of infrastructure and the low incomes of communities they serve. The growth
trajectory for the minigrid sector is therefore unsurprisingly directly linked to access of concessional funding
(both grants, and more recently, concessional debt). Broadly speaking there are two avenues through which
this support can be channelled:
• Demand-side measures, where the customers are encouraged to consume more electricity by subsidising
kilowatt consumption, appliances or incentivising the creation of local businesses. The result of demand-
side support is increased revenue for developers and more affordable electricity for all customers, as
discussed in Section 6.
• Supply-side measures such as direct grant funding, subsidised loans or results-based financing (RBF)
schemes provide money to minigrid developers. These measures aim to reduce the cost of supplying
electricity and encourage developers to expand their supply to new households.
4
2019 data is partial data only for sites commissioned between Jan 1, 2019 and June 30, 2019
5
Duke University’s Energy Access Project. (2020). Lessons for Modernizing Energy Access Finance, Part 1: What the Electrification
Experiences of Seven Countries Tell Us about the Future of Connection Costs, Subsidies, and Integrated Planning. Available at: https://
energyaccess.duke.edu/publication/learning-from-the-past/
21Sector Growth
The majority of funding received by developers in this survey were supply-side grants
aimed at reducing capital costs. Since 2012, the donor community’s contribution
to minigrids has steadily increased, with over $2 billion in committed funding to the
worldwide minigrid sector. Of this funding, close to $1.6 billion has been allocated
to the minigrid sector in sub-Saharan Africa Much of this funding was approved to
be disbursed by recipient governments through nationally managed
procurement processes.
At the time of writing, However, due to limited capacity to manage these procurement processes, most
only about 13% of of this funding has not been disbursed. At the time of writing, only about 13% of
the approved $1.6 the approved $1.6 billion in funding has been disbursed.6 For developers in this
billion in funding has study, only approximately US$ 40 million of public and private grants, and US$
been disbursed. 10m in concessional debt has been contracted and paid out since 2013. Data on
equity investments from DFI’s and other investors was not collected but will be in
subsequent studies.
Funding from Tanzania’s RBF scheme, managed by the Rural Energy Agency
(REA), accounts for close to 20% of total funding received by all developers across
the continent during this period and 30% of total donor funding, as reported by
developers in this study. Figure 4.3 shows the imbalance of funding towards East
Africa in these early years of the minigrid sector’s development, which reflects the
substantially larger number of connections seen in East Africa thus far.
Indeed, the donor
The grant and concessional funding only supplied a portion of the total capital
funding into Kenya
required to build the 40,000 connections we see today, however. Its main function
and Tanzania led to
has been to unlock the private and impact investment capital that was interested in,
private investments
in nearly allbut uncertain about, the minigrid sector. Indeed, the donor funding into Kenya and
companies in those Tanzania led to private investments in nearly all companies in those countries. This
countries. public support is so important that groups of investors have written a position paper
Figure 4.3: Funding Received
calling by RBF
for more Region
schemes from donors to help unlock further investor capital,
which they are keen to invest in minigrids.7
Figure 4.3: Funding Received by Region
18,000,000
16,000,000
14,000,000
12,000,000
10,000,000
US$
8,000,000
6,000,000
4,000,000
2,000,000
0
2013 2014 2015 2016 2017 2018 2019
Eastern & Southern Western & Central
6
Global Minigrid Partnership. (2020). State of the Mini-Grids Market.
7
Power for All. (2019). Investor Position Paper: Unlocking Private Capital for Minigrids in Africa. Available at: https://www.powerforall.org/
resources/calls-to-action/investor-position-paper-unlocking-private-capital-minigrids-africa
22Sector Growth
In figure 4.4 and table 4.2, below, all donor and foundation funding was in the form of grants. The funding
labelled “corporate” below is from private entities in the form of grants or debt and is separate from private
equity investments. “Corporate / internal” funds represent both grant and debt funding from corporate entities
that have a legal connection to the recipient. While we do not have private equity investment numbers due to
the sensitivity
Figure 4.4:ofComparison
private investment data, it by
of funding is clear
typethat the Green Minigrid (GMG) facility in Kenya and RBF
facility in Tanzania enabled significant private investment that led to the rapid growth in sites and connections.
Figure 4.4: Comparison of funding by type
20.0
18.0
16.0
14.0
Other / No information
12.0
US$(m)
Foundation
10.0 Donor
8.0 Crowdfunding
Corporate / Internal
6.0
Corporate
4.0
2.0
0.0
2013 2014 2015 2016 2017 2018 2019
Donor category includes donor funds disbursed through RBF schemes managed by government entities
Table 4.2: Funding received
Grants – Capex Grants – Opex Debt
Corporate 4.2 million USD - -
Corporate / Internal 0.4 million USD - 10.0 million USD
Crowdfunding - - 0.3 million USD
Donor 27.0 million USD 3.0 million USD -
Foundation 1.4 million USD 0.2 million USD -
Other/ No information 1.3 million USD 3.2 million USD -
One important linkage between funding and connections is the time between payment of concessional funding
and delivery of a connection. Due to the length of time it takes to secure additional private funding, ensure
regulatory compliance, and then procure, build and commission a minigrid, there is usually a lag of one to
two years between the allocation of public funding and measurable results from the site. This shows the
importance of creating reliable, predictable, long term public funding and the need to streamline processes
such as licensing, tariff approvals and other government permissions. We explore these enabling environment
factors in Section 8.
8
The decreased growth rate in 2019, however, can be explained by the fact that at the time of data collection, only first half-year connections
had been submitted by developers.
23Sector Growth
Figure 4.5 below shows how significant public funding is for unlocking capital and
connections for the sector, as well as the lag between disbursement and having
a live connection. Given the delay between funding dispersal and commissioning
of sites thus far, funding from 2018 and 2019 should provide an indication of the
number of new connections delivered by June 2021. 8
Figure 4.5: Lead time of funding on new connections
Figure 4.5: Lead time of funding on new connections
45,000 20
40,000 18
35,000 16
14
30,000
12
25,000
10
20,000
8
15,000
6
10,000 4
5,000 2
0 0
2010 2011 2012 2013 2014 2015 2016 2017 2018 2019
Figure 4.6: Growth rates for minigrid deployment
Debt Grant (central) Grant (Project) Grant (Project)
Figure 4.6: Growth rates for minigrid deployment
400%
300%
Growth
200%
100%
0%
2010 2011 2012 2013 2014 2015 2016 2017 2018 2019
Public funding in years The vast majority of this is directly attributed to the availability of the GMG facility
2016 and 2017 led to in Kenya and RBF facility in Tanzania. Public funding in years 2016 and 2017 led to
connection growth connection growth rates of 161% in 2017 and 267% in 2018 as shown in Figure 4.6.
rates of 161% in 2017
and 267% in 2018
9
World Bank Group. (2016). Financial Viability of Electricity Sectors in Sub-Saharan Africa. Available at: http://documents.worldbank.org/
curated/en/182071470748085038/pdf/WPS7788.pdf
24Sector Growth
4.5 National Government subsidies in the electricity sector
Providing subsidised funding or grants to electric utilities is the most common method
used by governments and donors to make electricity more affordable to consumers.
Due to the lack of government subsidy information in most sub-Saharan African
countries, estimating the true cost of electricity supply is not currently possible – but
it is significant.
Financial deficit, In efforts to at least understand if public utilities in Africa were covering their costs,
or hidden subsidy, a 2016 World Bank study found that only two Sub-Saharan African countries had
of the electricity financially viable electricity sectors at the time, Uganda and the Seychelles9. When
is sector to equal accounting for transmission and distribution losses, 18 countries were only able to
approximately 1.5% recover operating costs but not their capital costs. The study estimated the financial
of each country’s deficit, or hidden subsidy, of the electricity is sector to equal approximately 1.5% of
GDP on average. each country’s GDP on average.
Within countries, cross-subsidies flow between profitable areas and un-economic
areas. Also within profitable locations, these cross subsidies flow between
profitable and unprofitable classes of customers. In particular, high consuming and
dense urban customers generate a lot of revenue and are inexpensive to connect.
These urban customers pay the same or higher tariffs as their rural counterparts,
subsidizing low consuming, sparsely populated areas.
Because minigrid operators only serve rural consumers, it is very difficult to
cross-subsidize their customers, particularly when companies only have a few
communities in their portfolio. Hence comparing national utilities with minigrids on
the basis of tariffs does not capture the full picture of either business and is not an
even comparison.
4.6 Key insights
The data show that the African minigrid market is
Donor not substantively different to any other nascent
Funding industry or rural electrification efforts globally:
public funding for minigrids in rural sub-Saharan
Private
Investment Africa is a key element in kick starting scale up,
largely by crowding-in other investors.
Community Furthermore, concessional funding is a crucial
Economc
part of the positive feedback loop that generates
Growth /
scale: The interlinkages between concessional
Productive
use adoption funding, private investment, enabling
Enabling
environment and deployment work together
Environment /
Policy and to ramp up delivery of energy access. The
regulation interconnectedness of these elements are so
Minigrid fundamental that disruptions can derail growth
Deployment
or even turn this into a negative feedback loop.
Growth
For the sector to scale all aspects of the cycle
need to be operating holistically.
10
ESMAP (forthcoming, 2020). Minigrids for Half a Billion People.
25Specific insights from the evidence presented here for sectorstakeholders include:
• Policy makers and regulators – Minigrids can deliver connections to rural and remote communities at scale.
Regulatory timelines lead to delays between public investment and private investment – and therefore also
delays the positive impact governments want to see. Working with development partners and the private
sector to reduce delays will lead both to more confidence, and more money from investors, enabling a
pathway to faster results.
• Development partners – Public funding works. Setting up predictable, longer term support facilities will
enable companies and their investors to plan, build expertise and technical capacity, and deliver rural
energy access at scale. Due to the regulatory bottlenecks noted here and explored later in much more
detail in section 8, technical assistance on digitizing, simplifying and otherwise streamlining regulatory
processes is urgently needed. Particularly around bulk approval of multiple sites at once. Individual
approvals for the 140,000 sites Africa needs will not be possible using current approaches.10
• Investors – the sector has begun a radical expansion that will only continue if investors are open and
transparent about their intention to invest and the conditions of that expected investment. Making investor
needs crystal clear will guide donors and policymakers in supporting the sector, and minigrid developers
to match their actions and strategy to investor needs.
26Costs
5. Costs
Photo Credit: PowerGen
27Costs
Costs
Capital expenditure related to the construction of new minigrids is one of the main cost inputs determining the
affordability of electricity to end-users. As can be seen from the figures presented in this section, costs have
been decreasing, resulting in more affordable electricity for households and more rapid improvement in the
quality of lives of the
recipient households.
An interesting caveat to this trend is in regards to new players and new market entry. Our evidence shows an
increase in installed costs in 2019, which is linked to new, inexperienced players entering the sector as well as
experienced companies moving into new, unfamiliar markets where their lack of familiarity and on-the-ground
knowledge sees a loss of past cost reductions.
Our data show that across the board, as developers gain more experience and are allowed to scale up their
operations, the cost of new installations decreases, resulting in more affordable electricity. Given that the
survey indicates most AMDA developers presently only have between 1-3 sites, there is considerable potential
for scale to quickly reduce costs through economies of scale and experience-based learning moving forward.
5.1 CAPEX trends
There is much more than global price of commodities or equipment to consider when evaluating capital
expenditure (CAPEX) costs. Economies of scale, investment and regulatory stability play major roles in final
construction costs. Although it is not possible to distinguish the impact of each of these variables on the
CAPEX costs in the dataset, an analysis of the more experienced developers in the dataset reveals that
average costs per connection decreases as developer portfolios increase. For our research, CAPEX costs for
a minigrid site were broken down into six categories:
• Generation assets – includes the cost and installation of assets relevant to the generation and supply of
electricity such as solar PV panels and balance of system, batteries, back-up diesel generators and other
relevant assets.
• Distribution assets – includes the cost and installation of assets and equipment related to delivering
electricity to the end-user and includes items such as wiring, poles insulators and safety equipment.
• Logistics, transport, warehousing – costs associated with transporting equipment, storage costs and
logistics during planning, construction & labour.
• Metering and termination – Overhead accessories for dropline to the home, meters & other costs for
customer connection, including internal wiring and basic power kit of light & socket
• Site development – costs associated with preparing the site for construction.
• VAT and Duties – any VAT and duties paid on solar assets that should be exempt from taxes but are
incurred due to inconsistent application of VAT and duty exemption laws.11
Of these, costs associated with generation assets were shown to make up about 45% of total installed costs.
The figures below show a comparison of each cost category as a percentage of total installed costs.
11
Not all developers incur these costs in the importation process and are only seen in 2019 data.
28Costs
Figure 5.1: Comparison of relative installed costs
Total: 12 countries Eastern & Southern Africa Western & Central Africa
VAT & Duties 2 % VAT & Duties 3 % VAT & Duties 0 %
Site development 9% Site development 9% Site development 10%
Metering 15% Metering 15% Metering 16%
Generation 45% Generation 44% Generation 51%
Logistics 6 % Logistics 6 % Logistics 6 %
Distribution 22% Distribution 23% Distribution 17%
Our data show that development costs of minigrids have been consistently
decreasing since 2014 across all regions in sub-Saharan Africa. Although costs
have been decreasing on average, the data show that there is still a significant
difference in costs between developers or ranging from about US$ 4,000/kW
for the lowest cost site to about US$ 11,000/kW for the highest cost site. Given
the small size of the sample and limitations of the data collected, we cannot
conclusively determine all the factors driving costs down. However, it is clear that
developer experience plays an important role. Expertise in site selection allows
for more appropriate communities to be identified, driving down distribution costs;
and over time efficiencies in navigating regulatory compliance, procurement, and
importation drive down costs as well.
Over the last decade, global prices of solar PV panels and batteries decreased
significantly and have played a role in the trend of decreasing minigrid costs.
However, global pricing is derived from bulk procurement. Given that only
2,468kW have been installed across all AMDA developers, procuring assets at
the global market price is not possible and will not be possible until considerably
The average installed larger portfolios are developed and asset procurement is significantly larger.
costs decreased
Figure 5.2 below shows the evolution of the average installed costs per kW.
by 65% between
The average installed costs decreased by 65% between 2015 - 2018 from
2015 - 2018 from
approximately US$ 14,000/kW to US$ 6,200/kW. Cost figures from 2019 are an
approximately US$
exception to this trend, as costs increased across all cost categories and for most
14,000/kW to US$ regions due to costs associated with new market entry. As is explained in the next
6,200/kW section, prices remain stable for experienced developers expanding operations in
their existing markets.
29Costs
Figure 5.2: CAPEX costs
Figure 5.2: CAPEX costs
16,000
14,000
12,000
VAT & Duties
10,000
Logistics
US$/kW
8,000 Site development
Metering
6,000 Distribution
Generation
4,000
2,000
0
2014 2015 2016 2017 2018 2019
Figure 5.2 shows the evolution of average installed costs from 2014 - 2019 for all cost categories, but it fails
to capture the significant difference in reported costs among developers. The reported costs per kW differed
both within each country and between developers. The largest internal differences in costs are for distribution,
logistics and site development, suggesting that a part of this cost is due to a particular site.
Figure 5.3 below shows the same total average cost trend as the figure above, but with the addition of the
median and one standard deviation above and below the total average. A wide range in the average installed
costs is evident. The reasons for this cannot be extracted from the dataset, but such observations are common
in nascent industries. We expect the CAPEX cost variances to shrink as the sector matures and businesses
coalesce further around common best practices.
Figure 5.3: Average and median total installed costs with one standard deviation
Figure 5.3: Average and median total installed costs with one standard deviation
20,000
+ 1 SD
18,000
Average
16,000 Median
14,000 -1 SD
12,000
US$/kW
10,000
8,000
6,000
4,000
2,000
0
2014 2015 2016 2017 2018 2019
30Costs
5.2 Explaining 2019 Costs through Economies of Scale and Market Expansion
Figure 5.4, below shows the average cost per connection for minigrid developers over the past six years. Cost
per connection data allows for a more direct comparison to utility costs as well as normalizes fixed consumer
costs (i.e. metering). Between 2014-2018 minigrid developers saw a dramatic price drop across the continent
as costs fell from US$ 1,555 per connection to US$ 733 per connection in 2018.
After multiple year-on-year reductions in both US$ / kW and US$ / connection figures, data from the first
half of 2019 shows an increase. While this may raise initial red flags to the casual observer, this is due to
new (inexperienced) minigrid companies coming into the market while existing companies are expanding
operations into new markets, as illustrated by figures 5.5 & 5.6.
Figure 5.4: CAPEX per connection trends by experience
Figure 5.4: CAPEX per connection trends by experience
2500
2000
1500
1000
500
0
2014 2015 2016 2017 2018 2019
Average $ / Connections New Dev. In Established Market Experienced Developer in Established Market
The increase in 2019 cost per connection is multifaceted. However, it is rooted in experience and the number
of new developers that entered the market in 2019. In 2018, 78% of new sites were constructed by established
developers in established markets, whereas in 2019, only 40% of new sites were in established markets, with
60% in new markets.
Experienced developers in established markets between 2016 and 2019 were on average 41% less expensive
than new developers in those same markets. 2019 saw the first real expansion of existing operators into new
markets. As can be seen from figure 5.6, this expansion increased the average cost per connection. While
we do not have enough data to fully explain the cost increase in new markets, a partial explanation is that
increased system sizes, VAT costs on solar assets, fewer connections per site and higher site development
costs contributed to the overall cost increases. We will be able to better understand how new markets affect
pricing in subsequent reporting as our data set grows.
12
Zesco. (2018). Preparation of the National Electrification Program Report 2018.
13
Castellano A., Kendall A., Nikomarov M., & Swemmer T. (2015). Brighter Africa: The Growth Potential of the Sub-Saharan Electricity
Sector. McKinsey & Company. Available at: https://www.mckinsey.com/~/media/McKinsey/dotcom/client_service/EPNG/PDFs/Brighter_
Africa-The_growth_potential_of_the_sub-Saharan_electricity_sector.ashx
14
World Bank Group. (2014). World Bank Group Support to Electricity Access, FY2000-2014: An Independent Evaluation. Available at:
https://openknowledge.worldbank.org/bitstream/handle/10986/22953/96812revd.pdf?sequence=9&isAllowed=y
31You can also read