Best practice of macroseismic intensity assessment applied to the earthquake catalogue of southwestern Germany
←
→
Page content transcription
If your browser does not render page correctly, please read the page content below
Historical Earthquakes, Paleoseismology,
    Neotectonics and Seismic Hazard:
    New Insights and Suggested Procedures
                                                                                              DOI: 10.23689/fidgeo-3864

Best practice of macroseismic intensity assessment
applied to the earthquake catalogue of southwestern
Germany
Wolfgang Brüstle1, Uwe Braumann1, Silke Hock1 & Fee-Alexandra Rodler1

1
 formerly at Regierungspräsidium Freiburg, Landesamt für Geologie, Rohstoffe und Bergbau, Landeserdbebendienst
Baden-Württemberg, Freiburg, Germany, email address of corresponding author is wolfgang.bruestle@online.de

Abstract
The earthquake catalogue of southwestern Germany for the last millennium now contains about 30,000
digital macroseismic intensity data points (IDPs). Intensity assessments are based mainly on primary
sources using the European Macroseismic Scale 1998 (EMS). The article describes a guideline for best
practice of conventional macroseismic evaluation in application to historical and modern-time
earthquakes in SW-Germany. Suitability of various diagnostics for intensity assessment is discussed.
Assumptions to estimate damage grades and vulnerability classes of buildings are presented. Data
restrictions and treatment of special cases are outlined. Further topics are quantification of uncertainties
and IDP quality as well as substitutes for intensity. An essential task is to bridge the gap between
information from historical sources and seismological needs for use in the earthquake catalogue, thus
all issues have a focus on historical earthquakes. Questions of completeness, subjectivity, transparency,
and interdisciplinary work are addressed also. Special emphasis is given to a well balanced use of the
EMS scale throughout all time periods leading to consistent assessments in the catalogue.

1. Introduction
1.1. Earthquake catalogue
The parametric earthquake catalogue of southwestern Germany (SW-Germany) was compiled by the
Seismological Service Baden-Württemberg (the “Landeserdbebendienst”, abbreviated: LED) in a five-
years project from 2013 until 2017 at Freiburg, Germany (Brüstle et al., 2021). The name of the project
was “Seismological and historical compilation of the earthquake catalogue for Baden-Württemberg,
SW-Germany, from 1000 AD until today and acquisition of earthquake information in a database”
(referred to as “the/this project”). The “LED catalogue” (or simply “the catalogue”, if not specified
otherwise) covers the region that is today the German Federal State of Baden-Württemberg including
surroundings, as far as seismicity there is seen relevant for the catalogue, hence particularly including
the border regions in France and Switzerland alongside the river Rhine.

In this article, the term “historical” is used generally for the time period of the last millennium before
the turn of the 19th to the 20th century. All year dates mentioned are years AD. The period of the
20th century and thereafter is called “modern time” or “instrumental time” with reference to the

                                                                                                                     7
seismographical records. The project was oriented towards a conventional assessment of macroseismic
“intensity data points” (abbreviated: IDPs in plural, and IDP in singular form, see section 2.1.1. below)
from the most relevant sources. “Conventional” stands for a non-formalized manual evaluation of the
sources by expert judgement. The term “sources” is used denoting any kind of information on that the
evaluation can be based on. Macroseismic intensities (or “intensities” for short) were assessed using the
European Macroseismic Scale 1998 (published by Grünthal, 1998; hereafter abbreviated and shortly
quoted as “EMS” or “EMS scale”) and a special guideline (see section 1.2.). Intensity is notated in
Arabic numerals. The terms “damage” and “vulnerability” refer to buildings in the sense of the EMS,
if not specified otherwise. Internet macroseismic data acquisition and automated determination of
intensities are not considered in this article.
The present article focuses on methodological issues of macroseismic evaluations. Examples from the
catalogue serve for illustrative purposes only. – In the remainder of this section just a short overview
over the catalogue is given. Detailed information about the catalogue and the project, including sources
and IDP data, will be published elsewhere (Brüstle et al., 2021).
For the first time in SW-Germany, a systematic and comprehensive search for information about
historical earthquakes was carried out in the project using primary sources as far as possible. “Primary
sources” are understood as contemporary witness testimonies, on-site records, field survey reports, first-
hand information accounts of various kinds, etc. (occasionally also referred to as “direct sources” or
“original sources”). The search for primary sources was considered an essential prerequisite for the
compilation of a reliable earthquake catalogue (see also IDP quality in section 2.8.4.). More than 30
archives and libraries were visited on-site and many others online. Altogether about 1,100 relevant
documentary sources from the 15th to the 19th century could be found, of which 700 had been unknown
to seismology before. For earthquakes in the Middle Ages, on the other hand, almost no new primary
sources were found. – Earthquake information was retrieved from various source types, comprising
both official and private documents, either handwritten, printed or pictured, for example from annals,
chronicles, protocols, repair bills, church registers, sermons, diaries, memoirs, letters, leaflets, notices,
gazettes, newspapers, questionnaires, bulletins, catalogues, journals, and visual material. – The
historical sources were evaluated in a historical-critical way by properly taking into account their
context with regard to geographical, political, social, cultural, and mental, as well as to linguistic,
historiographical, and archival aspects (see EMS, pages 50-53; Gutdeutsch et al., 1987; Guidoboni,
2000; Gisler, 2003; Grünthal, 2004; Albini et al., 2004; Mayer-Rosa & Schwarz-Zanetti, 2004;
Hammerl, 2017; and many others). Great care was taken to ascertain historical detail and to document
the sources as well as the evaluation process. Special emphasis was given to a well-balanced use of the
EMS scale throughout historical and modern times.
The project work was strongly focussed on historical IDP assessment. For the historical time period
only few IDPs had been available before. Now, for the first time, historical seismicity of SW-Germany
is fully present in IDP format. About 3,000 digital IDPs, with intensities based on the EMS scale, from
more than 400 historical earthquakes were determined in the project, in majority of the 15th to the 19th
century. This constitutes a completely new data set.
In the modern time period, instrumental seismology started in SW-Germany at the beginning of the
20th century. Routine seismographic epicentre localisation and calculation of local magnitudes on the
Richter-Scale, however, were established just in the 1960ies. Traditional macroseismic questionnaire
surveys have been continuously carried out already since the end of the 19th century. At first, the
questionnaires had been replied primarily by selected correspondents (“makroseismische Beobachter”,
i.e. macroseismic observers) with focus on their individual observations. Later on, the system has been
changed towards responses from the municipality or town administration offices using a collective form
(with questions to the burgomaster office in the style of, “what happened in your commune?”). Hence,
in general, an IDP has been based on one collective questionnaire. To a minor part, spontaneous
responses, usually in the form of letters and postcards, came in as well. Questionnaires have been
distributed and returned by postal mail, lately also by fax and email; the originals are kept in the LED
archive. – The bulk of these questionnaires was completely re-evaluated in the project on the basis of
8the EMS scale. Dealing with various questionnaire styles and handwritings, appropriate working
procedures had to be established. Thereby, a high level of consistency of intensity assessments from
questionnaires could be achieved, which had not been given before due to changing questions, forms,
practices, scales, and evaluators in the course of the 20th century.
For the modern time, about 140 of the strongest 20th-century earthquakes in SW-Germany (from about
intensity 5 EMS upwards), plus a few after 2000, were re-assessed in the project yielding an amount of
about 26,000 digital IDPs. About 80% of these IDPs were derived from the questionnaires, about 20%
from direct surveys, letters, postcards, newspaper reports, as well as from secondary transcriptions. This
data set is also novel inasmuch as the IDPs are now all digital and consistently based on the EMS scale.
The most recent macroseismic data come from questionnaires using forms made available via the
internet (hereinafter termed internet macroseismic questionnaires, abbreviated: IMQ); this kind of data
is processed automatically, usually within postal code areas (e.g. Wald et al., 1999 and 2011). IMQ data
have been collected by the LED since 2012 but are not dealt with in this article.
In a few cases, some IDP data were adopted from other seismological agencies, catalogues, or
compilations keeping the original choice of the intensity scale; hence, no transformation of intensities
from other scales into the EMS scale (e.g. by using a formula) was carried out. To some part, these
“imported IDPs” complement own ones. If own IDPs had been present from earlier work and were
replaced by re-assessed ones in the project, the “replaced IDPs” were kept in the database as well, for
comparison, with original intensities and scales. A review of intensity scales has been published by
Musson et al. (2010).
A relational database hosts the entire catalogue, including earthquake and IDP data, all relevant source
information, and links relating with the respective text documents. The database structure, with its tables
and attributes, is particularly adapted to the needs of historical IDPs and sources. – Information
regarding IDP data is stored in a table with the following IDP attributes: responsible agency,
geographical coordinates, administrative region, seismo-geographical region, location (place name) and
additional location information, lower and upper bound intensity, most probable intensity, intensity
scale, quality, felt-flag, damage-flag, sound-flag, lights-flag, ground-flag, earliest reporting date,
earthquake evidence, and comments. Each IDP is linked to the related earthquake, including date and
time, and to the related source(s) using author/reference key(s) and associated importance weight(s). –
Information regarding source documents is stored in a table with the following source attributes:
author(s) or reference, year of publication/origin, place of publication/origin, original archive, complete
quotation, comments, type, duration period (time span covered by the source), appraisal, local archive
for the source, and local archive for the transliteration (explanations further below). Bibliographical
data can thus be queried for IDPs or earthquakes alike. One IDP may be based on many sources (and
one source may be related to many IDPs). Within the project, the number of sources supporting an IDP
ranged from one to about a dozen.
For the first time, seismic histories (chronological sequences of IDP intensities) for places in
SW-Germany can be plotted, even though partly incomplete. For the time being, no attempts have been
made to draw isoseismal lines onto the IDP maps as scatter is generally quite large. Also, earthquake
magnitude and depth estimates from IDP data have not yet been determined.
At the end of the project, the catalogue contained a total number of about 10,000 earthquakes with
epicentres in SW-Germany and surroundings, the majority of which were not-felt earthquakes, i.e.
instrumentally recorded only, within the last decades. The number of IDPs per earthquake in the
catalogue ranged from zero to well over a thousand, some extending to far outside of SW-Germany.
For a historical earthquake, the number of IDPs can be considered “a sort of measure of the quality and
quantity of information a preinstrumental earthquake relies upon” (quoted from Rovida et al., 2020).
Maximum intensities of the earthquakes in the catalogue covered the range from 1 to 9 EMS, located
mainly in the regions of the Upper Rhine Graben, the Swabian Jura, and northern Switzerland.
Earthquake epicentres derived from IDP data (macroseismic epicentres) and intensities at the epicentres
9(epicentral intensities) were determined in general on an empirical basis. For completeness, additional
earthquake event data was implemented into the catalogue also, adopted from existing regional and
national catalogues of Germany, Switzerland, and France, from seismological bulletins and data
collections as well as from unpublished documents.
1.2. Guideline
One of the major tasks in the earthquake catalogue project was the evaluation of sources and the IDP
intensity assessment. For reasons of standardisation and guidance within a multidisciplinary team
working in the fields of historical science, seismology, as well as information technology, a guideline
has been required to serve as a methodological and coordinative reference and a link of common
understanding within the project (see also e.g. Moroni et al., 1996; Guidoboni & Ebel, 2009). Among
other topics, the guideline documents best practice procedures of intensity assessment based on EMS
principles under historical, seismological, and engineering aspects. It is in general conformity with the
EMS scale and has insofar also supported the proper implementation of EMS rules and the consistency
of EMS intensity assessments in the project. In part, however, it had to go beyond the EMS. Particularly
for assessment of intensity from historical accounts, the guideline also served as a detailing supplement
and extension. It has been specially designed for use in the evaluation of earthquakes in SW-Germany,
but may be helpful for macroseismic work in other regions as well.
The present article draws from the guideline (see Brüstle et al., 2021) and deals mainly with intensity
and IDP assessment related issues in the following sections:
(2.1.) basic concepts (intensity data points, quantities, distribution of effects);
(2.2.) diagnostics (suitable, weak, and unsuitable diagnostics, frightening earthquakes);
(2.3.) damage grades;
(2.4.) vulnerability classes (vulnerability in different time periods, assumptions);
(2.5.) data restrictions (poor data, missing and extrapolating information, negative reports, fake
and lost earthquakes);
(2.6.) special cases (earthquake series, earthquakes at night, during mass, ringing of church bells,
falling of roof tiles, damage to chimneys, freestanding walls, tall buildings, secondary damage);
(2.7.) substitutes for intensity;
(2.8.) uncertainties (probabilities, uncertainty notation, intermediate intensity, IDP quality,
quality and precision); and
(2.9.) other issues (completeness, consistency, subjectivity, transparency, interdisciplinarity).
References are made to the EMS scale (Grünthal, 1998) throughout this article.
2. Intensity assessment
2.1. Basic concepts
2.1.1. Intensity data points
Macroseismic intensity is considered a classification of the severity of ground shaking of an earthquake
on the basis of observed effects in a limited area; intensity is derived from “sensors”, which can be
people, objects, buildings, and nature (EMS, page 21). The core of the intensity assessment procedure
is tied to the conception of the intensity data point (abbreviated: IDP). The IDP concept aims at just one
single intensity value (“IDP intensity”) that best characterizes the severity of shaking during a particular
earthquake expressed by all its macroseismic effects in a village or town as a whole. This locality is
called “IDP place”. An IDP is identified as a data triplet of intensity, place, and date (plus time). Our
IDP intensities were conventionally assessed by expert judgement using the EMS scale. Some authors
prefer to use the term macroseismic data point (abbreviated: MDP), including also cases where
macroseismic information is available but insufficient to assign an intensity value. In this article we use
the term IDP only, with IDP being equivalent to MDP without this distinction. The information to assess
IDP intensity may come from a variety of sources. In this project, we mainly dealt with paper sources
10ranging from classical historical documents to postal questionnaires (see e.g. Cecić & Musson, 2004);
internet based sources (IMQ, etc.) were not considered.
We assigned IDP places to rural municipalities (or sub-municipalities) and urban towns (or town
districts in cases of large towns) and evaluated macroseismic effects for assessment of IDP intensity
within respective areas (i.e. within respective administrative boundaries). We did not use postal code
areas (as it is common for IMQ) because our data were related to towns, villages, and parishes. Our
IDPs are thus more related to localities than to population. The place list contained about 3,600 IDP
places inside of Baden-Württemberg. This corresponded to an average area of about 10 square
kilometres and an average number of about 3,000 people per IDP (in historical time much less people,
of course). Only rarely we had to “split an IDP” because of a too large area of the IDP place, for example
in case of a large rural municipality, or in order to separate parts of the IDP place area with grossly
different underground settings, to obtain suitably smaller areas for intensity assessment in accordance
with EMS rules (EMS, pages 26-27). As geo-referencing and geographical coordinates (latitude and
longitude in the WGS84 system) of IDPs inside of Baden-Württemberg were concerned, mainly central
points of the IDP place areas were used, as derived from data of the land surveying office of Baden-
Württemberg.
We based IDP place names on a modern gazetteer derived from official lists of commune and town
names and took care to use identical place names for historical and modern times. In principal, the most
recent name was chosen. We also were attentive to discriminate between different places of the same
or a similar name in order to avoid “name confusions”. To take an example, 19 different places named
“Hausen”, some with name extensions, had to be distinguished inside of Baden-Württemberg. Differing
names, as for example former names, name extensions, name suffixes and affixes, different language
versions, different styles of writing, of the same place were noted in a comment to the IDPs. We also
took note of extinctions or movements of places in the course of history as well as of changes in
administrative structures. Additional database information was added to the place names, with regard
to community, district, region, country, etc., for clarification and to ensure unambiguity. Both place
names and coordinates ensured the identity of IDP places.
For historical documents, it was also important to be sure that an IDP place of macroseismic observation
was not confused with the locality where the respective source document had been written or published
(to avoid “place confusions”; see also Musson, 1998b). Information about earthquake observations that
could not be associated with a place in IDP format was entered as a comment to the corresponding event
in the database, if possible, or had to be laid aside. Examples for that were occasional fragments of
information that had been mentioned in passing, as for instance, “An earthquake was felt in the duchy
of Württemberg in the year ….”.
We made a particular effort to provide a common time base for all periods in the catalogue. We
determined the date (day, month, year) and the day of the week associated with historical IDP
observations to the best of historical knowledge (see Grotefend, 2007). As for the type of calendar, we
transformed Julian calendar dates into that of the Gregorian calendar, where applicable (10 days had
to be added in the first period of calendar transformation starting 1582). Attention was paid to avoiding
the frequent “calendar date errors” and subsequent duplications of earthquakes. Ambiguities of date
also arose from an occasional uncertainty in some historical sources whether an earthquake at night
time had occurred before or after midnight (“midnight error”).
If the hour of the day, or even the minute, had been mentioned in historical reports, we transformed the
time into today’s Universal Time system (Coordinated Universal Time, abbreviated: UTC) to the best
of our knowledge. UTC time was generally set as 1 hour earlier than the corresponding local time, if
not required otherwise. Different measuring scales of time and hour styles had to be minded. Substitutes
for time of day in the historical past had been, for example, “at cock-crow”, “at sunrise”, “at vespers
time”, “at dawn”, “at midnight”, etc. Some of these expressions of time we could translate into an
approximate hour of the day, some others remained unspecified. From about mid of the 19th century
reported times have become more precise but have also become subject to further corrections (e.g.
different local time zones in Germany according to geographical longitude, later also differences due
to the alternation of wintertime and summertime, and even double summertime, etc.).
11Calendar date and time of day of historical earthquakes were derived from that of related IDPs;
reversely, date and time, as well as respective uncertainties, were crucial information for correctly
associating IDPs to respective earthquakes. Correct dating/timing helped therefore to untangle IDPs
and earthquakes within clusters. This frequently meant to separate erroneously merged or to combine
erroneously separated IDPs and earthquakes, respectively, thereby avoiding lost, duplicated, or time-
shifted earthquakes in the catalogue due to errors of date and/or time.
In strict accordance with the EMS scale rules, we deliberately did not take the amplifying or attenuating
effect of geological underground and soil conditions on seismic waves and ground shaking into account
for intensity assessment (EMS, pages 29-30). Any geological effect on intensity, whether known or
conjectured, was not corrected for but has been kept implicit in the intensity value. Hence, earthquake
hazard can be derived directly from IDP data, if so desired. Should a “geological correction” of
intensities, nonetheless, be required for some specific application, this will have to be done in the course
of a separate processing at a later stage. – The same applies to topographical effects on intensity.
Our IDP intensities are observed values as they were derived from reported observations. We did not
calculate IDP intensities for places with no observations, neither by inter- or extrapolation from other
IDP data nor by conversion from instrumental data. We also did not derive any IDP intensities from
existing macroseismic maps but we rather re-evaluated the sources. An atlas of traditional macroseismic
maps of the 19th- and 20th-century earthquakes in the region has been published by Brüstle et al. (2015),
though, for historical documentation.
Maximum intensity for a particular earthquake was, by definition, set to equal the highest IDP intensity
observed anywhere in the macroseismic field, if it had a reasonably good IDP quality, and provided that
it appeared likely that the maximum could be captured thereby. – By contrast, if epicentral intensity
could not be based on an IDP observation at the epicentre, simply if there was none, it was generally
derived from IDPs nearby in an empirical way (no fractional intensity was calculated, though; epicentral
intensities followed the same format as IDP intensities). Epicentres and epicentral intensities outside of
SW-Germany were mainly taken over from earthquake catalogues of neighbouring regions.
2.1.2. Quantities
The core concept of the EMS scale is based on the quantifiers “few”, “many”, and “most” (EMS,
pages 25-26). In principle, any macroseismic effect should be used for IDP intensity assessment
together with its quantity, i.e. together with the frequency of occurrence at the respective IDP place.
The definitions of contiguous ranges of respective percentages, as read from the graph in EMS on
page 17, are: “few” from 0% to about 15%, “many” from about 15% to about 55%, “most” from about
55% to 100%, with an overlapping range of about 10% in both transitions. In practice, though, we
interpreted “few” starting from about 1%. We assumed that “a few”, as used in the EMS scale text, can
be understood synonymously with “few”. “Only very few”, however, we interpreted in the sense of less
than few, similar to “only at isolated instances …” (which should be less than 1%, according to EMS,
page 17). If a source text had used the term “all”, we, in general, did not take this literally but translated
it into “most” of the EMS-quantification. We were aware of the frequent comprehension of “many” in
an absolute sense (meaning “a large number”), which is not the relative sense of the EMS-quantifier
percentages. For historical earthquakes, determination of quantities was particularly difficult. In
practice, we often had to guess EMS-quantities just from the context. Absolute numbers of buildings
and people living at the IDP places could, to some extent, approximately be estimated from town
pictures and population statistics.
2.1.3. Distribution of effects
Macroseismic effects are not expected to be uniform within the IDP place. Conventional IDP-intensity
assessment is, in general, based on the strongest effects observed at the respective IDP place for the
particular earthquake, i.e. on so-called maximal effects, and not on effects of average strength. Maximal
effects of an IDP usually occur just in few cases (“few” in the sense of EMS-quantifiers) within the IDP
place, whereas average effects usually occur more frequently, except e.g. for “pile-up” or saturation
effects near the upper end of the scale or scale segment (compare EMS, Figure 4-1 on page 60). Finding
maximal effects was facilitated by the circumstance that major effects were quite likely much better
12reported than minor ones. In particular, also spontaneously communicated singular observations tended
to be rather on the side of the stronger effects, as this might have been the reason for writing in the first
place. Therefore, a sample of known effects was not random but probably skewed towards the stronger
ones. We were aware, however, that IMQ data are being evaluated differently (see e.g. Tosi et al., 2015).
Maximal effects should be coherent with other effects at the same IDP place. This is why effects of
smaller strength or size should be examined as well, if it is possible. On the other hand, one has to be
aware of singular extreme effects that may have been caused by constructional defects of buildings (“an
earthquake finds out deficiencies”), geotechnical problems or locally-limited anomalous soil conditions
at the respective building sites; or may have affected tall (except for 2 EMS; see section 2.6.8.),
monumental, or exceptional buildings only (see section 2.2.2.); or may have been extraordinary for
some other reason. Singular extremes could also have been due to exaggeration or incorrectness in
reporting. The right way for us was to look for maximal effects that were not isolated extremes standing
far out from all other effects at the same place. We disregarded any singular large building-damage for
intensity assessment at a place where shaking obviously was moderate (see also EMS, pages 27-28). A
scenario where, for example, “no other damage occurred except that the church spire broke”, even
though the shaking was moderate, was reason to assign a lower intensity, if applicable, accompanied
by a comment describing the singularity. Notably for historical earthquakes, however, it often remained
a discretionary decision whether the report of an individual case of large damage could be included or
should be downgraded or disregarded for intensity assessment (see also e.g. Hough, 2013).
It has been postulated that, in an ideal case, the occurrence-probability distribution of building damage
is, for a given IDP place, intensity, and vulnerability class, an almost normally (Gaussian like) shaped
curve about the mean damage grade, except for the “pile-up” effect near the lower and upper bound of
damage (with reference to EMS, Figure 4-1 on page 60, and pages 58-60). Intensity is derived from the
highest, as well as possibly from the second-highest, damage grade observed for a particular
vulnerability class with regard to EMS-quantities (EMS, pages 17-20), and excluding singular extremes
(as above).
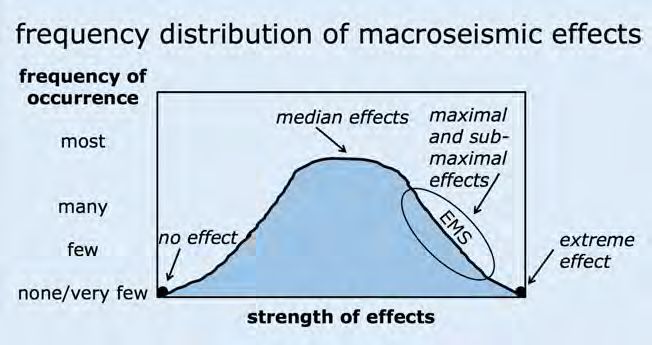
Similarly, it can be conjectured that, to some extent and for limited parts of the intensity scale, also the
strength of macroseismic effects on ordinary objects and on people may follow a quasi-normal
occurrence-probability distribution, ranging from minimal to median to maximal effects that are
observed for a particular IDP (except near both ends of the scale or scale segment because of “pile-up”
or saturation, accordingly); an idealized example distribution of the expected occurrence frequency of
the strength of macroseismic effects for an IDP, with regard to EMS-quantities, is schematically
sketched in Figure 1.
Figure 1. Sketched example of expected occurrence-frequency distribution of the strength of
macroseismic effects for an IDP (within the IDP place for the particular earthquake). IDP intensity (EMS)
is assessed from effects at the upper tail of the distribution curve. Further explanation is given in the text.
13Again, IDP intensity is assessed from the maximal, as well as possibly from the sub-maximal, effects
at the upper tail of the distribution curve, taking respective quantities into account. Obviously, given
this distribution, an IDP intensity assessment based on the effects that occur with the highest frequency
(sometimes referred to as being the “representative” ones) would quite likely be too low, and an
assessment based on effects at a randomly selected single site within the area of the IDP place would
hardly be relevant. In practice, a detailed distribution can be obtained in cases of high-quality IDP data
sets only.
2.2. Diagnostics
2.2.1. Suitable diagnostics
What are suitable sensors and diagnostics for assessment of intensity (EMS, pages 21-22)? All features
that by and large linearly scale with intensity are suitable to be used as indicators (“diagnostics”), at
least in parts of the scale. Up to intensity 6 EMS, one of the best type of diagnostics simply is the
percentage of people (the “sensors”) that have felt the earthquake. Situations where observers are
indoors, outdoors, or sleeping are differentiated by the EMS scale (see, however, Sbarra et al., 2014).
For intensities of 6 EMS and higher, buildings are generally the best sensors, and building damage is
the best diagnostic if taken as the quantities of buildings of a particular vulnerability class that suffered
particular damage grades at the respective IDP place. Observations and diagnostics are never complete,
though. Hence, the best way of intensity assessment is that of a pattern matching between the
observations (i.e. “the data”) and the scale (i.e. “the model”) and thus determine the best fit in each case
(EMS, pages 27-28; Musson, 1998a; and others).
2.2.2. Weak diagnostics
Any building damage that is not directly caused by seismic ground shaking should according to the
EMS scale not be considered for intensity assessment (EMS, page 24). Nevertheless, in cases of sparse
information we did consider some other earthquake-related effects, described in the following, offering
weak diagnostics.
Weak diagnostics, in the aforementioned sense, may have been derived from building damage that was
not due to ground shaking but due to dislocation of building foundation because of non-reversible, i.e.
permanent, earthquake related ground movement (e.g. ground dislocation, subsidence, spreading,
tilting, sliding, etc.). We noted earthquake-induced permanent changes on the ground surface in any
case, at least in form of a “ground-flag” to the IDP. Likewise, weak diagnostics could have come from
geotechnical damage resulting from such permanent ground movement (e.g. base failure, breaking of
subsurface pipes, cracks in embankments and pavements, etc.).
Furthermore, we regarded some effects in the natural environment related to the earthquake as
potentially representing weak diagnostics. Such effects in nature were, for example, hydrological
anomalies (changes of springs, wells, ground water, etc.), anomalous waves in lakes or basins (seiches,
etc.), cracks and fissures in the ground, liquefaction, slope instabilities (landslides, rock falls, etc.),
shaking of trees and bushes, etc. (see EMS, pages 95-98; Vogt et al., 1994; and others). Effects in the
natural environment, however, are more favourably measured on the Environmental Seismic Intensity
Scale (abbreviated: ESI; e.g. Michetti et al., 2007) and were, for the intensity range below 9 EMS and
in presence of “ordinary diagnostics”, not regarded essential for assessment of intensity in this project.
With care and restrictions, we did also use some reports of damage to exceptional buildings (towers,
freestanding walls, fortifications, bridges, dams, etc.) and to monumental buildings (palaces, castles,
large churches such as cathedrals, halls, etc.) as constituting weak diagnostics, even though these are
not buildings listed for standard EMS intensity assessment (EMS, pages 29 and 53, etc.). We were
particularly aware of the danger to overestimate intensity from this sort of damage (see e.g. Graziani
et al., 2015). Damage to monumental buildings, on the other hand, was the sort of damage preferably
reported in historical times. In view of the generally sparse information from historical earthquakes, we
could not completely exclude it from the assessments; we made exceptions if it was accompanied by
comparatively coherent other observations. If it was the only information for an IDP, however, a
favourite choice was to merely assign a “damage-flag”. A particular feature that had to be paid attention
14to is that damage to monumental buildings to a greater extent results from a lower frequency band of
ground motion (see e.g. Camelbeeck et al., 2014). If churches and halls were just of small size, we
generally did not classify them as monumental buildings. Caution was demanded, though, if damage at
several places in the region had exclusively been reported from church towers, for example.
The twisting and rotation of objects (for example gravestones, monuments, etc.) was considered typical
for earthquake damage scenarios on the one hand, but proved less suitable for intensity assessment on
the other (e.g. Lombardi et al., 2016). The same held for falling of roof tiles. – Falling of elements of
parapets, claddings, architectural decorations (pillars, statues, figures, etc.) from the façade or from
the top of buildings was even more difficult to evaluate than that of roof tiles, as the building settings
were more divers. A civil engineering study on this topic has been published e.g. by Rudisch et al.
(2016). A notable example in the catalogue is the incident in the November 16, 1911, earthquake with
epicentre at Albstadt, SW-Germany, where the large stone monument of the imperial eagle was thrown
down from the top of the main post office at Konstanz, SW-Germany, in about 60 km epicentral distance
(IDP intensity at Konstanz was assessed as 7 EMS from the total of observations there).
Some of the aforementioned diagnostics are discussed as “special cases” in section 2.6. We tried, with
caution, to make use of weak diagnostics in complementing other observations or, at least, for assigning
a lower limit of intensity. A last resort to parameterize weak information was just using a “flag”
substituting intensity (see section 2.7.).
2.2.3. Frightening earthquakes
The personal judgement of a witness or author whether an earthquake had been experienced as slight,
moderate, or strong shaking turned out to be a weak diagnostic as well, even though it directly points
to the meaning of intensity. The reason was that, in our opinion, such rating was per se rather subjective
and, in general, inconsistently used. It sometimes also seemed to have been intrinsically linked to the
individual sensation of fright.
In the same way, we found the extent to which earthquakes had frightened people in historical times to
be rather subjective, and hence rather unreliable for assessing intensity (accompanying reports of how
many people had been running outdoors were seen to be more objective, though).
When earthquakes in SW-Germany were mentioned in older historical sources, the incidents often
seemed to have been termed “frightening” out of habit. A common way of speaking about earthquakes
was that of “ein schröckliches Erdbeben”, meaning “a terrible earthquake”. Earthquakes apparently
scared people in general, not necessarily because shaking was strong but merely because even a
moderate one was a rare and disquieting experience in SW-Germany. Various historical theories “from
Aristotele to Kant” (Oeser, 1992) about the origin of earthquakes, searching for natural causes inside
the earth instead of a religious explanation as an “act of God”, could not relieve the general fear.
Particularly before the Age of Enlightenment, an earthquake was frequently seen as a supernatural
event, a miraculous sign (prodigium, “Wunderzeichen”), as God’s warning (“Menetekel”), anger, or
punishment, and eventually as a forerunner of something worse (see e.g. Gisler, 2003; Schwarz-Zanetti
& Fäh, 2011; Hammerl, 2017; and many others). The contemporaneous writer himself may have had a
mindset, belief, or even intention that favoured the report of “fear and fright”. The frightening effect
actually related to intensity was hard to assess for us, as frightening, historically, seemed to have been
more dependent on mental, cultural, social, and religious factors than on earthquake intensity; hence,
we used it, if at all, as a weak diagnostic only.
Similarly, we could hardly interpret the reported duration of earthquake shaking in terms of earthquake
parameters, since shaking durations in historical times often seemed to have been exaggerated. Reports
ranged from the “duration of a Lord’s prayer” to “several minutes”. Eventually, an earthquake was even
said to have “lasted for hours”, hence probably was confused with the following aftershocks.
We also found that the behaviour of animals during earthquake shaking could not easily be related to
intensity. Frequently, domestic animals were reported to have shown frightened reactions at lower
intensities than is suggested by the EMS scale. Hence, we disregarded the EMS-rating of animal
reactions.
152.2.4. Unsuitable diagnostics
A vast number of meteorological and astronomical observations during earthquakes have been reported
in historical documents, such as wind, precipitation, air pressure, temperature, phases of the moon, fall
of meteorites, and several other. We disregarded all these for intensity assessment as there were no
proven physical relations to earthquakes and intensity. Yet, we usually noted the observations in a
comment, as well as concurrent events of other kind.
Observations of earthquake sounds and earthquake lights we did not use for intensity assessment either
(the latter are poorly understood anyway) but rather described these acoustical and visual effects in a
comment to the respective IDP and attributed a “sound-flag” and a “lights-flag”, if applicable.
In historical sources we found reports of observations of visibly swinging walls or towers; observations
of this kind could, for the earthquakes evaluated in this project, not justify high intensities on its own.
We rather suspected that such observations could have been caused by an effect of motion of the
observers eyes, if they were not just pure imaginations triggered by excitement. In a similar way, we
decided in cases of reports of e.g. “waves seen on firm ground”.
The number of human fatalities and injured people in an earthquake was, albeit correlated in general,
regarded not to be related to intensity in a way to allow assessment of intensity without further
constraints (see e.g. Coburn et al., 1992). An example taken from the region is the 1356 Basel,
Switzerland, earthquake (e.g. Fäh et al., 2009).
Finally, we excluded all “secondary damage” effects (subsequent damage following the primary one,
see section 2.6.9.) from intensity assessment.
2.3. Damage grades
For intensity assessment in the damage part of the EMS scale (i.e. from 5 EMS upwards) earthquake
damage to buildings is considered according to damage grades (see EMS, pages 24-25). The EMS-
classification of damage grades ranges from grade 1 (lowest damage grade) to 5 (highest damage grade).
In simplified terms, damage grade 1 is for negligible to slight damage, grade 2 for moderate damage,
grade 3 for substantial to heavy damage, grade 4 for very heavy damage, and grade 5 for destruction; a
distinction is made between structural and non-structural damage (EMS, pages 15-16). For the relevant
provisions of damage grades we refer to EMS.
In principal, the damage grade may change from one house to the next at the same IDP place, even with
unchanged vulnerability class; thus, damage to one randomly selected house is not decisive for IDP
intensity (see section 2.1.3.).
We were aware of the problem of pre-damaged or weakened buildings. Damage from previous
earthquakes had to be excluded as far as possible (see section 2.6.1. about earthquake series). We also
attempted to distinguish between shaking as the relevant cause for building damage on the one hand
and shaking that constitutes a kind of “triggering effect” for building damage, whereby deficits in
construction, material, or maintenance were likely to actually be the relevant causes, on the other hand.
These problems are addressed also in the context of building vulnerability.
Determination of damage grades from historical sources was particularly difficult, as damage
descriptions were rarely detailed to the needs of the EMS scale and almost no pictures were available.
Therefore, the assessment of damage depended on text and wording. The vocabulary had been different,
though; hence, the meaning of terms as “damaged”, “destroyed”, “ruined”, “collapsed”, etc., as well as
“much”, “large”, “great”, “terrible”, etc., or even respective superlatives, in historical documents was
not necessarily the same as in modern times or in the EMS scale text. For assessment of damage grades
from historical accounts, historical criticism had to be applied and inferences had to be made from the
general context (see e.g. Musson, 1998b). We took care to avoid any overestimation of intensity due to
reports of singular damage, suspected exaggerations or generalisations. A reliable intensity value could
be assigned only if historical sources included sufficiently detailed information about the damage.
In general, an error in building damage being wrong by one grade may result in an error of intensity of
one degree of the EMS scale. We nonetheless felt that, in comparison of sources, IDPs, and earthquakes
16over several centuries, our assessed intensities were not grossly over- or underestimated due to
systematic errors in damage grades.
2.4. Vulnerability classes
2.4.1. General remarks
For intensity assessment in the damage part of the EMS scale (i.e. from 5 EMS upwards) earthquake
vulnerability of buildings is considered according to vulnerability classes (see EMS, pages 31-49). The
EMS-classification of building vulnerability comprises four main groups: masonry, reinforced concrete
(abbreviated: RC; possibly with some level of earthquake-resistant design, abbreviated: ERD), steel,
and wood; the structures (buildings) are differentiated into six vulnerability classes ranging
alphabetically from class A (highest vulnerability) to class F (lowest vulnerability). According to EMS,
in simplified terms, class A is the most likely vulnerability class for adobe (earth brick), rubble stone,
and fieldstone masonry; class B for simple stone masonry and unreinforced masonry with manufactured
stone units; class C for massive stone masonry, unreinforced masonry with RC floors, and RC frame /
RC walls without ERD; class D for reinforced or confined masonry, RC frame / RC walls with
moderate level of ERD, and timber structures; and class E for RC frame / RC walls with high level of
ERD and steel structures (with reference to EMS, page 14). Strengths and weaknesses of a building
may change its vulnerability class within specific ranges (EMS, pages 14 and 47-48). The lower the
vulnerability the higher is the earthquake resistance of the buildings (EMS, pages 33-34). Class F is for
structures of the highest earthquake resistance due to the incorporated design principles (EMS, page 32).
For the relevant provisions of vulnerability classes we refer to EMS.
Because of lack of information we mostly could accomplish the determination of vulnerability classes,
particularly for historical earthquakes, in a general and presumptive way only. We distinguished
different time periods.
2.4.2. Vulnerability in different time periods
Tyagunov et al. (2006) have given an overview over vulnerability classes of the recent residential
building stock in Germany. Based on this publication, we estimated for the second half of the
20th century that vulnerabilities of residential buildings in SW-Germany were essentially represented
by the vulnerability classes A to D and were, generalized, predominantly of class B and C, with a smaller
fraction in class D, and a very small one in class A. Notably, in communities up to 3,000 inhabitants
most buildings were classed as B, whereas in towns starting from 30,000 inhabitants most were classed
as C (Tyagunov et al., 2006). As these findings provide just a general vulnerability composition, they
could only be applied in a generalised way. Beginning with this most recent time period, we developed
a tentative picture of building vulnerabilities in earlier times.
For the first half of the 20th century, we estimated that the general distribution of vulnerability classes
from the second half of the century, as described above, was shifted a little bit towards higher
vulnerabilities, such as that there were fewer C- and D-class buildings and in turn more of class B. The
reason for this was seen, among others, in fewer RC buildings on the whole and, particularly also, fewer
RC floors in masonry buildings and more wooden floors accordingly.
For the period from the end of the 19th century backwards in time to about the 16th century, we found
very little information about historical building techniques and architectural history in SW-Germany
from that earthquake resistance could be derived. Moreover, the EMS vulnerability classification is not
specially adapted for historical buildings (see, however, EMS, page 51). On the whole, we regarded the
main part of the residential building stock in SW-Germany for this time period to have been of masonry
type and half-timbered structures, respectively, to a smaller part also timber structures; we tentatively
estimated that the general distribution of vulnerability classes was again shifted to higher vulnerabilities
as compared to the first half of the 20th century, but again not very much so. If going back in history,
we assumed that the portion of A-class buildings was, on the whole, increasingly larger, partly because
of lower structural engineering standards and poorer economic conditions. At times, high vulnerability
could also have been related to wars and crises, for example. In general, however, the sustainable
material that had commonly been used for buildings in SW-Germany and the good workmanship at
17large still spoke in favour of a majority being of vulnerability lower than class A. Houses had been built
to resist wind and snow, particularly also in the countryside and in the low mountain ranges, which
implied a basic resistance against earthquakes as well. A robust design, high-quality building materials
available nearby (mainly brick, stone, and wood), and a good state of maintenance and repair had been
sought, as the quality of the houses reflected the reputation of the people and the houses ought to be
used by subsequent generations as well. The number of storeys had generally been low, the openings
small, and the ground plans and structures fairly regular. – Compound constructions using wooden
framework (half-timbered structures, “Fachwerk”), with infill panels of stone, brick, wattle and daub,
or other, had widely been in use. A collection of almost 700 painted “town views” in the duchy of
Württemberg was prepared by Kieser in the years 1681 to 1686 (Kieser, 1681-1686). The “Kieser atlas”
pictures showed that half-timbered masonry constructions had at that time dominated for residential
houses in towns and villages of the region. The atlas also showed the size of each settlement. We
assumed a favourable performance of half-timbered buildings in earthquakes, which, however,
extended primarily to the bearing wooden structure and therefore rather applied to high damage grades
(heavy structural damage or collapse) but not to low damage grades (related to cracks in masonry infill,
cladding, plaster, etc.). See also EMS, pages 48-49, as well as pages 40-42.
The considerations above led us to assume that, for the purpose of this project, the majority of residential
buildings in SW-Germany in the time period from about the 16th to the end of the 19th century can be
estimated to be of vulnerability class B, with minor parts in class A and class C, and some minor portion
even in class D. A differentiation between urban and rural areas was considered in individual cases if
possible. In conclusion, we were aware that our picture of historical building vulnerability is generalized
and hypothetical. Much more research is necessary to better determine building vulnerability in the
historical time period.
For the medieval time period (the Middle Ages), building vulnerabilities have, in a general way, not
been evaluated in this project.
2.4.3. Vulnerability assumptions
In practice, building damage should be linked to the actual vulnerability of the buildings in question. If
the vulnerability of the damaged buildings was known, we could properly take it into account. If it was
not known, as usually was the case in the historical time period, and if no better estimate could be made,
we assumed a notional vulnerability class B for intensity assessment of residential buildings in
SW-Germany for all time periods after the Middle Ages (see also EMS, pages 48-51). If there were
some indications to one or the other side, we rather considered notional “intermediate classes” B-C in
the 20th century and A-B in the historical time range on a case-by-case basis. For the medieval time, in
particular, we decided on vulnerability classes individually. Non-residential buildings had to be treated
separately and also case-by-case.
If buildings are pre-damaged or weakened, for instance due to preceding strong earthquakes, or due to
acts of war, bad state of maintenance and repair, or simply age and dilapidation, it can be seen as a
conditional increase of building vulnerability with regard to the original vulnerability. We tried to
handle these cases individually (see also sections 2.3. and 2.6.1.).
We were aware that damaging earthquakes affect the higher-vulnerability buildings in a stronger way
than the lower ones (see also EMS, pages 47-48 and 51). Thus, for IDP cases of a small number of
damaged houses at a particular place and without knowledge of their actual vulnerabilities, it could be
suspected that the damaged houses were just those with the highest vulnerability locally (hence e.g.
rather class A than B or better). As, on the other hand, a few ordinary houses of vulnerability class A,
respectively also houses in poor condition, had quite likely not been in the focus of historical reports,
we did not take this consideration as a reason to a priori change the general rule. For the modern time
period, on the other hand, vulnerabilities of damaged buildings were much better known, though.
In general, an error in building vulnerability being wrong by one class may result in an error of intensity
of one degree of the EMS scale. The dependence of intensity on vulnerability class is of the same order
as on damage grade. Since, in general, it was easier to determine damage grades and quantities than
vulnerability classes, vulnerability was seen as the least known and hence most delicate parameter in
18the assessments. We nonetheless felt that, applying the assumptions above, our assessed intensities were
best estimates, for the time being, also in regard to uncertainties of vulnerability class.
2.5. Data restrictions
2.5.1. Poor data
Documentary sources reporting about historical earthquakes tended to be brief and fragmentary, and,
with respect to the seismological information contained, frequently even sparse, vague, ambiguous, and
contradictory. Obviously, reports about earthquakes were in historical times rarely written for
seismological purposes but rather for social ones; hence, the seismologically useful information content
may have been small even in a lengthy treatise. The choice of what was important to be written down
in case of earthquakes changed during the centuries. A different mentality was reason for a different
kind of awareness and also a different style of writing (e.g. Guidoboni, 2000). The purpose of writing
may even have been anything else but reporting facts. The “Zeitgeist” has changed then in the
19th century when many reports began to consider seismological aspects out of their own interest.
Particularly for historical accounts, quantities, damage grades, and vulnerability classes, as specified in
the EMS, had mostly to be inferred from the context or conjectured by way of comparison. We were
very cautious in dealing with IDP intensity assessments based on singular observations, for example,
if we only knew a single person’s perception or a single building’s damage description (see also EMS,
page 28). For historical earthquakes, we could, nevertheless, not completely omit all poor-data IDP
cases. We made exceptions if circumstances suggested that a singular observation reported can be
understood as an example standing for similar perceptions or comparable damage at the same place as
well. Particularly, the damage to the village church could have been mentioned exemplifying damage
in the village as a whole. Whether this had probably been the case or not, we had to judge from the
context. Ultimately, we tried to assess IDP intensities from poor information also, but rated them as
being uncertain (see section 2.8.4. about IDP quality).
Such exceptions were justified, however, just to a certain limit. In cases of very poor information, we
generally did not assign an intensity value but a “felt-flag” or a “damage-flag”, if possible (see section
2.7. about substitutes for intensity). We avoided any inappropriate parameterisation of vague historical
information but stored such information in textual form.
If, moreover, an earthquake was documented by one single and poor-data IDP only, the situation was
even more precarious for the question of certainty of event type (“has it actually been an earthquake?”),
let alone for the question of epicentral location and intensity. All such “one-IDP-events” in historical
times are encumbered with uncertainty (e.g. Musson, 1998b).
2.5.2. Missing information
For the lower part of the scale (below 6 EMS), intensity is assessed mainly from the severity of
earthquake shaking as perceived by people; for the upper part, intensity is to be based on damage. We
generally assigned IDP intensity 6 EMS or higher only if building damage had occurred; this applied
for modern-time earthquakes in any case. A small exception to this rule were some historical IDPs
assessed as 6 EMS where shaking believably had been very strong but damage was not mentioned (“no
evidence”). In historical context it seemed possible, though, that strong shaking as such and its various
effects on people and objects were seen to be more relevant for reporting than a few detached roof tiles
or cracks in ordinary houses, for example. The latter may have been unknown to the writer also.
We generally tried to avoid concluding from any missing information that something, we would like to
know but was not mentioned in the sources, actually had not happened (see also EMS, pages 28 and 52;
Musson, 1998b; and others). Especially in the historical past, there may have been many reasons for
omitted information, missing reports, or just gaps in knowledge. In some cases, however, no mention
of damage from authoritative sources could be used to, at least, disprove a high IDP intensity.
19You can also read