BETA SCOPING STUDY REVEALS POTENTIAL SECOND LOW COST GOLD MINE
←
→
Page content transcription
If your browser does not render page correctly, please read the page content below
16 May 2017

Australian Securities Exchange
Level 5, 20 Bridge Street
SYDNEY NSW 2000
                                      ASX ANNOUNCEMENT

  BETA SCOPING STUDY REVEALS POTENTIAL SECOND LOW COST GOLD MINE

The Board of Stonewall Resources Limited (ASX: SWJ) (“Stonewall or Company”) is pleased to
announce the completion of the second part (Beta Mine) of the Scoping Study into the Company’s
combined Rietfontein and Beta staged hard‐rock mine development. As with the first part of the Study
that focused initially on Rietfontein, this Study was also delivered by international mining and project
consultants Bara Consulting, based in Johannesburg, South Africa. The updated Scoping Study was
conducted in accordance with the JORC (2012) Reporting Code and other Industry guidelines.
The first part of the Scoping Study focused on an initial low capital and operating cost development
approach at the fully permitted Rietfontein mine (announced to the ASX on 28 February, 2017). Ore is
to be processed at the TGME processing facility at Pilgrims Rest (owned by Stonewall) following planned
upgrade and refurbishment. Highlights of this previous study included potential C1 operating costs of
US$417/ounce with a production profile of up to 60,000 ozpa.
It is a central strategy of Stonewall to develop mining operations with low capital cost and high
operating margins and Beta fits this requirement.
This recent Beta scoping work is also developed and modelled on a staged basis where the capital
cost of the second stage can be funded internally through cash flow from Rietfontein. The study
indicates a combined Rietfontein and Beta development can produce up to 100kozpa from both
mines, with low capital requirements (US$29M peak drawdown). A base‐case pre‐tax NPV of
US$166M (A$220M), and overall C1 cost of US$495/oz is quoted. It should be noted that during this
Beta study work, the Rietfontein development was further reviewed and the initial peak drawdown has
been reduced from US$31M to the current figure.
The study is considered to be at Scoping Level and includes some inferred resources in the preliminary
mine schedule (59% inferred, 41% indicated JORC 2012 on a weighted average basis). Some aspects of
the study are at a higher level of confidence than that typically included in a scoping study, including
detailed monthly mine scheduling and planning, combined with comprehensive cost estimates from
underground mining contractors. As announced to the ASX on 4 May 2017, preliminary feasibility work
into this shallow adit‐entry and low cost mining project is underway, with drilling planned to commence
at Rietfontein in coming weeks.
The Company intends to commence mine construction and plant refurbishment in early 2018 (subject
to available funding), with the aim of first ore being delivered to the plant by the end of 2018.
Managing Director Rob Thomson said: “Both Rietfontein and Beta are designed to underpin the
company’s growth plans, which we believe will be complemented by other nearby low‐cost ore sources
also being investigated.
The low capital and low operating cost of the TGME project means the economics appear very robust,
and we are confident as the feasibility work progresses, the project will attract development funding.
We plan to commence drilling at Rietfontein to upgrade the resource in coming weeks and remain
focused on bringing Rietfontein into production in 2018. The fully permitted, high grade Rietfontein
project is expected to underpin our medium term development strategy and this will be supported by the
Beta development.”

                                                                                                       1
Cautionary Statement
The Scoping Study referred to in this announcement is based on low level technical and economic assessment,
insufficient to support the estimation of ore reserves. There is no assurance that the intended development
referred to will proceed as described, and will rely on further studies at the Pre‐Feasibility and Feasibility Study
levels, and access to future funding to implement.
Stonewall believes it has reasonable grounds under ASIC Information Sheet 214 to report the results of the
Scoping Study. The mine plan referred to in the quoted NPV contains 41% Indicated Mineral Resources and
59% Inferred (ASX releases dated 7/2/17 and 28/3/17 for Mineral Resource Statements). The Rietfontein &
Beta mines have been previously operated to extract gold and have existing underground development and
some infrastructure in place. The company intends to conduct further drilling to upgrade the Mineral
Resources incorporated in the mine plan to at least Indicated Mineral Resource status as required to establish
reserves under JORC (2012) as well as test for strike and depth extensions. The results of the drilling will be
used to progress further project studies to enable finance to be arranged to execute the mine plan. At this
stage there is no guarantee that funding will be available, and investors are to be aware of any potential
dilution of existing issued capital.
The production targets and forward looking statements referred to are based on information available to the
company at the time of release, and should not be solely relied upon by investors when making investment
decisions. SWJ cautions that mining and exploration are high risk, and subject to change based on new
information or interpretation, commodity prices or foreign exchange rates. Actual results may differ materially
from the results or production targets contained in this release. Further evaluation and appropriate studies
relating to geology, mining and economics are required to increase the level of confidence prior to a decision to
conduct mining being made.
The estimated Mineral Resources quoted in this release have been prepared by Competent Persons as required
under the JORC Code (2012). Material assumptions and other important information are contained in this
release.
Competent Persons Statement
The information in this report relating to Mineral Resources is based on information compiled by:
Rietfontein Mineral Resource ‐ by Daniel van Heerden, B.Eng. (Mining), M.Com.(Business
Administration) who is employed as a Director and as Principal Mining Engineer by Minxcon
Projects (Pty) Ltd.
Beta Mineral Resource – by Mr Uwe Engelmann (BSc (Zoo. & Bot.), BSc Hons (Geol.), Pr.Sci.Nat.
No. 400058/08, MGSSA), a director of Minxcon (Pty) Ltd.
The original reports titled “New High Grade Resource (JORC 2012) at Rietfontein and Significant
Resource Upgrade” and “Beta Resource Upgrade” were dated 7 February 2017 and 28 March 2017
respectively and released to Australian Securities Exchange on those dates.
The Company confirms that –
It is not aware of any new information or data that materially affects the information included
in the Australian Securities Exchange announcements; and
All material assumptions and technical parameters underpinning the estimates in the Australian
Securities Exchange announcements continue to apply and have not materially changed.
2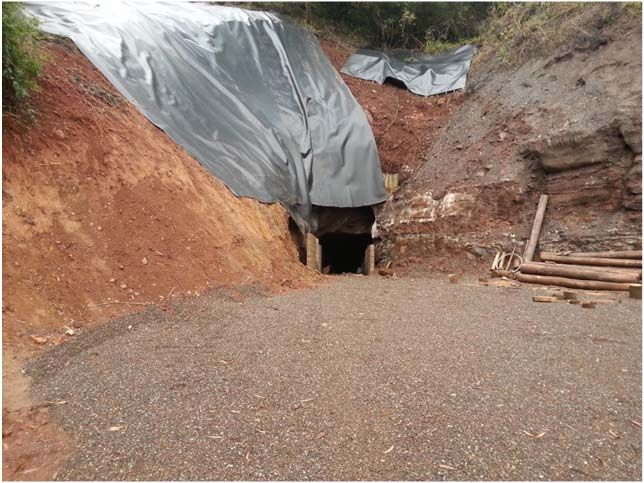
OVERVIEW
Stonewall Resources Limited is pleased to announce the results of a Scoping Study for its combined
Rietfontein and Beta Projects, part of the Company’s TGME gold project.
The TGME project is situated in the historical gold mining areas of Pilgrims Rest and Sabie, located 370
km east of Johannesburg and 95 km north of Nelspruit, the capital city of Mpumalanga Province in
South Africa (Figure 1 & 2). The area has produced over 7Moz @ 10 g/t Au (Figure 3) historically.
During this study the Rietfontein mining schedule was modified (compared to the first results) to reflect
continuing discussions with South African mining contractors, including improved development rates by
running a 24 hour per day operation as well as current contractor commercial rates. Beta development
is currently planned to be funded from cashflow in Year 2, so as to maintain the low‐capital nature of
the development.
Rietfontein and Beta are core components of the Company’s extensive Mineral Resource base
(Measured, Indicated and Inferred Mineral Resources) of 26.6 Mt @ 4.34 g/t for 3.72Moz (115.7
tonnes) of gold last updated on the ASX 28 March, 2017, and included as an Appendix to this release.
The combined Rietfontein and Beta development sees production in excess of 100kozpa, at low cash
cost.
It is the intention of the Company to further develop other high grade and low capital cost mines within
the portfolio in coming years through the application of modern mining and processing techniques.

Table 1: Combined Rietfontein & Beta Staged Development
                     Parameter                                          Detail
                                                 Rietfontein: 2.55Mt @ 11g/t (905Koz, 26%
                                                 indicated, 74% inferred) – Table A1, p22
 Mineral Resources
                                                 Beta: 4.72 @ 6.6g/t Au (1.0Moz, 48% indicated,
                                                 52% inferred)‐ Table A2, p22
 Production Schedule (Milled tonnes)             3.3Mt @ 7.7g/t Au for 817koz contained
 Mine Life                                       9 yrs including construction (7.5 yrs full
                                                 production)
 Processing Rate (design rate)                   440ktpa
 Recovery (Life of Mine)                         86% anticipated recovery for Rietfontein, 80% for
                                                 Beta (680koz LOM recovered, 83% overall
                                                 recovery)
 Capital Cost                                    Total US$64.9m (US$29m peak drawdown in Year
                                                 1, Rietfontein, remainder cashflow funded)
 Operating Costs                                 US$ 101/t LOM average operating cost
                                                 (US$495/oz C1 recovered)
 Project NPV (10% DCF), before tax (IRR)         US$166M (IRR 81%)
                                                 Sustaining Capital of approximately US$10Mpa
 LOM Capital Costs                               over the Life of Mine, and AISC of US$624/oz
                                                 including royalties, excluding initial capital

                                                                                                        3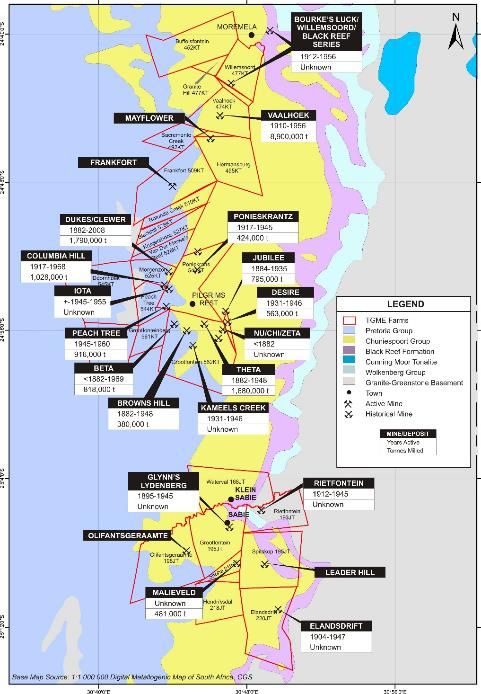
Figure 1) Location of Sabie‐Pilgrims Rest Goldfield

Figure 2) Location of Beta and Rietfontein within the TGME project area

                                                                          4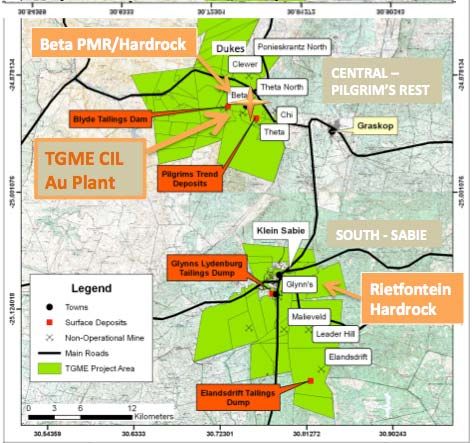
Northern & Central
        (Pilgrims Rest)
        1872 ‐ 1972 : ≈ 4.27 Moz
        2005 ‐ 2014 : ≈ 0.23 Moz

        Southern (Sabie)
        1872 – 1972 : >2.5 Moz

                       Figure 3) Map of historical mine production in the TGME project area

COMBINED RIETFONTEIN AND BETA DEVELOPMENT
Bara Consulting was engaged to update the Rietfontein Scoping Study to include the development of the
Beta Resource. Assuming start‐up (construction) of Rietfontein in early 2018, it is expected that the Beta
development would commence 18 months later, and be funded by cashflow from Rietfontein. The peak
funding requirement of US$29m (excluding working capital) for the staged development (being peak
Rietfontein funding) compares to the estimate of US$64.9m for the concurrent construction of both
projects (Refer to Table 5, p15).
The new Rietfontein schedule that has been developed, allows for an improved ramp‐up period through
mechanised development, and changing shifts from an 11/14 roster to a 30 day, 3 shift per day system.
Mining costs have been updated and confirmed, based on discussions with in‐country contractors and
checked against in‐country peers, however these have not changed materially from the last Scoping Study
release (28/2/2017).
The main waste development drives have been increased from 3.5 x 3.5m wide to 4.0m x 4.0m, to enable
larger trucks underground with increased haulage capacity. Whilst this combined development makes
sense, it is the focus of the Company to add additional projects to the development plan for TGME, several
of which are currently under investigation, and expected to be articulated to the market in 2H’CY’17.

                                                                                                         5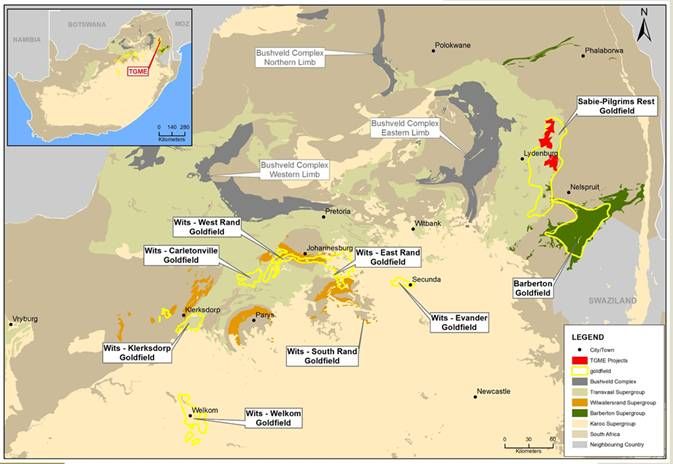
Rietfontein Production Schedule
             500,000                                                                                                       20.0

             400,000
                                                                                                                           15.0

                                                                                                                                          RoM grade (g/t)
             300,000
  Tonnes

                                                                                                                           10.0
             200,000

                                                                                                                           5.0
             100,000

                       ‐                                                                                                   0.0
                               Year 1   Year 2    Year 3    Year 4      Year 5      Year 6    Year 7    Year 8   Year 9
                                             ROM Tonnage             Waste Tonnes            Mined Gold (g/t)

                                                     Beta Production Schedule
                    400,000                                                                                               12.0
                    350,000
                                                                                                                          10.0
                    300,000

                                                                                                                                 RoM grade (g/t)
                                                                                                                          8.0
                    250,000
           Tonnes

                    200,000                                                                                               6.0
                    150,000
                                                                                                                          4.0
                    100,000
                                                                                                                          2.0
                     50,000
                           0                                                                                              0.0
                               Year 1 Year 2 Year 3 Year 4 Year 5 Year 6 Year 7 Year 8 Year 9 Year 10 Year 11 Year 12

                                             ROM Tonnage             Waste Tonnes            Mined Gold (g/t)

                                   Figures 4 & 5) Revised Rietfontein & Beta Underground Production Schedules
The advantage of a combined development scenario mainly revolves around the de‐risking of the operation
in the event of problems with either of the mines. The increased cash flow will also allow for further
development opportunities to be accelerated within the Company’s vast portfolio of assets.
An additional benefit is the Company will have an operating presence in the central and southern areas of
the tenement holdings area which will assist in reducing the time to further develop other adjacent assets.

                                                                                                                                                            6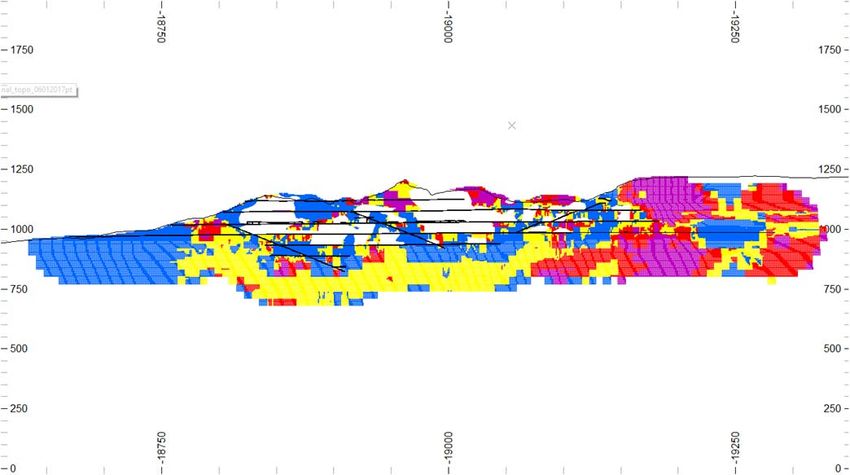
TGME Processing Ramp‐up
40,000 18.00
35,000 16.00
30,000 14.00
RoM grade (g/t)
12.00
25,000
Tonnes
10.00
20,000
8.00
15,000
6.00
10,000 4.00
5,000 2.00
‐ ‐
Jan‐19
Mar‐19
May‐19
Jul‐19
Sep‐19
Nov‐19
Jan‐20
Mar‐20
May‐20
Jul‐20
Sep‐20
Nov‐20
Jan‐21
Mar‐21
May‐21
Jul‐21
Sep‐21
Nov‐21
Milled tonnes Recoved oz Milled grade
Figure 6) TGME plant ramp‐up schedule (assuming commence 1 January, 2018)
Gold Production Forecast: Combined TGME Development
120 15.0
100 13.0
ROM grade (g/t Au)
80 11.0
Kozpa (Au)
60 9.0
40 7.0
20 5.0
0 3.0
CY'18 CY'19 CY'20 CY'21 CY'22 CY'23 CY'24 CY'25 CY'26 CY'27 CY'29
Rietfontein (Kozpa) Beta (Kozpa) Gold Grade (g/t)
Figure 7) Combined potential production with Beta start delayed
7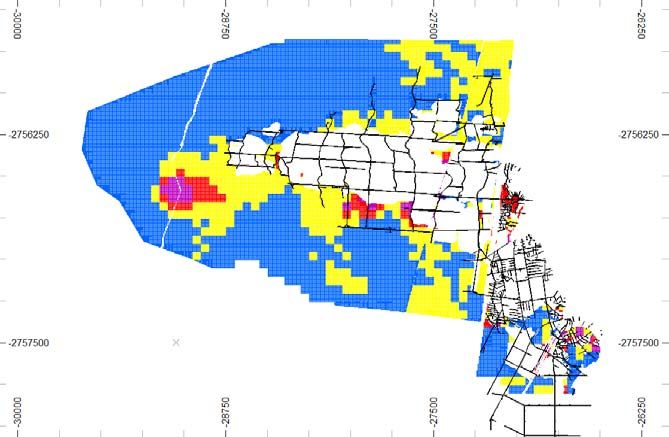
Figure 8) Rietfontein resource vertical projection showing grade of planned stoping widths (Source: Minxcon)

                                         Figure 10) Beta grade model

            Figure 9) Beta grade model‐ Plan view showing stoping width grades (Source: Minxcon)

BETA SCOPING STUDY
The Beta mine is situated approximately 2.5km by road from the existing TGME processing plant. The
planned mining design at Beta consists of conventional breast mining, with handheld airleg drilling. A
scraper is then used to clean the face and transport ore to a centre gully. An ore pass is constructed
from the centre gully to the footwall, where trucks are loaded and transported to surface.
Run of mine ore will be trucked 2.5km to the TGME plant. The preliminary production schedule
contemplates underground mining of 240ktpa over a period of 9 years (including ramp‐up period, refer
to Figures 10, 13). This is considered a base‐case scenario, with further work on reducing the capital and
improving recovery as part of the planned Preliminary Feasibility Study (PFS), which is expected to
enhance project economics.

                                                                                                                 8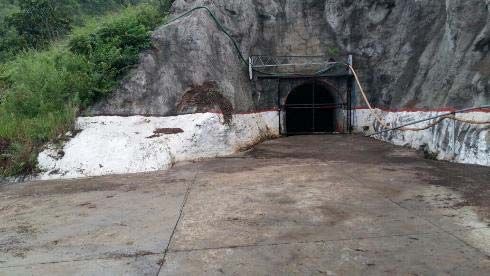
Table 2: Key aspects of the Beta Scoping Study
                         Parameter                                                  Detail
                                                         Indicated: 2.15Mt @ 7.0 g/t Au for 481koz
 Mineral Resources
                                                         Inferred: 2.6Mt @ 6.3 g/t Au for 522koz
 Production Schedule (Milled tonnes)                     1.87Mt @ 6.15g/t Au for 369koz contained
 Mine Life                                               9 yrs including ramp‐up (7 yrs full production)
 Processing Rate (design rate)                           240ktpa
 Recovery (Life of Mine)                                 79.6% overall recovery (284koz LOM recovered)
 Project Capital Cost (peak drawdown)                    US$45M
 Operating Costs                                         US$ 97/t operating cost (US$643/oz C1
                                                         recovered)

                                       Gold Production Forecast: Beta
            50                                                                                          11.0
                                                                                                        10.0
            40
                                                                                                        9.0

                                                                                                               ROM grade (g/t)
            30                                                                                          8.0
    Kozpa

            20                                                                                          7.0
                                                                                                        6.0
            10
                                                                                                        5.0
            0                                                                                           4.0
                 CY'20     CY'21     CY'22   CY'23   CY'24   CY'25   CY'26   CY'27     CY'28    CY'29

                                              Beta (Kozpa)       Beta Grade (g/t)

                                Figure 10) Beta gold production under delayed scenario

                          Figure 11) Preliminary Beta Mine Schedule (Source: Bara Consulting)

                                                                                                                                 9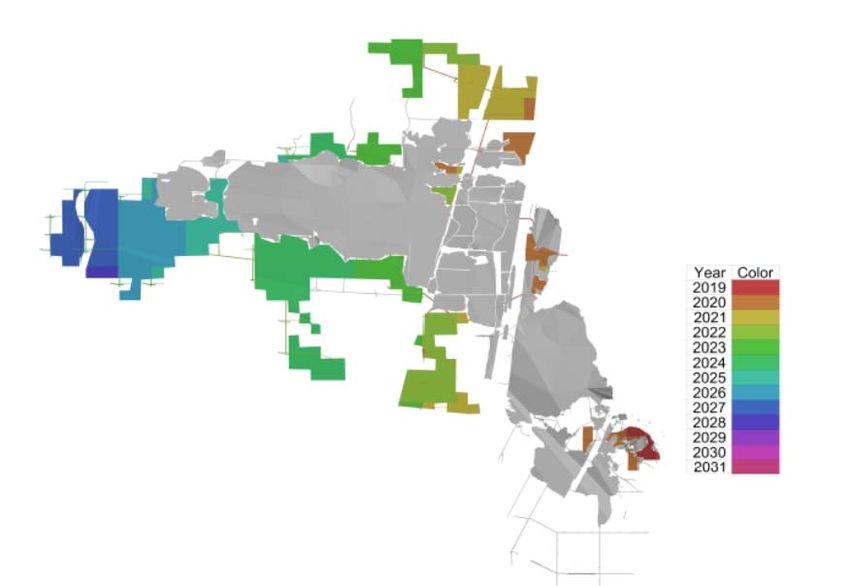
Figure 12) Beta mining method (Source: Bara Consulting)

                                             Beta Production by Ore Category
                 300,000                                                                                               12

                 250,000                                                                                               10
   ROM tonnage

                                                                                                                            Au grade (g/t)
                 200,000                                                                                               8

                 150,000                                                                                               6

                 100,000                                                                                               4

                  50,000                                                                                               2

                      0                                                                                                0
                           Year 1   Year 2    Year 3   Year 4   Year 5     Year 6   Year 7   Year 8   Year 9 Year 10

                                              Indicated         Inferred            RoM grade (g/t)

                                       Figure 13) Resource Production Schedule, Beta Mine
Minxcon Consulting recently updated the resource for the Beta mine. The Mineral Resource estimation
is compiled in accordance with the JORC (2012) Reporting Code (Table A2, p22).

Processing
The processing of the Rietfontein and Beta ore will be done at the existing TGME processing plant
following refurbishment and upgrade. Material will be crushed, milled and floated to produce a high
grade concentrate. The concentrate will be partially oxidised through the introduction of oxygen in a
high shear mixing environment. The concentrates will then be leached through a high grade CIL plant for
the recovery of gold. Flotation tails will be processed through a separate CIL plant for the recovery of
gold.
Significant effort will be put into gravity gold recovery, particularly at Rietfontein given the past records
indicating a 30% free gold recovery over simple corduroy cloth tables. It is expected that modern gravity
gold recovery methods will significantly improve the free gold recovery. Carbon will be processed
through an elution plant for the recovery of gold.

                                                                                                                                             10
A further flotation step will be added up front on the Beta material to remove carbonaceous material
before being processed through the sulphide flotation section. Historical operations ran this carbon
flotation successfully and improved flotation technologies are expected to further enhance this removal
of a potential preg‐robbing material (removal of gold in cyanide from the tanks by unwanted material).
A phased construction approach can be readily adopted to the existing TGME plant to accommodate a
Rietfontein start with a delayed Beta introduction.
The processing plant was operated as recently as early 2015 during the trial mining of the Pre Mined
Residue (PMR) from the Beta mine. This processing included the screening of the material followed by
milling, CIL and elution for the recovery of gold.
For the Beta Mine an overall recovery of 79.6% has been applied. This information has been delivered in
a summary report by independent Metallurgical Consultant RH Murray (RH Murray; Development of
Metallurgical Recovery Data for Beta Scoping Study; 2017). In the report reference is made to previous
bottle roll and batch recovery data on the Beta PMR bulk trial mining as well as testwork completed on
a Beta flotation concentrate in 2009 as part of BIOX testwork.
As part of the scoping study no metallurgical testwork has been conducted on the Rietfontein and Beta
hard rock ores. The recoveries quoted have been derived from the information available. During future
development studies testwork will be carried out on representative samples of Rietfontein and Beta
ores in order to clearly define the metallurgical performance of the ore. This information can then be
used to further refine the process flow diagram for the orebodies and also provide an overall gold
recovery number with sufficient confidence for further financial modelling.
Infrastructure
The Rietfontein mine is located immediately to the south of the main tar road between Sabie and
Hazyview and some 3.3km west of the town of Sabie. The orebody strikes north‐north east and
approximately parallel to the main tar road between Sabie and White River and passes underneath the
road at a point 5km to the southwest of the town of Sabie (Figure 14).
Underground access to Rietfontein Mine is possible through a number of existing adits however the
no.3 adit (1015amsl) is the most suited to access the mine and is in good condition (Figure 15).
Limited infrastructure exists in the vicinity of the adit including:
Concrete stabilised area around and above the adit entrance to prevent erosion
Stormwater drainage and water handling arrangements.
Security shed
Concrete apron
There is also a previously used tailings dam close to the 3 Level adit, which may be of use in the future
should on‐site processing be an option.
Rietfontein is 41 km from the TGME plant using existing public roads via the R536 to Sabie and then the
R532 and R533 to Pilgrims Rest. A 22kV powerline is located 0.5 km away.
The Beta Mine is situated 1km from the TGME processing site, or 2.5km by dirt road, within the existing
mining lease area. The mine has significant development to the mining faces and further development is
planned under the orebody to allow the use of trucks. Bulk electricity is available within 0.5 km of the
mine and there is unrestricted access to the adit entries.
11Figure 14) Location image showing orebody projection.
Figure 15) Location of Adit 3 at Rietfontein, refurbished in 2014
Figure 16) Location of Beta Adit, showing 2013 refurbishment underway
12The TGME plant has existing infrastructure, including but not limited to:
Fully permitted TGME processing plant including milling, CIL, Elution, Gold Room and Tailings Facility
Offices
Workshops
Stores
Grid Power
Water for processing activities
The permitted tailings facility has a current estimated capacity of 2.2Mt, with further expansion to a
capacity of 5 to 10Mt to be evaluated as part of pre‐feasibility work (Figure 17).
Figure 17) Aerial shot of TMGE processing plant & tailings storage dam
Environmental and permitting
A new order mining right was issued for Rietfontein in 2006, allows for the mining of this venture and
specifically by a Mining Right (358MR) registered with the Department of Mineral Resources (DMR). The
mining permit is valid until 2028 with options to extend.
Mining Right 358MR allows for the construction of the surface infrastructure; rehabilitation of the adits;
access to the underground workings; disposal of waste rock on the surface and mining of ore.
Power lines suitable for providing the necessary power for infrastructure and mining are nearby and
follow the main bitumen road which allows direct access to the site. The Right also allows for the
transport of ore along this road to Pilgrims Rest, where the TGME processing plant is situated, 41 km
from Rietfontein Mine.
The project also has a Water User Licence which is valid for the duration of the Project. The mining right
includes phase two developments in the southern area of Rietfontein; where additional mining
infrastructure is planned on surface.
The southern extent of the Beta mine is covered by a mining right and existing water user license. The
northern part of Beta is covered by prospecting rights in the process of being converted into mining
rights.
13Operating Costs
Operating costs for the mining and processing of the Rietfontein and Beta ore have been estimated to
scoping levels of accuracy using benchmark costs available to Bara Consulting and Stonewall. The
mining operating costs are benchmarked against other similar sized narrow vein gold mines in Southern
Africa.
Processing costs were estimated based on Stonewall and Bara’s experience with similar gold processing
plants.
Technical services, engineering and head office overhead costs were benchmarked from similar sized
operations in the Bara database (Table 4).
Table 4) Operation cost summary
OPERATING COST Beta Rietfontein Weighted
Average
Mining 29 45 36
Engineering 27 11 20
Surface transport 1 9 5
Technical Services 9 9 9
Processing 20 22 21
Finance and Administration 7 7 7
Head Office Overheads 3 3 3
Total Operating Cost (US$/t) 97 107 101
This amounts to an average (C1) operating cost of US$422 per oz of gold produced for Rietfontein and
US$643/oz for Beta, or a combined C1 of US$495/oz (AISC US$624/oz).
Mining modifying factors were estimated based on the nature of the orebody and the mining method
applied, as follows:
Minimum mining width of 90 cm
Pillar losses of 15%
Dilution
o Planned (gullies and development) at 3%
o Unplanned at 10%
Mine call Factor (inverse of gold loss) of 90%
Capital Cost
The project capital costs required for the refurbishment and upgrade of the processing plant, mining
infrastructure and other mine development at Rietfontein is estimated at US$31.9M (Table 5). Re‐
opening and development of the underground mine is on the critical path of the project and
refurbishment and upgrade of the TGME plant is required to commence in the second half of year 1 and
first gold production is expected in the middle of the second year. Note the below costs have a level of
contingency built in of at least 15%.
14Table 5) Life of Mine Capital Costs
CAPITAL COST Beta Rietfontein
Mining – development (up to 18mths
7.4 7.3
from start)
Mining equipment 1.1 0.1
Underground infrastructure 3.6 4.4
Surface Infrastructure 5.1 1.9
TGME Plant (inc. contingency) 15.0 17.4
EPCM/owner contingency 1.0 0.8
Project Capital Cost (US$/m) 33.0 31.9
Development and sustaining Capital
29.8 47.0
(Yr3 onwards)
Total Life of Mine (LOM) Capital Cost 62.8 78.9
Due to the fast tracked project schedule cash flow from gold sales is expected as early as Year 2,
reducing the peak funding requirement (maximum drawdown) to US$29M.
Sustaining capital includes underground development and other normal sustaining capital items
amounting to an additional US$76.8M, or an average of US$23/t per year during steady state
production at both mines (440ktpa processed).
The all‐in‐sustaining‐costs (AISC), which includes operating cost, sustaining capital and royalties is
estimated at US$624oz of gold sold for the combined operation, potentially placing the TGME project
amongst the lowest quartile of gold mines globally (see below).
Global Goldmine Cost Curve
1800
1600
1400
Target TGME AISC (US$624/oz)
AISC (US$/oz)
1200
1000
800
600
400
200
0
25% 50% 75% 90%
Estimate only for 1Q'2017, Excludes by‐product credits (Source: MineInvest estimates).
Figure 18) 2017 Global Gold Production Cost curve
Cashflow
Life of mine revenue, before deduction of royalties, is estimated at US$816M, based on a gold price of
US$1200 per oz. Life of mine pre‐tax net cashflows are estimated at US$306M (US$228M post tax),
averaging US$37M per year (based on full 7.5yrs of production). These figures are exclusive of initial
capital expenditure (first two years).
15Annual Cashflow (Pre‐tax)
80
60
40
US$ million
20
‐
‐20
‐40
2018 2019 2020 2021 2022 2023 2024 2025 2026 2027 2028 2029
Figure 19) TGME project: Scoping Study Pre‐tax Cashflow, Rietfontein development
from 2018 and Beta from mid‐2019
Price Assumptions
The financial modelling and revenue assumptions are based on a US$ gold price of $1200 per oz. In
estimating capital and operating costs a ZAR to US$ exchange rate of R13.50 : US$1.00 was assumed.
NPV & Sensitivity
The combined project pre‐tax Net Present Value (NPV), at a nominal 10% discount rate, is US$166M,
calculated from a monthly cashflow schedule. Sensitivity to key parameters is shown below.
Sensitivity of NPV to change in Revenue,
Operating cost and Capital cost
350
300
250
US$ million
200
150
100
50
0
‐30% ‐20% ‐10% 0% 10% 20% 30%
Capital Cost Operating Cost Revenue
Figure 20) TGME project: NPV Sensitivity (Source: Bara Consulting)
IRR
The Project Internal Rate of Return (IRR) is 81% (pre‐tax) or 73% post tax.
16Future work
A drilling program designed by the Company’s consultant (Minxcon) is planned for the Rietfontein
project with a view to increasing the confidence level of resources in the mining inventory through
increasing the quantity of indicated resources, as well as to test for strike and depth extensions.
In addition, samples will be taken from the current underground faces with a view to upgrading the
current resources at the Rietfontein mine. This resource sampling will generate samples for
metallurgical testwork which will allow for further enhancements to the process flow diagram as well as
provide input into the geotechnical and groundwater studies.
Group Resources
The total Mineral Resources for the Stonewall Operations (Measured, Indicated and Inferred Mineral
Resources) totals some 26.7 Mt at a weighted mean grade of 4.34 g/t for about 115.7 tonnes of gold
translating into some 3,720 Koz Au. The summary table is included in Table A3.
17MATERIAL ASSUMPTIONS
Material assumptions used in the estimation of the production target and associated
financial information are set out in the following table:
Criteria Commentary
Mineral Resource The original reports titled “New High Grade Resource (JORC 2012) at
estimate underpinning Reitfontein and Significant Resource Upgrade” and “Beta Resource Upgrade”
the production target were dated 7 February 2017 and 28 March 2017 respectively and released to
Australian Securities Exchange on those dates
The production target is approximately 681 koz of recovered gold, at an
average targeted production rate of 86 kozpa for a period of five years of full
production and peaking at 109 kozpa. Approximately 41% of the total
production target is in the Indicated and 59% in the Inferred Resource
categories. A cut off of 5 g/t Au has been used in determining the production
target at Rietfontein, while at Beta the cut‐off applied was 500 cm.g/t.
Site Visits Site visits were carried out by representatives of the Independent Resource
Consultant, mining, engineering and geo‐technical consultancy and
metallurgical consultancy.
Study Status The production target and financial information in this release are based on a
scoping study. The scoping study referred to in this announcement is based
on low‐level technical and economic assessments and is insufficient to
support the estimation of Ore Reserves or to provide assurance of an
economic development case at this stage or to provide certainty that the
conclusions of the scoping study will be realised.
Mining factors or Mining modifying factors were estimated based on the nature of the
assumptions orebody and the mining method applied, as follows:
Rietfontein
Minimum mining with – 90 cm
Dilution
o Planned (gullies and development) – 3%
o Unplanned – 10%
Mine call factor (inverse of gold loss) – 90%
Pillar losses – 15%
Beta Mine
Minimum mining with – 90 cm
Dilution
o Planned (gullies and development) – 4%
o Unplanned – 10%
Mine call factor (inverse of gold loss) – 90%
18Criteria Commentary
Pillar losses – 10%
These are considered appropriate after assessing the nature of the orebody
as well as the likely mining methods.
Metallurgical factors For the Rietfontein mine an overall metallurgical recovery of 86%. Free gold
or assumptions recovery of 30% (This is expected to be as high as 50% with current gravity
recovery methods). Information is based on a report done in 1938 on the
Rietfontein Mine (WP Boxall; The Rietfontein (T.C.L) Mine, Sabie; Journal of
the Chemical, Metallurgical and Mining Society of South Africa; Oct 1938).
Float recovery of 77% (this is expected to be higher with current flotation
technologies). CIL recovery on oxidised flotation concentrate 85% (ARC
Fowler; Mining at Transvaal Gold Mining Estates, Limited 1872‐1967;
February 1968 Journal of the Institute of Mining and Metallurgy). This is
expected to be matched given the older roaster technologies and expected
inefficiencies during the operations in the 1930’s. CIL recovery on flotation
tails 65%, estimate based on Fowler report (ARC Fowler; Mining at Transvaal
Gold Mining Estates, Limited 1872‐1967; February 1968 Journal of the
Institute of Mining and Metallurgy).
For the Beta Mine an overall recovery of 79.6% has been applied. This
information has been delivered in a summary report by independent
Metallurgical Consultant RH Murray (RH Murray; Development of
Metallurgical Recovery Data for Beta Scoping Study; 2017). In the report
reference is made to previous bottle roll and batch recovery data on the Beta
PMR bulk trial mining as well as testwork completed on a Beta flotation
concentrate in 2009 as part of BIOX testwork.
As part of the scoping study no metallurgical testwork has been conducted on
the Rietfontein and Beta hard rock ores. The recoveries quoted have been
derived from the information available. Testwork will be carried out on
representative samples of Rietfontein and Beta ores in order to clearly define
the metallurgical performance of the ore as part of the PFS. This information
can then be used to further refine the process flow diagram for the orebodies
and also provide an overall gold recovery number with sufficient confidence
for further financial modelling.
Environmental Rietfontein is fully permitted for mining and removal of material through road
transport including an approved Water User Licence. Beta is awaiting
conversion from Prospecting Right to Mining Right for part of the mine. Other
approvals are in place.
Infrastructure An assessment of public infrastructure has been carried out. On mine
infrastructure has been scoped according to industry practice and scoping
study level capital estimates have been made.
Capital Costs Capital estimates have been developed using a combination of benchmark
projects and consultant databases. Capital costs include:
Cost to establish the underground mine and mining equipment
The cost of refurbishing the processing plant, which includes all
infrastructure related to processing the ROM ore and disposing of the
tailings.
The cost of mine support infrastructure, including infrastructure required
19Criteria Commentary
for explosives, electrical power and pumping.
Indirect project costs, such as engineering costs, freight and contingency.
The capital costs do not make provision for the following:
Head office costs.
Mine closure and environmental costs.
Social responsibility costs.
The costs presented are real costs and are exclusive of escalation.
Operating Costs The basis of Operating Costs has been defined as the cost of all ongoing
mining, processing and operational activities. Operating costs therefore
comprise:
The cost of underground mining including ore development and
stoping, including the cost of man power, consumables and bulk supply.
The cost of processing the ore to saleable products, including the cost
of man power, consumables and bulk supply.
The cost of shared services for the support of the operation, including
the cost of on‐ site labour, infrastructure, camp costs and bulk supply.
The cost of transporting the ore from the mine to the processing facility.
Operating costs have been determined through database costs and
estimations based on similar operations.
The costs presented have a base date of February 2017, are presented in
United States Dollars.
The operating costs do not make provision for the following:
Head office costs.
Closure and environmental costs.
Off‐site costs.
Social responsibility costs.
The costs presented are real costs and are exclusive of escalation. The
Company believes that on‐ site operating costs on a C1/oz recovered basis
will be within the lower quartile of the industry peer group. The basis for this
assumption is the ability to discretely mine high grade ore by selective mining
with hand‐held drilling methods (shrinkage stoping at Rietfontein and
conventional breast mining at Beta). The mining operation is simple, and
production rates are relatively small at:
Rietfontein – 16,700 tpm
Beta – 20,000 tpm
Revenue factors A gold price of US$1200 per oz has been assumed in the scoping study. The
ZAR to US$ exchange assumed is R13.50 to US$1.00.
20Schedule and The project development schedule indicates that the Project can be
Timeframe constructed and be ramped‐up within two years, with further expansion to
accommodate ore from Beta Mine in years two and three. The re‐opening of
the mine is on the critical path. The major capital expenditure on the
refurbishment of the TGME processing plant is required approximately six
months to a year later than the start‐up capital for the mine re‐opening.
Funding The Company believes that reasonable grounds exist to assume that funding
for the Project will be available. The Company believes that the highly robust
economics, relative efficient capital intensity and modest project size and
approach will facilitate successful fund raising for the project. The ability of
the Project to be funded remains a key risk to successful project
implementation.
Economic A discount rate of 10% has been used for financial modelling. This number
was selected as a generic cost of capital and considered a prudent and
suitable discount rate for project funding and economic forecasts in Africa.
Social The Company is involved with a number of projects in the local communities.
General acceptance of the project is good. No material risks have been
identified in this regard.
Other There are no known naturally occurring material risks to the Rietfontein and
Beta Projects.
Classification Resources were classified in accordance with the Australasian Code for
the Reporting of Exploration Results, Mineral Resources and Ore
Reserves (JORC Code, 2012 Edition).
The classification of the Mineral Resources was completed based on
the geological continuity, estimation performance, number of drill
samples, drill hole spacing and sample distribution. The Competent
Person is satisfied that the result approximately reflects his view of the
deposit.
Mineral Resource Estimation and Reporting methods are discussed in
“Section 3 of Appendix A, JORC Code, 2012 Edition – Table 1 reporting
template”
Audit or reviews The mining and processing and infrastructure components of the scoping
study were independently reviewed by Stonewall specialist consultants. No
material issues were identified by the reviewers.
21Table A1: Rietfontein Mineral Resource Statement as at 20 January 2017 (ASX release dated 7 February, 2017)
Stope Au Reef Width Stope width Stope Stope Tonnes Au Content
Resource Classification
g/t cm cm cm.gt Mt kg koz
Measured ‐ ‐ ‐ ‐ ‐ ‐ ‐
Indicated 10.06 76 111 1,113 0.720 7,247 233
Total Measured and Indicated 10.06 76 111 1,113 0.720 7,247 233
Stope Au Reef Width Stope width Stope Stope Tonnes Au Content
Resource Classification
g/t cm cm cm.gt Mt kg koz
Total Inferred 11.40 108 132 1,502 1.834 20,901 672
Notes:
1. Mineral Resources are reported at resource cut‐off of 1.8 g/t (230 cm.g/t).
2. 33% of the Inferred Mineral Resource occurs below the last known data point.
3. Fault losses of 5% for Indicated and 10% for Inferred Mineral Resources have been applied.
Table A2: Beta Mineral Resource Statement as at 23 March 2017 (ASX release dated 28 March, 2017)
Au Reef Stope Stope Channel
Stope Au Content
Resource Classification Stoping Width width Tonnes Tonnes
g/t cm cm cmgt Mt Mt Kg K Oz
Measured ‐ ‐ ‐ ‐ ‐ ‐ ‐ ‐
Indicated 6.96 24 90 529 2.147 0.669 14 950 480.7
Total Measured and Indicated 6.96 24 90 529 2.147 0.669 14 950 480.7
Au Reef Stope Stope Channel
Stope Au Content
Resource Classification Stoping Width width Tonnes Tonnes
g/t cm cm cmgt Mt Mt Kg K Oz
Total Inferred 6.32 26 90 484 2.571 0.885 16 248 522.4
Notes:
4. Mineral Resources are reported at resource cut‐off of 2.56 g/t (230 cmg/t).
5. Depletions have been applied.
6. Pillars have been included in the resources.
7. 30% of the Inferred resource is extrapolated.
8. Fault losses of 5% for Indicated and 10% for Inferred Mineral Resources were applied.
3
9. Weighted density of reef and waste is 3.06 t/m (reef = 3.6 and waste = 2.84).
10. Numbers might not add up due to rounding.
11. cmg/t and g/t figures will not back calculate due to variable densities in reef and waste rock.
22Table A3: Total Mineral Resource Statement of Total Stonewall Operations as at 23 March 2017
Mineral Tonnage Gold Grade Gold Content
Resource Type of Operation
Category
Mt g/t Kg '000 oz.
UG* 0.170 4.77 811 26.1
Measured Surface 0.151 1.59 240 7.7
Tailings 2.294 0.77 1,770 56.9
Total Measured 2.615 1.08 2,821 90.7
UG* 3.935 6.70 26,376 848.0
Indicated Surface 3.173 0.88 2,811 90.4
Tailings 0.012 0.58 7 0.2
Total Indicated 7.120 4.10 29,194 939
UG* 13.734 5.55 76,253 2,451.7
Surface 0.801 0.8 642 20.7
Tailings 2.124 3.06 6,503 209.0
Inferred
Rock Dump 0.121 1.59 192 6.2
Plant Floats 0.041 0.54 22 0.7
Beta Main 0.109 0.81 88 2.8
Total Inferred 16.93 4.94 83,700 2,691
Grand Total 26.66 4.34 115,715 3,720
Notes:
1. All Mineral Resources have an effective date of 30 June 2014, with the exception of the underground (UG*) Mineral Resources which
include the updated 20 January 2017 and 23 March 2017 Mineral Resource estimation for Rietfontein Mine and Beta Mine
respectively.
2. Only the Mineral Resources lying within the legal boundaries are reported.
3. 1 kg = 32.15076 oz.
4. Columns may not add up due to rounding.
5. Mineral Resources declared are for the entire project and have not been divided into attributable portions.
23You can also read