Beyond the Balance Sheet Model of Banking: Implications for Bank Regulation and Monetary Policy - American ...
←
→
Page content transcription
If your browser does not render page correctly, please read the page content below
Beyond the Balance Sheet Model of Banking:
 Implications for Bank Regulation and Monetary Policy
 Greg Buchak, Gregor Matvos, Tomasz Piskorski, and Amit Seru*

 This Version: NOVEMBER 2019
Bank balance sheet lending is commonly viewed as the predominant form of lending. We document and
study two margins of adjustment that are usually absent from this view using microdata in the $10 trillion
U.S. residential mortgage market. We first document the limits of the shadow bank substitution margin:
shadow banks substitute for traditional—deposit-taking—banks in easily loans which are easily sold, but
are limited from activities requiring on-balance-sheet financing. We then document the balance sheet
retention margin: banks switch between traditional balance sheet lending and selling loans based on their
balance sheet strength, behaving more like shadow banks following negative shocks. Motivated by this
evidence, we build and estimate a workhorse structural model of the financial intermediation sector. Banks
and shadow banks compete for borrowers. Banks face regulatory constraints but benefit from the ability to
engage in balance sheet lending. Critically, departing from prior literature, banks can also choose to access
the securitization market like shadow banks. To evaluate distributional consequences, we model a rich
demand system with income and house price differences across borrowers. The model is identified using
spatial pricing policies of government-sponsored entities and bunching at the regulatory threshold. We
study the quantitative consequences of several policies on lending volume and pricing, bank stability, and
the distribution of consumer surplus across rich and poor households. Both margins we identify
significantly shape policy responses, accounting for more than $500 billion in lending volume across
counterfactuals. Secondary market disruptions such as quantitative easing have significantly larger impacts
on lending and redistribution than capital requirement changes once we account for these margins. We
conclude that a regulatory policy analysis of the intermediation sector must incorporate the intricate
industrial organization of the credit market and the equilibrium interaction of banks and shadow banks.
Keywords: Shadow Banks, Balance Sheet Capacity, Market Segmentation, Capital Requirements,
Lending, Mortgages, GSEs, Unconventional Monetary Policy
______________________________

*Buchak is at Stanford Graduate School of Business (GSB), Matvos is at Northwestern University and the National
Bureau of Economic Research (NBER), Piskorski is at Columbia GSB and NBER, and Seru is at Stanford GSB, the
Hoover Institution, the Stanford Institute for Economic Policy Research (SIEPR), and NBER. We thank the National
Science Foundation (Award 1628895) for financial support. We thank Sumit Agarwal, Adrien Auclert, Anat Admati,
Matteo Benetton, John Cochrane, Ramona Dagostino, Anthony DeFusco, Peter DeMarzo, Darell Duffie, Andrea
Eisfeldt, Mark Egan, Neil Esho, Andreas Fuster, Paul Goldsmith-Pinkham, Itay Goldstein, Ben Hebert, Erik Hurst,
Arvind Krishnamurthy, Debbie Lucas, Chris Mayer, Guillermo Ordonez, Chris Palmer, Karen Pence, Tarun
Ramodarai, Alexi Savov, Antoinette Schoar, David Scharfstein, Hyun Shin, Jeremy Stein, Johannes Stroebel, Amir
Sufi, Adi Sunderam, Joe Vavra, Arlene Wong, and seminar participants at AQR, Bank for International Settlements,
Columbia GSB, European Central Bank, Harvard Business School, Hoover Institution, Housing Finance Policy
Center, Indian School of Business, MIT Sloan, Stanford GSB, Yale University, UCLA, University of Texas at Austin,
Washington University in St. Louis, Boston College, UNC, University of Rochester, Kellogg School of Management,
University of Illinois at Urbana Champagne, and participants at NBER Monetary Economics, NBER Summer
Institute, Kellogg Housing and Macroeconomics Conference, Midwest Finance Association Conference, Wharton
Conference on Liquidity and Financial Fragility, Stanford Institute of Theoretical Economics Financial Regulation
Conference, Office for Financial Research Financial Stability Conference, FDIC Financial Technology Conference,
Summer Real Estate Symposium, Central Bank Research Association annual meeting, and the San Francisco Federal
Reserve Conference on Advances in Financial Research for helpful comments. We also thank Susan Cherry, Monica

 1
Clodius, and Sam Liu for outstanding research assistance. This paper was earlier titled “The Limits of Shadow Banks.”
 First Version: February 2018.

Section I: Introduction
Policymakers and researchers have long viewed balance sheet lending by deposit-taking
institutions—traditional banks—as the predominant way loans are supplied to households and firms
(Sunderam 2015). Under this view, banks use deposits to extend loans, which they hold on their
balance sheet until repayment or default. Therefore, traditional banks have been the main focus of
regulation and supervision in financial intermediation. The bank balance sheet view omits two
important aspects of modern financial intermediation.
First, a substantial share of financial activity has migrated to the less regulated shadow banking
sector.1 For instance, following the increase in bank regulation after the 2008 financial crisis, the
shadow bank loan origination share more than doubled in the $10 trillion U.S. residential mortgage
market. Shadow banks now account for the majority of new mortgage originations (Buchak et al.
2018). Financial intermediation regulation therefore needs to account for this “shadow bank
migration margin” of adjustment in the supply of financial intermediation.2 In this paper, we
document the shadow bank migration margin primarily for activities which do not require on-balance-
sheet financing. Banks, by virtue of deposit financing, retain an advantage in balance-sheet intensive
activities. In other words, differences in financing result in market segmentation.
Second, banks themselves sell over XXX% of the loans instead of holding them on their balance
sheet. We document a new margin of adjustment by traditional banks, which we call the “balance
sheet retention margin.” When faced with shocks, traditional banks adjust their business models,
switching from on-balance-sheet lending to off-balance-sheet lending. Our facts suggest that the
allocation of intermediation activity and risks between banks and shadow banks is determined by the
industrial organization of financial intermediation as well as the changing business models of banks.
We then demonstrate that the two margins of adjustment are central to understanding consequences
of policies such as capital requirements and monetary policy.
We explore the interaction of banks and shadow banks in two main residential mortgage market
segments in the U.S.—the conforming market and the jumbo market—for two broad reasons. First,
these two segments account for the vast majority of the $17.8 trillion3 residential mortgages originated
during our sample period (Beraja et al. 2019; Wong 2018; Palmer 2015). Second, the institutional
difference between these segments allows us to study the role of balance sheet capacity. Originating
conforming mortgages does not require as much balance sheet capacity since these loans are eligible

 1
 See Gennaioli, Shleifer, and Vishny (2013); Ordonez (2018); and Moreira and Savov (2017) for models of shadow
 banking, and Greenwood and Scharfstein (2013) and Adrian and Ashcraft (2016) for a comprehensive review.
 2
 For instance, the banking regulation proposal of the Minneapolis Federal Reserve, the “Minneapolis Plan,” discusses
 taxing activity that migrates to shadow banking following higher capital requirements:
 https://www.minneapolisfed.org/publications/special-studies/endingtbtf/final-proposal/summary-of-the-
 minneapolis-plan-to-end-too-big-to-fail.
 3
 Mortgage Bankers Association estimates for 1–4 unit family homes [accessed August 12, 2019]
 https://www.mba.org/Documents/Research/Historical%20Mortgage%20Origination%20Estimates.xlsx.

 2
for purchase by Government-Sponsored Enterprises (GSEs). Jumbo mortgages, on the other hand,
are not eligible for GSE support and—especially since the disappearance of the private securitization
market after the financial crisis—are more difficult to securitize; the vast majority of jumbo loans are
retained on the lenders’ balance sheets. We exploit this difference to understand the role of banks’
balance sheet capacity in shaping the migration of activity between banks and shadow banks.
We begin by documenting large swings in the share of balance-sheet intensive (jumbo) mortgage
originations during this period. From 2007 to 2009 the share of jumbo originations declined
precipitously relative to easy-to-sell (conforming) mortgages, from 29% to 10%, only to reverse back
to 30% by 2016. These market swings coincided with a dramatic migration of mortgage origination
activity to shadow banks (Buchak et al. 2018). We document that the migration was limited to the
conforming sector, where shadow banks gained 25% of market share from 2008 to 2015. In balance-
sheet intensive jumbo mortgages, shadow banks did not gain market share; traditional banks’ share
persisted well above 80% despite large declines in the quantity they lent.
We argue that this market segmentation arises because traditional banks and shadow banks differ in
their ability to extend balance-sheet intensive (jumbo) and easy-to-sell (conforming) mortgages.
Traditional banks’ comparative advantage in the jumbo market arises from their ability to retain these
loans on their balance sheets. To separate this explanation from alternatives, we exploit the sharp size
discontinuity in the ability to securitize a mortgage. Any mortgage that exceeds the conforming loan
limit becomes a jumbo mortgage and is much more difficult to securitize. This institutional feature is
also a source of variation in our structural estimation.
Most alternative explanations for banks’ comparative advantage in jumbo lending suggest that this
advantage would increase continuously with mortgage size. For example, if richer borrowers prefer
borrowing from banks, one would imagine that borrowers’ demand for banking services would
increase continuously with mortgage size, as one transitions from conforming to jumbo mortgages.
Instead, we find a sharp 25 percentage point (pp) increase in banks’ market share at the conforming
limit. Moreover, balance sheet capacity is the likely cause of market segmentation, as opposed to
other regulatory differences between banks and shadow banks. We compare better-capitalized banks
with larger balance sheet capacity to less well-capitalized banks, which face the same regulation. The
market share of well-capitalized banks jumps by about 10% at the conforming limit. These results
are consistent with the view that the limited balance sheet capacity of shadow banks prevents
migration of balance-sheet intensive activities to the shadow banking sector.
The behavior of mortgage prices is also consistent with our hypothesis. The relative price differential
between jumbo mortgages and conforming mortgages (jumbo spread) experienced significant
variation during our sample period. Periods during which jumbo origination quantity was low were
periods of high jumbo spreads, and vice versa. Moreover, the jumbo spread decreased with the
aggregate relative capitalization of jumbo versus confirming lenders. The contemporaneous decrease
in quantity and increase in price suggests supply shocks (balance sheet capacity of jumbo lenders)
contributed to these aggregate changes.

 2
Last, we show that banks themselves face an important margin of adjustment to balance sheet capacity
shocks, the aforementioned balance sheet retention margin. Banks adjust to a decline in balance sheet
capacity by decreasing lending on balance sheet and increasing originations of loans that are easier
to securitize. In other words, banks’ business models are adaptable. Banks, which are flush with
capital, behave as standard balance sheet models of banking would suggest: they use their capital to
extend loans, which they retain on their balance sheets. However, as banks’ balance sheet capacity
declines, they switch to originating mortgages, which they can sell, behaving more like shadow banks.
Motivated by this evidence, we build and estimate a workhorse structural model of the financial
intermediation sector. It incorporates competition from shadow banks and banks’ abilities to choose
to lend on balance sheet and to sell loans. The model has several goals. First, we want to understand
how the industrial organization of intermediation and the choice of bank business model determine
who originates which types of mortgages, and at which interest rates. Second, we want to use the
model to quantitatively analyze the consequences of capital requirements, access to secondary loan
markets, and unconventional monetary policy on lending volume and pricing, bank stability, and the
distribution of consumer surplus across rich and poor households. In the process, we quantify the
importance of the shadow bank migration margin and balance sheet retention margin for policy
analysis.
The supply side of the model is determined by competing banks and shadow banks, which offer
differentiated mortgages in the jumbo and conforming markets. The central innovation is in modeling
banks. As is common in banking models, banks can originate loans, which they keep on their balance
sheet, and their balance sheet capacity is limited by their capitalization. We differ from standard
models by allowing banks to adjust their business models on the balance sheet retention margin: banks
can choose how many loans to retain versus sell. Shadow banks benefit from a lower regulatory
burden and compete with banks in originating loans, but can only finance loans by selling them.
We model demand using a modified discrete-choice framework featuring rich heterogeneity (Berry
et al. 1995; Nevo 2000). Consumers with heterogeneous preferences over price, quality, and mortgage
size choose among a menu of mortgages offered by various types of originators. This heterogeneity
is important to accommodate realistic consumer substitution patterns and, especially, to capture the
redistributive consequences of policies (see Stroebel and Vavra (2019) and Wong (2018)). Because
markets are segmented, policy interventions have redistributive consequences. For example, if capital
requirements decrease the supply of on-balance-sheet lending, then this policy will likely be costlier
for wealthier borrowers, who are more likely to take jumbo mortgages. We depart from discrete-
choice models by also allowing consumers to choose their mortgage size and, consequently, decide
whether they want a conforming or jumbo mortgage (see Benetton (2019) for an alternative way to
model discrete-continuous choices in the mortgage market).
We estimate demand and supply separately. To identify standard demand parameters, we need to
instrument for price endogeneity. We exploit geographic differences in financing cost of GSE-
conforming mortgages, which arise through political economy considerations and are unrelated to
mortgage demand (see Hurst et al. (2016) for extensive documentation of that fact). Second, we
exploit bunching at the confirming-jumbo cutoff to help estimate consumer preferences for mortgage

 3
size. Intuitively, consumers who bunch at the conforming loan limit choose a smaller than ideal
mortgage. The higher the disutility from taking on a smaller than ideal mortgage, the less bunching
we observe. Having estimated demand, we estimate supply-side parameters using intermediary price
setting and financing decisions.
Our model captures the salient features of the data, such as the market shares of banks and shadow
banks, as well as pricing of mortgages. The model estimates match the extent of bunching at the
conforming discontinuity across markets and price elasticity estimates from the literature (see
DeFusco and Paciorek (2017)). As out-of-sample validation of our model, we study model
performance following policy changes in conforming loan limits. Our model predicts changes that
are quantitatively very close to the realized changes. Moreover, we find that consumers are very price
elastic, with lower price elasticity in the jumbo market. Since this market faces less competition from
shadow banks, it is a source of rents for banks.
On the supply side, our estimates suggest that financing jumbo mortgages is more expensive than
financing conforming mortgages, even when the latter are retained on the balance sheet. The
difference declines with bank capitalization and declines to less than 5 basis points (bps) for very
well-capitalized banks. Moreover, post-2012 increases in the regulatory burden of traditional banks
substantially constrained their mortgage origination. Noncapital requirement-related regulatory
constraints, such as risk of enforcement actions and lawsuits, provided a large advantage to shadow
banks and contributed more to shadow bank migration than the increased capital requirements.
Next, we use our estimated model to consider three policy relevant counterfactuals: changing capital
requirements (Acharya et al. 2011; Benetton 2019); unconventional monetary policy such as QE or
GSE interventions (see Di Maggio et al. (2019) and Wong (2018)); and changing the access to a
secondary loan market through the GSE-conforming limit. These policies lead to changes in the
quantity, pricing, and distribution of mortgage credit, as well as where the credit is held in the
intermediation sector.
One overarching insight from the counterfactuals is that adjustments on the shadow bank migration
margin and the balance sheet retention margin are both critical to understanding quantitative
consequences of policies. For example, the tradeoff between bank stability and lending is much less
severe than anticipated by models that feature only on-balance-sheet lending. Our model predicts that
increasing bank capital requirements from current levels to 9% reduces bank balance sheet lending
by two thirds, but overall mortgage lending declines by only 2.5%. The critical margin of adjustment
in this case is the balance sheet retention margin: while balance sheet lending declines by two thirds,
total bank lending declines by only 9.5% as banks move their lending from retention to selling.
Accounting for migration of lending to shadow banks fills 7% of this gap. Both margins are equally
important in quantitatively shaping responses to other policies. A model of financial intermediation
must therefore account for both of these margins when evaluating policies.
The second general insight is that the overall adjustment depends on whether policy interventions
target traditional banks or secondary markets. When tighter regulation only targets traditional banks
(e.g., increased capital requirements), solely focusing on bank balance sheets overstates the adverse

 4
effect of such polices on overall lending volume. The adjustments on the shadow bank migration
margin and the balance sheet retention margin work to offset the adverse impact. For policies which
tighten the secondary loan market, the shadow bank migration margin exacerbates the effect: lending
contracts for shadow banks leading to a large overall decline in lending. For example, if quantitative
easing increases GSE financing costs by 100 basis points, bank lending actually increases by $53
billion while shadow bank lending decreases by $300 billion. Thus policy analysis, which ignores
the role of bank balance sheet adjustment and shadow bank lending, would result in incorrect
qualitative and quantitative predictions.
The third insight is that interventions aimed at bank stability differ in their redistributive
consequences. For example, increasing capital requirements achieves bank stability by decreasing on-
balance-sheet lending, i.e., reducing jumbo mortgages. Therefore, the cost of bank stability is mainly
borne by higher-income borrowers. An expansion of GSE funding increases the appeal of
securitization, also shifting loans from bank balance sheets and increases bank stability. It does so
while expanding lending and benefiting consumers across the income spectrum, but it comes at the
cost of taxpayers subsidizing GSE lending.
These insights generate implications for regulation that go beyond the U.S. market. For instance, the
Basel regulatory framework proposes a uniform treatment of capital requirements across countries.
The U.K., for example, does not have a large and liquid secondary market for mortgages (Benetton
2019). Our analysis suggests that increasing capital requirements in the U.K. would result in a
substantially higher contraction in lending than in the U.S. due to the absence of bank retention
margin. More generally, regulatory policy response in different economies needs to consider the two
margins of adjustment we highlight above.
More broadly, our work speaks to the theories of banking in the presence of shadow banks (see
Sunderam (2015) and Koijen and Yogo (2016)). The traditional view of banks is that they use deposits
to make loans, which they retain on their balance sheet. Our paper suggests that banks’ choice of
business model depends on both their capitalization and their equilibrium interaction with shadow
banks. On one end of the spectrum are well capitalized banks, which dominate the market for loans
that are retained on the balance sheet. At the other end are shadow banks, which originate to distribute
(OTD). In the middle are poorly capitalized banks with limited balance sheet capacity, whose
participation in the market for retained loans is limited. Thus, we argue that a complete policy analysis
must incorporate the industrial organization of the credit market and the equilibrium interaction of
banks and shadow banks.
Section II: Institutional Setting and Data
II.A U.S. Residential Mortgage Market
The residential mortgage market is the largest consumer finance market in the U.S. As of 2018 there
have been more than 50 million residential properties that have a mortgage with a combined
outstanding debt of about $10 trillion (Source: Corelogic Data). In the U.S., the process by which a
mortgage is secured by a borrower is called origination. This involves the borrower submitting a loan

 5
application and documentation related to his or her financial history and/or credit history to the lender.
We discuss below the main segments of the U.S. residential mortgage market and the associated
lenders active in these markets.
II.A.1 Banks, Shadow Banks, and Loan Origination Business Models
The two main groups of mortgage originators in the U.S. are banks and shadow banks (nonbank
lenders). Buchak et al. (2018) document a decline in traditional bank originations and the growth of
shadow banks, with the shadow bank market share growing from less than 30% to more than 50% by
2015. These originators differ on at least three dimensions. First, banks (traditional banks and credit
unions) partially fund their lending through insured deposits. Shadow banks do not take deposits.
Second, they differ in terms of their business models. There are two business models a loan originator
can follow: portfolio lending or originate-to-distribute. Portfolio lending implies the originator retains
the loan on their balance sheet. Conversely, in the originate-to-distribute model, originators can sell
the loan as well as service rights. Banks engage in both models, with portfolio loans comprising about
40% of their originations during our sample period. Shadow banks, on the other hand, almost
exclusively originate to distribute (see Buchak et al. (2018)). The third difference is in regulation.
Banks face a substantially higher regulatory burden than shadow banks, including capital
requirements; enhanced supervision from a wide set of regulators, such as the FDIC, FED, OCC, and
state regulators; as well as extensive compliance and rules.
II.A.2 Mortgage Products
We focus on two main residential mortgage market segments in the U.S.: the conforming loan market
and the jumbo loan market. Together these two segments account for more than 80% of all U.S.
residential mortgages originated during our sample period (based on the Home Mortgage Disclosure
Act). The largest residential market segment in the U.S. consists of conforming loans. These are
usually extended to borrowers with relatively high credit scores, conservative loan-to-value (LTV)
ratios (e.g., up to 80%), and fully documented incomes and assets. Conforming mortgages must be
below the conforming loan limit, which grew from $417,000 in 2006 to $453,100 in 2018 for a one-
unit, single-family dwelling in a low-cost area, and from $625,000 to $679,650 for the same unit type
in a high-cost area. In addition, the American Recovery and Reinvestment Act of 2009 temporarily
increased these limits in certain high-cost areas to up to $729,500. Mortgages that exceed the
conforming limit are termed “jumbo.”
Conforming loans are much easier to sell than jumbo loans, because conforming loans are eligible for
securitization with the participation of government-sponsored enterprises (GSEs), while jumbo loans
are not. GSEs allow for substantially easier securitization of conforming mortgages. For example,
Fannie Mae and Freddie Mac, the two most prominent GSEs, purchase conforming mortgages and
package them into mortgage-backed securities (MBS), insuring default risk. These MBS are
particularly attractive to investors interested in relatively safe assets. In 2017, conforming loans in
mortgage-backed securities guaranteed by Fannie Mae and Freddie Mac comprised about 50% of the
outstanding residential loans (Source: Securities Industry and Financial Markets Association Data).
Because jumbo mortgages are ineligible for GSE financing, they are issued without government

 6
guarantees. Consequently, these mortgages are significantly more difficult to securitize, and the vast
majority are retained by the originators.
II.B Description of Datasets
Our paper brings together a number of datasets which we describe below:
HMDA: Mortgage-level application data is the main source for market shares across lender and
product types. The Home Mortgage Disclosure Act (HMDA) collects the vast majority of mortgage
applications in the United States, along with their approval status. In addition to the application
outcome, the dataset includes loan type, purpose, amount, year of origination, and location
information down to the applicant’s census tract. It further contains demographic information on the
applicant, including race and income. Important for this analysis, it includes the originator’s identity,
which we link manually across years. Finally, it documents whether the originator sells the loan to a
third party, and if so, whether the loan purchaser is a GSE. An important caveat with the sales data is
that if the originator retains the loan through the end of the calendar year and sells it in the subsequent
year, it is recorded in HMDA as a non-sale. We use data beginning in 2010 and ending in 2016.
Fannie Mae and Freddie Mac Single-Family Loan Origination Data: These datasets, provided
both by Fannie Mae and Freddie Mac, contain origination data from the GSEs’ thirty-year, fully
amortizing, full-documentation, single-family, conforming fixed-rate mortgage purchases.4 The loan-
level data contain information on the loan, property, and borrower, including loan size, interest rate,
loan purpose, property location, borrower credit score, loan-to-value ratio, and, importantly, the
identity of the lender that sold the loan to the GSE. We use these data to calculate average interest
rates by lender type and market.
Black Knight McDash Loan-Level Mortgage Performance Dataset: Black Knight is a private
company that provides a comprehensive, dynamic loan-level dataset on mortgages, including loans
serviced by the ten largest U.S. mortgage servicers, accounting for approximately 75% of all
mortgages in the U.S. as of year-end 2010 (data vendor estimate). Importantly for our purpose, Black
Knight includes information on both jumbo and GSE loans and includes loans retained on banks’
balance sheets. Much like the Fannie Mae and Freddie Mac data, Black Knight McDash data contain
interest rates and a large number of borrower- and loan-specific characteristics, including FICO score
at origination, loan-to-value ratio, five-digit zip code of origination, loan purpose, and whether the
loan is fixed or adjustable-rate. The Black Knight McDash data also include dynamic data on monthly
payments, mortgage balances, and delinquency status.
BlackBox: BlackBox is a private company that provides a comprehensive, dynamic loan-level dataset
with information about more than twenty million privately securitized subprime, Alt-A, and prime
loans originated after 1999. These loans account for about 90% of all privately securitized mortgages

4
 The dataset does not include adjustable-rate mortgage loans, balloon loans, interest-only mortgages, mortgages with
prepayment penalties, government-insured mortgage loans such as Federal Housing Authority loans, Home Affordable
Refinance Program mortgage loans, Refi Plus™ mortgage loans, or nonstandard mortgage loans. The dataset also
excludes loans that do not reflect current underwriting guidelines, such as loans with originating LTVs over 97% and
mortgage loans subject to long-term standby commitments, those sold with lender recourse or subject to other third-party
risk-sharing arrangements, or those acquired by Fannie Mae on a negotiated bulk basis.

 7
from that period. Much like the Fannie Mae and Freddie Mac data, the Blackbox data contain interest
rates and a large number of borrower- and loan-specific characteristics, including FICO score at
origination, loan-to-value ratio, five-digit zip code of origination, loan purpose, and whether the loan
is fixed or adjustable-rate. The BlackBox data also include dynamic data on monthly payments,
mortgage balances, and delinquency status.
U.S. Census Data: We use metropolitan statistical area-level data from the U.S. Census and
American Community Survey between 2010 and 2015. In particular, we use incomes,
homeownership rates, and home values.
Federal Reserve Bank Data: We use banking regulatory call reports to measure bank capital ratios,
assets, deposits, and other data from bank balance sheets.
II.C Lender Classification
We classify lenders as in Buchak et al. (2018).5 Briefly, a “bank” is a depository institution and a
“shadow bank” is not. This definition parallels that of the Financial Stability Board, which defines
banks as “all deposit-taking corporations” and shadow banking as “credit intermediation involving
entities and activities outside of the regular banking system.”
Section III: Empirical Analysis
We present a set of empirical facts regarding price, quantity, and composition of mortgage credit, and
industrial organization of the market. These facts motivate our analysis and model, shedding light on
the drivers of the comparative advantage of banks and shadow banks. Table 1 shows summary
statistics for the main datasets used in our analysis.
III.A Aggregate Facts
III.A.1 Bank Balance Sheets, Jumbo vs. Conforming Volumes, and Prices
We start by documenting three related trends, which we document in Figure 1. As the capitalization
of the banking sector declined from 2007 to 2009, we observe a decline in the share of on-balance
sheet (jumbo) mortgage originations and an increase in the relative price of these mortgages. From
2009 onwards these trends reversed: as the capitalization of the banking sector increases, balance
sheet (jumbo) mortgage originations increase and the relative price of these mortgages declines. We
next discuss these trends in more detail.
Figure 1A presents the relative share of the jumbo market in the overall origination volume. This
share declined sharply from 28% in 2007 to about 10% in 2009. From 2009 onwards, the jumbo share
experienced a substantial increase, reaching about 30% in the 2015 to 2016 period. Figure 1B, which
shows total origination volumes, illustrates that this trend was driven by changes in the jumbo market:
the jumbo market collapsed before recovering to earlier levels.
Figure 1C shows that these contractions in the jumbo market share were accompanied by increases
in the relative interest rates of jumbo mortgages to conforming mortgages, the “jumbo spread,” and

5
 A complete lender classification is available at https://sites.google.com/view/fintech-and-shadow-banks.

 8
vice versa. Before the crisis, the aggregate data showed virtually no aggregate jumbo spread. As the
quantity of jumbo mortgages contracted towards 2009, their relative price increased by almost 40
basis points on average, and as much as 70 basis points in early 2009. As the market share of jumbo
mortgages recovered, the jumbo spread decreased by up to 60 basis points. The positive correlation
between aggregate price and quantity suggests that supply shocks were at least partially responsible
for driving the aggregate trends. If the contraction in jumbo quantity was solely driven by demand for
jumbos (e.g., due to a decline in house prices), we should also observe a decrease in the pricing of
jumbo mortgages.
We next show that changes in the capitalization of the banking sector are a candidate source of these
supply shocks. Figure 1D illustrates that the banking sector capitalization originally declined,
bottoming out in 2009, and then began increasing. Figure 2A and 2B show that the series are in fact
related: there is a strong positive association between bank capitalization and quantity of jumbo
originations. Overall, these patterns suggest that as traditional bank capitalization declines, the
amount of on-balance sheet (jumbo) lending declines and their relative pricing increases. In other
words, these aggregate facts are consistent with the idea that a decline in the balance sheet capacity
of the banking sector serves as a supply shock to on-balance-sheet lending, at least relative to lending,
which can be securitized.
III.A.2 Shadow Bank Migration and Banks’ Business Model Adjustment
The jumbo and conforming market segments experienced large changes in their market structure,
which can be captured in two trends. The first trend is related to the migration of residential mortgage
origination activity to shadow banks. Prior work shows that during this period, 25 pp of market share
migrated to shadow banks (Buchak et al. 2018). Central to this paper, we show that the migration of
shadow banks did not take place in balance-sheet intensive jumbo lending. Bank market share in the
jumbo market has remained roughly constant, varying between 85% and 95%. This contrasts with the
conforming market, in which bank market share declined by over one third, from slightly under 80%
in 2007 to about 50% in 2016 (Figure 3A). In other words, the contraction and later expansion in the
amount of jumbo lending is mainly driven by changes in originations by traditional banks. The
changes in the conforming market, on the other hand, are driven by changes in both shadow and
traditional bank originations.
We next document that traditional banks adjusted their business models during this period. One
possible way to interpret the facts above is that traditional banks uniformly contracted their lending
across markets, but shadow banks chose to only expand in the conforming market. This was not the
case. Figure 3B shows that as banks’ capitalization decreased from 2007 to 2009, the share of jumbo
mortgages in their lending declined from 30% to 10%. As bank capitalization increased, they shifted
their originations back to on-balance-sheet lending with jumbo mortgages comprising more than 40%
of their originations by 2016. In other words, banks appear to adjust to capitalization and other
regulatory shocks by switching between the classic banking model (originating and retaining loans)
and the originate-to-distribute model (shadow bank model). We call this margin on which banks can
adjust the “balance sheet retention margin.”

 9
III.A.3 Summary of Aggregate Facts
The aggregate facts we document are consistent with the idea that banks and shadow banks differ in
their ability to extend jumbo and conforming mortgages, resulting in market segmentation. We argue
that this market segmentation arises because jumbo mortgages are mainly kept on the balance sheets
of lenders. Since shadow banks do not have much balance sheet capacity, they mainly originate to
distribute, which is limited to the conforming market.
Such market segmentation implies that a decline in the balance sheet capacity of the banking system
leads to a relatively larger contraction in traditional jumbo mortgage supply through two channels.
First, shadow banks, lacking balance sheet capacity, respond to rising bank constraints by expanding
in the conforming market, but cannot do so in the jumbo market. Second, traditional banks, lacking
balance sheet capacity, tilt their activity towards conforming originations and away from retaining
loans on balance sheet. The larger contraction in the supply of jumbo mortgages leads to an increase
in their relative price, i.e., an increase in the jumbo-conforming spread.
III.B Micro evidence
In this section, we provide micro-level evidence consistent with the aggregate facts, which narrows
down the potential interpretations of the forces driving the aggregate data.
III.B.1 Market Segmentation at the Conforming Loan Limit
We exploit the conforming loan size limit discontinuity to reject alternative explanations of market
segmentation between banks and shadow banks. One alternative explanation of traditional banks’
large market share in the jumbo market is that wealthy borrowers who are more likely to take up
jumbo mortgages also have larger demand for other banking services. In other words, the alternative
explanation is that banks specialize in large loans, which also happen to be jumbo loans. As we
discussed in Section II, there is a sharp loan amount cutoff to qualify as a conforming loan. Borrowers’
demand for banking services should increase somewhat continuously with mortgage size, rather than
jump exactly at the conforming cutoff. The ability to securitize a mortgage, on the other hand,
discontinuously drops at the conforming loan amount. Thus, observing a discontinuous jump in the
bank market share at the conforming limit would reject the demand alternative.
We first confirm that the probability of a loan being retained on balance sheet indeed discretely jumps
at the conforming loan limit. As Figure 4A shows, the fraction of loans retained on lenders’ balance
sheets discontinuously jumps from about 25% just below the conforming loan limit to about 70% just
above the conforming loan limit.
To test whether banks specialize in large loans or in jumbo loans, we confirm that their market share
discretely increases at the conforming loan limit in Figure 4B. Banks’ market share of loans just below
the cutoff is roughly 65%, whereas bank market share above the cutoff is roughly 80%. The results
suggest that banks have a comparative advantage in originating jumbo loans because these loans are
difficult to sell.
We next more formally test whether balance sheet financing share and bank market share discretely
jump at the conforming loan limit discontinuity. We focus on mortgages within 1% of the conforming

 10
cutoff and estimate the extent of the discontinuity at the conforming loan limit using the following
regression discontinuity specification:
= × + ′ Γ + + , (1)
where is a {0,1} indicator variable for whether the loan i in census tract l originated in year
t is financed on the balance sheet or originated at a bank, respectively. is an indicator for
whether the loan size is above the conforming loan limit in the time-county of origination, and the
corresponding coefficient is the object of interest. ′ is a vector of loan-level controls including log
loan size, log applicant income, and dummy variables for race, ethnicity, sex, loan type, loan purpose,
occupancy, and property type. is a census tract-origination year fixed effect, which absorbs any
variation in local conditions over time, as well as regulatory differences. In other words, we examine
the effect by comparing loans from the same census tract and year around the conforming limit,
adjusting for observable borrower differences. For robustness, we also experiment with larger
samples, those within 5%, 10%, and 25% of the conforming loan limit.
Table 2A shows that loans directly above the conforming loan limit experience about 50 pp increase
in the share of loans financed on the balance sheet. Increasing the bandwidth above 1% produces
similar results, as shown in columns 2–4. In 2015, the most recent year in our sample with complete
data coverage, this association is even stronger: the share of loans financed on the balance sheet jumps
by about 47 pp to 62 pp above the conforming loan limit (columns 5–8).
Table 2B shows that loans directly above the conforming loan limit are nearly 25 pp more likely to
have been originated by a traditional bank, as opposed to a shadow bank. As above, when considering
only loans originated in 2015, this difference grows to 38 pp. Increasing the bandwidth above 1%
produces similar results, as shown in columns 2–4. The results around the discontinuity illustrate that
traditional banks specialize in originating mortgages, which have to be retained on the balance sheet,
and not simply mortgages, which are large.
III.B.2 Within-Bank Analysis: Balance Sheet Capacity and the Balance Sheet Retention Margin
In the previous section, we look at market segmentation between banks and shadow banks. In this
section, we look within banks. We do so for two reasons. First, we use within-bank analysis to show
that balance sheet capacity is driving banks’ comparative advantage in the jumbo market, rather than
other regulatory differences with shadow banks. Second, we provide microevidence for the balance
sheet retention margin within banks.
Market Segmentation and Balance Sheet Capacity: Conforming Loan Limit Discontinuity
Our findings above are consistent with the idea that banks’ ability to finance loans with their balance
sheets generates a strong comparative advantage in the segment for difficult-to-sell loans—i.e., jumbo
loans. However, balance sheet capacity is not the only differentiating factor between banks and
shadow banks; for example, shadow banks are subject to a very different regulatory burden than
traditional banks (see Buchak et al. (2018)). If low balance-sheet capacity is the source of market
segmentation between banks and shadow banks, then we should observe similar segmentation
between well-capitalized and poorly capitalized banks.
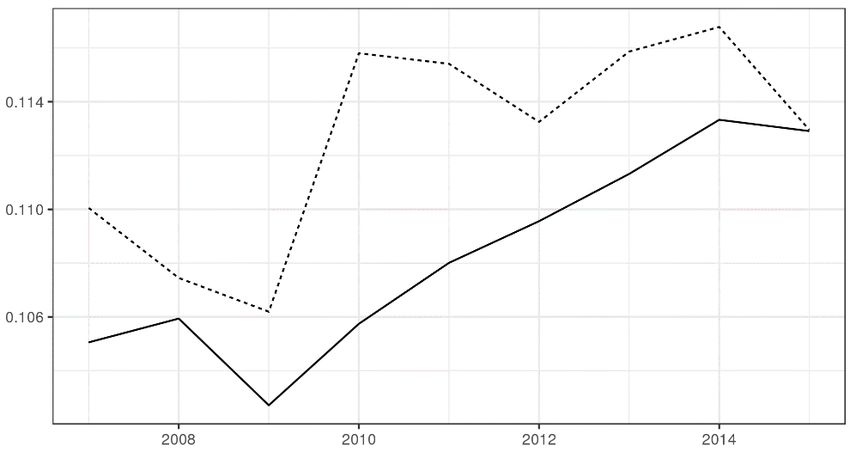
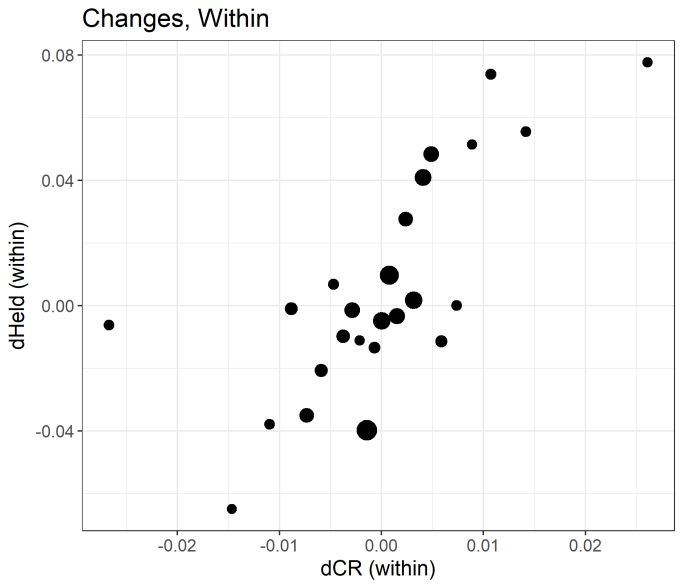
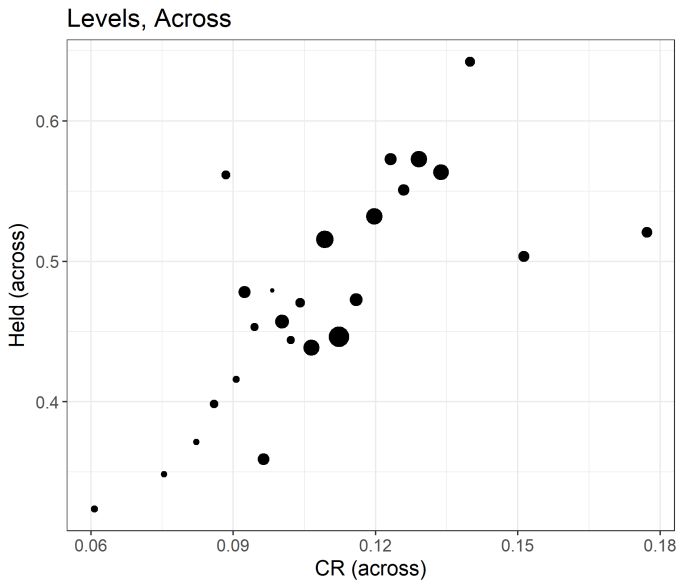
11We again study originations around the conforming loan limit. We define a bank to be well capitalized if its capital ratio is in the top 25% of bank capital ratios in the given year. Figure 4C plots the well- capitalized banks’ share of overall bank lending by conforming loan limit percentile. Well-capitalized banks’ market share jumps discontinuously by about 10 pp at the cutoff, suggesting that these banks possess a comparative advantage in jumbo mortgage lending. We formally test for the discontinuity in Table 3. First, within the sample of banks loans, the fraction of loans retained on the balance sheet significantly jumps above the conforming loan limit (Table 3A). Second, the fraction of loans originated by the well-capitalized banks substantially increases at the conforming loan limit (Table 3B). These results suggest that the balance sheet capacity of well-capitalized banks gives them a comparative advantage in the jumbo sector relative to both shadow banks and poorly capitalized traditional banks, leading to market segmentation. Balance Sheet Retention Margin In the aggregate data we document that banks’ business models adjust to shocks in balance sheet capacity. They shift away from originating balance-sheet intensive loans (jumbo), and towards loans they can sell (conforming) when their capitalization declines. Here, we provide microevidence of the balance sheet retention margin. Figure 5A shows a simple scatter plot of banks’ shares of loans retained on the balance sheet as a function of their capital ratios. The plot illustrates a strong positive relationship between bank capitalization and the share of loans they choose to retain versus sell. Figure 5B shows that this is the case within banks as well. Banks that experience a decrease in balance sheet capacity are more likely to sell loans, rather than retain them on the balance sheet. In other words, banks change their business models with changes to their balance sheet capacity. As banks’ balance sheet capacity declines, they shift towards the originate-to-distribute model and then move back towards portfolio lending as their balance sheet capacity improves. We more formally investigate whether traditional banks are more likely to retain a larger share of originated mortgages on their balance sheet if they are better capitalized using the following specification: ′ = + + + Γ + (2) Where Retainbt is the percentage of loans retained on the balance sheet by bank b in year t; CRbt is a bank’s capital ratio; γb are bank fixed effects, controlling for differences in banks’ propensities towards portfolio lending, as well other time invariant differences in business models; γt are time fixed effects, which absorb any aggregate changes that would affect the business model of banks, including aggregate demand or supply fluctuations that would affect the propensity to retain loans on the balance sheet; Xbt contains bank controls, including log number of originations, log bank assets, deposits to liabilities, log of the average loan size and applicant income of the bank’s originations, 12
and log of the number of unique census tracts in which the bank lends. These specifications are
estimated for both levels and changes in these variables.6
Table 4 shows that banks that experience a 1 pp increase in their capital ratio increase the share of
originations retained on their balance sheets by about 4.5 pp (Column 2). Columns 3 and 4 show that
across banks, better-capitalized banks originate more jumbo loans, but this effect disappears within
banks. Columns 5 and 6 show that the within-bank balance sheet retention margin occurs on the
dimension of conforming loans. In other words, as banks capitalization increases, they increase the
share of conforming loans they retain on the balance sheet. Because the secondary market for jumbo
loans is limited, banks can only adjust their balance sheet effect by adjusting originations, which is
costly. The large effect of capitalization on retention of conforming loans suggests this is the easiest
margin of adjustment, which banks can make without adjusting their originations substantially.7
These micro-level results support the aggregate evidence, which suggested that banks vary their
business models on the conforming side in response to changes in their own capitalization.
III.B.3 Relative Product Pricing
The aggregate results indicate that balance sheet contraction of traditional banks leads them to
contract supply of jumbo mortgages, increasing the jumbo spread. The aggregate jumbo spread may
partially reflect the differences in the mortgage composition, since jumbos are larger and cater to a
different population segment. To shed more light on conforming and jumbo loan pricing, we examine
the mortgage interest rates around the conforming limit in Figure 6 and compare the period during
which the spread was high (2008) with the period in which the spread was low (2014). Similar to
aggregate data, there is a sharp discontinuity of about 30 to 40 basis points at the conforming loan
cutoff in 2008 (Figure 6B). By 2014 (Figure 6C), on the other hand, we observe much more modest
increase in mortgage rates on loans above the conforming loan limit.
As we discussed above, the positive correlation between aggregate price and quantity and bank
capitalization suggests that supply shocks were at least partially responsible for driving the aggregate
trends. If the contraction in jumbo lending in the 2007–2009 period was solely driven by demand for
jumbos (e.g., due to a decline in house prices), we should also observe a decrease in the pricing of
jumbo mortgages. Instead we find the opposite effect: jumbos are relatively more expensive in times
of low jumbo-market share.
III.B.4 Consumer “Bunching” at the Conforming Loan Cutoff
There is well-known bunching at the conforming limit—i.e., there is a mass of borrowers right below
the conforming loan cutoff (e.g., DeFusco and Paciorek (2017)). A consumer who would, all else
equal, prefer a jumbo mortgage may therefore prefer to choose a cheaper conforming mortgage

6
 Mian and Sufi (2018) show that non-core deposit liability financing played an important role in the run-up to the financial
crisis. Our main results on capital ratios are robust to the inclusion of non-core deposit financing share and the core deposit
financing share (Table A3).
7
 Due to differences in risk weighting due to regulation, jumbo origination requires more capital than conforming loans.
An alternative explanation of our findings could be that some banks have a desire to originate more jumbo loans and,
because of regulatory reasons, such banks have to increase their capitalization. This is unlikely to be driving our findings.
The reason is that we find this relationship also holds for conforming loans.

 13
instead. Presumably such consumers would choose the largest possible mortgage that is still
conforming. We confirm this bunching in Figure 7A.
We document a spike in borrower income below the conforming loan limit (Figure 7B). Larger
mortgages are, on average, taken out by people with larger incomes. This implies that the bunching
at the discontinuity draws from a higher-income population than what the mortgage size would
suggest. A large spike in income would suggest that even very wealthy borrowers are willing to take
up a smaller mortgage in exchange for lower rates. We formalize this intuition in the model and
exploit the moments related to this bunching to estimate the model.
Section IV: Model of Mortgage Demand and Supply
Motivated by the evidence from the previous sections, we build and estimate a structural model of
the U.S. residential mortgage market, which features banks competing with shadow banks for
consumers. The model has several goals. First, we want to understand how the industrial organization
of financial intermediation and the choice of bank business model determine who originates which
types of mortgages, and at which interest rates. Second, we then use the estimated model to
quantitatively analyze the consequences of capital requirements, access to secondary loan markets,
and unconventional monetary policy on lending volume and pricing, bank stability, and the
distribution of consumer surplus across rich and poor households. Moreover, we quantify the
importance of the shadow bank migration margin and balance sheet retention margin for policy
analysis.
Our model builds on Buchak et al. (2018) but is substantially richer in several dimensions on both the
demand and supply sides. Most importantly, our model accounts for the market segmentation between
products which can easily be sold, and those that cannot (conforming versus jumbo mortgages), both
on the demand and supply sides. We briefly discuss some salient features of the supply and demand
sides before describing the model in detail.
On the supply side we explicitly model different financing choices across intermediaries. The supply
side of the market consists of three types of lenders, banks, and two distinct types of shadow banks:
non-fintech shadow banks, and fintech shadow banks.8 These financial intermediaries engage in two
activities: loan origination and financing. Intermediaries can finance mortgages two different ways:
portfolio (balance-sheet) lending or originate-to-distribute. In portfolio lending the intermediary
finances the mortgage from its own funds. Therefore, differences in lenders’ internal funds—i.e.,
balance sheet capacity—will change their willingness to engage in this activity. Furthermore, capital
requirements put regulatory restrictions on the amount of portfolio lending in which a bank can
engage. Alternatively, intermediaries can originate to distribute: they finance the mortgage by selling
it to a third-party financier through GSEs. Of course, an intermediary can engage in both types of
financing simultaneously. We also allow banks to face regulatory pressures beyond capital
requirements. These can arise from legal or regulatory enforcement actions, or the anticipation of
future actions on the part of regulators or prosecutors. These regulatory pressures constrain banks’
lending activity even if banks are well capitalized. In Section V.E, we relax the assumption that

8
 During our estimation period all traditional banks are classified as non-fintech (see Buchak et al. (2018)).

 14
balance sheet capacity is fixed and allow banks to alter balance sheet capacity through equity issuance
and asset sales.
Following the current institutional setup of the U.S. mortgage market, a central distinction between
jumbo and conforming mortgages is that only conforming mortgages can be financed by originating
to distribute; jumbo loans are portfolio loans. Moreover, only banks can access deposits, which give
them the ability to finance portfolio loans.9 Shadow banks can only originate to distribute. With this
setup, our model generates endogenous market segmentation between traditional and shadow banks
and within the traditional banking sector between well-capitalized and poorly capitalized banks. In
Section V.E we extend our analysis to allow jumbo mortgage securitization.
On the demand side, we build a rich discrete-continuous choice framework with an application to the
mortgage market. Importantly, we allow preferences of borrowers to be correlated with their income
and house prices. These differences in preferences, especially for larger mortgages, play a critical role
in studying the distributional aspects of policies.
IV.A Demand
A market in year t is defined at the MSA-loan purpose level. For example, a market may be
borrowers in New York City attempting to refinance their mortgages. Each market has = 1, … ,
consumers, with an ideal mortgage size , and = 1, … , lenders.
Lenders can offer up to two types of products: conforming and jumbo mortgages. Conforming
mortgage amounts that are available to an individual borrower, , have to satisfy two constraints.
First, the amount must be below the market-specific conforming loan limit ̅̅̅̅
 , which is $417,000 in
most markets during our estimation period. Second, the loan has to satisfy the individual-specific
 ̅̅̅̅̅ × is the LTV constraint times the borrower’s house price. Then the
LTV constraint, where
individual’s maximum conforming loan size is the minimum of the market-level conforming
level, and the LTV constraint:
 ̅̅̅̅
 = min{ ̅̅̅̅̅
 , × }
 (D.1)

Any mortgage that does not satisfy these two conditions is a jumbo mortgage. Jumbo mortgages must
 ̅̅̅̅̅ × . Let ∈ { , } denote
also satisfy the LTV constraint, i.e., the chosen mortgage size ∗ ≤
whether the mortgage is conforming (C) or jumbo (NC). Conditional on an offered rate, consumers
can choose any loan size subject to the limits described above.
Consumers’ utility from a mortgage depends on the mortgage interest rate , the chosen mortgage
size ∗ , which can differ from the ideal mortgage size , and the convenience or quality of the service
provided by the lender:

9
 Because banks have access to a subsidized funding of their balance sheet through insured deposits, one can model the
shadow bank decision not to engage in balance sheet lending as a competitive outcome with a corner solution.

 15
= − ⏟ . ( ( ∗ < ) −⏟ (D.2) ∗ + ⏟ ( < ) + ⏟ + + ⏟ A consumer’s utility declines in the mortgage rate , with measuring the consumer-specific sensitivity to interest rates. Borrower ’s mortgage amount ∗ can be smaller than her ideal mortgage size, . If that is the case, she suffers a disutility ( ∗ < ),10 where the borrower-specific coefficient measures the extent of disutility and I is the indicator function. This can occur when the borrower’s ideal mortgage is a jumbo > , but the borrower chooses a mortgage under the conforming limit ( ∗ < ) ( > ), or when a binding LTV constraint prevents the borrower from obtaining their ideal jumbo ̅̅̅̅̅ × ). mortgage ( ∗ > ) ( > Consumers also value mortgages on dimensions other than size and price. For example, conforming mortgage approval and administrative procedures differ from those of jumbo mortgages. We allow consumers to have different preferences over these non-rate attributes of conforming relative to jumbo mortgages, captured by . Consumers also value lenders’ convenience and/or service quality. Intuitively, consumers like to borrow from fintech shadow banks such as Quicken Loans because they offer a convenient way to interact online. + measures convenience differences between lenders. is the year-lender type invariant quality difference,11 and is a year-lender market- specific unobservable. is estimated as a year-lender type fixed effect, and is thus observable by the researcher, while is not. Last, borrowers’ preferences over lenders differ idiosyncratically, which is captured in the i.i.d. T1EV borrower-specific utility shock . For example, some borrowers prefer to borrow from JPMorgan Chase over Quicken because they have a bank account with the former, making it easier to transact. The ideal mortgage size, interest rate sensitivity, relative preference for a conforming loan, as well as the cost of departing from the ideal mortgage size are consumer specific. Consumers’ preferences are drawn from a distribution, where the distribution is a function of income and house prices in a market. Specifically, let Β ≡ ( , , , )′ describe consumer preferences, then: ̅ + Π( − Β = Β ̅ ) + Σ (D.3) 10 A consumer will never choose a mortgage which is too large. 11 Because of large changes in the quality of fintech providers over time, we allow the quality of fintech shadow banks to evolve over time as well. 16
You can also read