BEYOND THE MATRIX: THE QUANTITATIVE COST AND SCHEDULE RISK MANAGEMENT IMPERATIVE - CHRISTIAN B. SMART, PHD, CCEA
←
→
Page content transcription
If your browser does not render page correctly, please read the page content below

Presented for the ICEAA 2021 Online Workshop - www.iceaaonline.com

    Beyond the Matrix: The Quantitative
         Cost and Schedule Risk
        Management Imperative
             Christian B. Smart, PhD, CCEA
                csmart@galorath.com

1
Presented for the ICEAA 2021 Online Workshop - www.iceaaonline.com

     THE MEDIAN IS NOT THE MESSAGE
    A SINGLE NUMBER DOES NOT SUFFICE IN THE FACE OF UNCERTAINTY!

    STEPHEN JAY GOULD
    Famous paleontologist, evolutionary biologist, and writer
    Diagnosed with a rare form of cancer in 1982

    “8 MONTHS TO LIVE”
    Told he could expect 8 months to live
    Gould researched the medical literature and
    discovered this expected value was a median and
    that it was significantly less than the mean

    SKEW YOU
    Gould lived for another 20 years and died from an
    unrelated illness – the number Gould was given was
    highly inaccurate
2
Presented for the ICEAA 2021 Online Workshop - www.iceaaonline.com

    PROJECT RISK MANAGEMENT
     OPPORTUNITY IN RISK

    PROJECTS ARE INHERENTLY RISKY
    Projects of all types, large and small, experience regular
    amounts of significant cost and schedule growth
    This growth is strong evidence not only of risk, but lack of
    proper risk management
    Risk is often considered just another a four-letter word

    QUANTITATIVE RISK ASSESSMENT
    Projects need to conduct quantitative cost and schedule risk
    analysis
    The application of quantitative methods is fraught with
    obstacles

    THIS PRESENTATION
    The focus of this presentation is one aspect of the book,
    which focuses on the need for quantitative risk assessment
                                                                                        Read Chapter 1 for free:
3                                                                                        https://bit.ly/3ggPZK2
1
                                 Presented for the ICEAA 2021 Online Workshop - www.iceaaonline.com
        ANOTHER FOUR-LETTER WORD
        Despite its critical role in project
                                                                                   AGENDA
        success, risk is often ignored
        Projects need to consider risk

    2
        THE FLAW OF AVERAGES
        Averages are not sufficient to
        measure the impact of uncertainty
        We provide an example from the
        sport of baseball

    3
        QUANTITATIVE RISK
        MANAGEMENT
        Qualitative methods such as risk
        matrices underestimate risk – need
        to quantify it
        Risk and uncertainty can be
        measured by probability distributions

    4
        COMPARISON
        Inspired by an example by the late
        Dr. Steve Book, we illustrate how                              Plans based on averages are
        riskless point estimates
        underestimate likely cost                                      destined to be “behind schedule

    5
                                                                       and beyond budget”
        Even when quantitative risk is done,
        it consistently underestimates the
        true extent of uncertainty                                     Sam Savage, The Flaw of Averages
4       We discuss why and provide a
        remedy
Presented for the ICEAA 2021 Online Workshop - www.iceaaonline.com

            COST AND SCHEDULE GROWTH
                           A LEGACY OF DISASTER

    1                                                 3
        COMMON                                                     HIGH
        Multiple Industries Experience                             Cost: 50% or More on Average
        Significant Cost and Schedule                              (Mean)
        Growth – Has Been a Problem
                                                                   Schedule: 30% or More on
        for a Long Time
                                                                   Average (Mean)

    2                                                 4
        FREQUENT                                                   EXTREME (FOR COST)
        70-80% of Projects Experience                              Cost Growth in Excess of 100%
        Cost and Schedule Growth                                   Is a Common Occurrence in
                                                                   Most Projects (1 in 6)

5
Presented for the ICEAA 2021 Online Workshop - www.iceaaonline.com

Why Cost and Schedule Growth
                                                                           1
                                                                                          OPTIMISM
Occur                                                                                     Innate bias - Planning Fallacy
                                                                                          Prospect Theory - Project managers
                                                                                          are risk-seeking

    Numerous Reasons, Both                                                                COST, SCHEDULE,
    Internal and External:
    • Optimism
    • Cost, Schedule, and
                                                                           2              TECHNICAL MISALIGNMENT
                                                                                          Like a three-legged stool, all need to
                                                                                          be consistent in order for a project to
                                                                                          balance

                                                                           3
                                                                                          MOORE’S LAW
       Technical Misalignment                                                             Exponential growth in technology
    • Errors in Estimation                                                                Paired with projects that take a
                                                                                          decade or longer to complete
    • Moore’s Law                                                                         means that either requirements must
                                                                                          be continually updated or the
    • Black Swans                                                                         product is obsolete on delivery

           “The Non-Secret of Good Cost
           [and Schedule] Estimating:
           Don’t Drink the Kool-Aid”-
                                                                           4              BLACK SWANS
                                                                                          Unpredictable, rare, unprecedented
                                                                                          events that have a huge impact

6
           Lawrence Goeller, OSD Cost
           Analysis Improvement Group                                      5              LAKE WOBEGON
                                                                                          Project managers and their staff are
                                                                                          not like the children of Garrison
                                                                                          Keillor’s fictional town – they are not
                                                                                          all above average
Presented for the ICEAA 2021 Online Workshop - www.iceaaonline.com

                                                       EXAMPLES

    JAMES WEBB SPACE                                                   CALIFORNIA HIGH-
       TELESCOPE                            MOSES                         SPEED RAIL                  SYDNEY OPERA HOUSE

     Next generation space          Venice’s flood prevention       Designed to link LA and SF, but   Began construction without a
           telescope               project – has taken so long        now will only connect two       detailed plan in place, one of
      Highly complex but               to develop that it is         small cities, a mega project     the highest cost increases and
    leadership was optimistic           already obsolete                that is a mega waste           longest schedule in history

7
Presented for the ICEAA 2021 Online Workshop - www.iceaaonline.com

           COST GROWTH AND SCHEDULE DELAYS
                            EVEN WORSE THAN THEY APPEAR

                                                LOOKING BEHIND THE DATA FACADE
                                                As bad as cost growth and schedule delays are,
                                                these problems are even worse than they appear!

                                                CETERIS PARIBUS
                                                Latin for “everything else held constant,” this does
                                                NOT apply to cost overruns and schedule slips –
                                                many projects are descoped to mitigate these
                                                issues, and some are cancelled outright

                                                PAYING MORE AND TAKING LONGER BUT
                                                GETTING LESS IN RETURN
                                                While de-scoped projects are still able to achieve
                                                some objectives, many cancelled projects are a
                                                total waste – also applies to shelved projects such as
                                                the J2-X rocket engine

8
8
Presented for the ICEAA 2021 Online Workshop - www.iceaaonline.com

        Engineering –                                                                                 Economics –
        Practical Risk                                                                               Theoretical Risk
        Management                           Uncertainty Is                                           Management

    Focus on Quantitative                  The Indefiniteness                                    Focus on Utility
         Techniques
     Charles Hitch, RAND, An
                                               About an                                        Theory, Measurable
                                                                                               and Unmeasurable
     Appreciation of Systems
     Analysis (1955)
                                               Outcome                                            Uncertainty
                                                                                                J.M. Keynes, A Treatise on
     Steven Sobel, MITRE,                                                                       Probability Theory (1921)
     A Computerized                                                                             Frank Knight, Risk
     Technique to Express
     Uncertainty in Advanced
                                              Risk Is The                                       Uncertainty, and Profits
                                                                                                (1929)
     Systems Cost Estimates
     (1965)
                                             Chance and
                                            Consequence of
                                              Bad Events                                              Diverse group – e.g.,
                                                                                                      Laffont, N.N. Taleb,
     Steve Book, Paul Garvey,
                                                                                                     John Kay and Mervyn
     Christian Smart, Douglas
                                                                                                              King
          Hubbard, etc.
9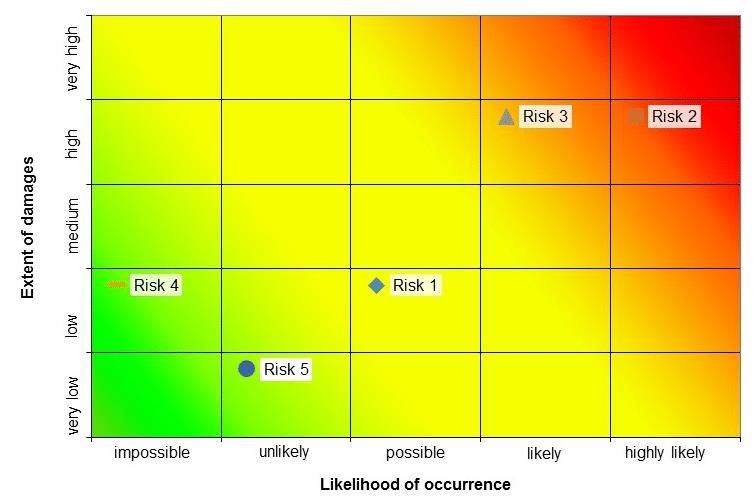
Presented for the ICEAA 2021 Online Workshop - www.iceaaonline.com

      RISK AND OTHER FOUR-LETTER WORDS
     UNCERTAINTY IS OFTEN TREATED AS THOUGH IT IS SOMETHING TO BE AVOIDED

                                                          WE ARE BLIND TO RISK
                                                          Many project managers’ attitude is like that of the Captain of
                                                          the Titanic – before that ship’s fateful voyage: “I have never
                                                          been in accident…of any sort worth speaking about. I never
                                                          saw a wreck and never have been wrecked.”

                                                          COST AND SCHEDULE RISK ARE
                                                          UNAPPRECIATED

     R!SK
                                                          I once heard a former NASA senior leader say: “Once a
                                                          project is complete, no one remembers how much it cost or
                                                          how long it took. All they remember is whether or not it
                                                          worked.”
                                                          This extreme emphasis on performance to the exclusion of
                                                          cost and schedule leads to spending more, doing less, and
                                                          taking longer

                                                          THE PLANNING FALLACY
                                                          An innate bias noted by psychologist Daniel Kahneman
                                                          People plan for the best case possible
                                                          Leads to systematic underestimation of cost, schedule, and
                                                          risk

10
Presented for the ICEAA 2021 Online Workshop - www.iceaaonline.com
THE DISAPPEARANCE OF THE .400 HITTER
WHY AVERAGES CAN BE MISLEADING
BATTING AVERAGE
Percent of plate appearances (not counting walks or hit-by-
pitch) that result in reaching base safely
Mark of an outstanding hitter is 30% or better (.300)
.400 HITTERS
Decades ago, best hitters occasionally hit .400 or better in a
season
Last player to achieve that feat was Ted Williams in 1941
THE DIFFERENCE
Average has stayed relatively constant over time, what has changed is
that the standard deviation has decreased
Chance of someone hitting .400 or better during the 1940s ~1 in 40,000
Chance of someone hitting .400 or better during the 2000s ~ 1 in 125,000
11 We Need to Consider More Than Just the AveragePresented for the ICEAA 2021 Online Workshop - www.iceaaonline.com
RISK: FREQUENCY VS. CONSEQUENCE
TWO DIMENSIONS OF RISK
Dimension 1: Likelihood of Occurrence
The frequency at which events occur is commonly referred to
as the likelihood
Frequent event: cost growth and schedule delays in defense
programs
Not-so frequent: catastrophic failure of a major system (e.g.,
Space Shuttle)
Rare: Extreme cost growth, pandemics, major wars
Dimension 2: Consequence
The impact of risks is often referred to as the consequence
Low consequence: minor technical problem that shuts down
a system for a day
High consequence: significant schedule delay that prevents
fielding a critical system for years; large number of deaths
due to a pandemic
Bias is to Focus on Frequency
Overwhelming tendency is to focus on likelihood rather than
consequence
However, consequence is more important than likelihood
12Presented for the ICEAA 2021 Online Workshop - www.iceaaonline.com
THE IMPORTANCE OF CONSEQUENCE
MORE IMPORTANT THAN FREQUENCY
Actual
PASCAL’S WAGER
Exists Does Not Exist
The seventeenth century mathematician Blaise Pascal
argued that a rational person should bet on God’s existence:
Good! No Consequence belief has limited downside but unlimited upside, while
Exists
Belief unbelief has limited upside but unlimited downside,
Bad! No Consequence regardless of likelihood.
Does Not Exist
ARE YOU FEELING LUCKY, PUNK?
“I know what you're thinking: 'Did he fire six shots or only
five?' Well, to tell you the truth, in all this excitement, I've
kinda lost track myself. But being this is a .44 Magnum, the
most powerful handgun in the world, and would blow your
head clean off, you've got to ask yourself one question: 'Do I
feel lucky?' Well, do you, punk?” Dirty Harry
STILL OVERLOOKED
Despite its importance, consequence is under weighted
Innate bias to be right
“Probability neglect” term is one example
13Presented for the ICEAA 2021 Online Workshop - www.iceaaonline.com
RISK MATRICES UNDERESTIMATE UNCERTAINTY
THEY SHOULD NOT BE USED FOR QUANTIFYING RISK!
RISK MATRIX
The use of risk matrices is a popular approach for
modeling technical risk and is often applied to cost
risk as well
Two axes – likelihood and consequence
However, there are issues with this approach in its
use for risk quantification
UNDERESTIMATION OF RISK
The inclusion of a few discrete risks significantly
underestimates the full extent of uncertainty that
programs face
Numerous studies have shown that risk matrices
underestimate risk
Risk matrices are a quasi-qualitative method
CONCLUSION
Risk matrices should not be used – true quantitative
techniques should be applied to credibly analyze
and assess risk
14Presented for the ICEAA 2021 Online Workshop - www.iceaaonline.com
UNCERTAINTY IS A SHAPE
FOUR COMMONLY USED PROBABILITY DISTRIBUTIONS
1
GAUSSIAN
The “Normal” distribution is
commonly used but not applicable
to cost and schedule (skew;fat tails)
2
TRIANGULAR
Simple, but too simple
Has no tail
Can only model limited range
3
LOGNORMAL
Can model skew
Can model relatively fat tails
In-between thin tails and fat tails
4
PARETO
80/20 Rule
Used to model extreme risks
15Presented for the ICEAA 2021 Online Workshop - www.iceaaonline.com
COST AND SCHEDULE RISK ARE NOT “NORMAL”
THE CENTRAL LIMIT THEOREM DOES NOT APPLY!
THE “NORMAL” DISTRIBUTION
Most widely used distribution in statistics
Only captures limited variation
CENTRAL LIMIT THEOREM
States if you sum independent distributions with limited
variation, in the limit the result is normal
The problem is that the assumptions do not hold
1. We do not live in the limit, the real world is pre-
asymptotic
2. Variation is not limited but is substantial
3. The distributions involved are not independent
(significant correlation plus tail dependency)
LOGNORMAL IS A BETTER CHOICE
Lognormal represents the skew (more can go wrong than go
right) and the fat right tail (potential for extreme cost growth
and schedule delays) and fits the historical cost growth and
schedule delay data well
Joint Agency Cost Risk and Uncertainty Handbook
16
recommends as a default choicePresented for the ICEAA 2021 Online Workshop - www.iceaaonline.com
QUANTITATIVE RISK ANALYIS VS.
1
EXAMPLE
For the six WBS elements on the SUMMING POINT ESTIMATES
right with a mix of triangular
and lognormal distributions
2
FOUR LOGNORMAL AND TWO
TRIANGULAR DISTRIBUTIONS
The parameters for these
distributions are provided in the
table on the right
All WBS elements are
correlated at 0.6
3
POINT ESTIMATES WBS Element
1
Distribution
LN
Mean
$109
S.D.
$40
L M H
The point estimates for each 2 LN $62 $25
WBS element are $90, $50, $20, 3 LN $24 $8
$40, $70, $30 4 Tri $40 $40 $120
5 LN $91 $40
The sum of these values is $300 6 Tri $30 $30 $120
What is the confidence level of
the sum of the most likely
values?
17Presented for the ICEAA 2021 Online Workshop - www.iceaaonline.com
QUANTITATIVE RISK ANALYIS VS.
1
EXAMPLE
For the six WBS elements on the right
with a mix of triangular and
SUMMING POINT ESTIMATES (2)
lognormal distributions
The sum of the median values is at
the 20% confidence level of the total
2
uncertainty distribution
POINT ESTIMATES ARE POINTLESS
Funding to levels below the mean for
WBS elements results in low
confidence level funding for a Funding Each WBS Element to Its
50% Confidence Level Results in a
3
system
20% Confidence Level for the System
CONNECTION WITH PORTFOLIO
ANALYSIS
Just as with a WBS, funding individual
projects below the mean results in a
negative portfolio effect
Total organization is riskier than
individual projects!
4
S-CURVES
Cost and schedule risk are typically
displayed graphically as “S-curves”
Provides probability that
Point Estimates Significantly
18
cost/schedule will not exceed a
specified value Underestimate Cost and SchedulePresented for the ICEAA 2021 Online Workshop - www.iceaaonline.com
ISSUES WITH THE CURRENT PRACTICE OF RISK ANALYSIS
RISK ANALYSIS FAILINGS
Even when quantitative risk analysis is
conducted it is not implemented well
Variety of issues
RISK RANGES ARE NOT Focus of the
REALISTIC remainder
In practice, most risk analysis results in of this
tight ranges that do not reflect the true
potential for cost or schedule growth
presentation
PORTFOLIO ANALYSIS IS NOT
CONDUCTED
Risk analysis is typically conducted at
the project level – but not at the
portfolio level
BEYOND S-CURVES These issues and more are addressed in my book,
which is now available from Amazon, Barnes and
S-curve provide useful information,
but do not provide critical information Noble, and others
about the tails Read Chapter 1 for free: https://bit.ly/3ggPZK2
19Presented for the ICEAA 2021 Online Workshop - www.iceaaonline.com
1
TRACK RECORD FOR RISK SCARCE
ANALYSIS
The results of risk analysis are rarely
compared to the actual outcome –
like a darts player that turns away
from the board after throwing a dart
WORSE THAN RANDOM
2
WHAT LITTLE EXISTS IS NOT
GOOD
The limited data available is mainly
for cost
The 90 percent confidence level
means there is only a 10%
probability that this level will be
exceeded
3
OPPOSITE OF EXPECTED
For the 10 risk analyses in the table,
the actual cost was less than the 90
percent confidence level for only
one of the ten
4
EXTREMELY UNLIKELY
It’s hard to improve if you While a small data set, the odds of
such an occurrence is extremely
don’t know how well you remote – 1 in 2.7 million
You are more likely to be struck by
have done in the past. lightning
20Presented for the ICEAA 2021 Online Workshop - www.iceaaonline.com
COVERED WITH OIL: REALISM IN
1
“ALL OF THOSE TOURISTS
RISK ANALYSIS
COVERED WITH OIL”
Jimmy Buffett, in writing the song
Margaritaville, probably never
imagined that beach goers would
be covered with crude oil
Gulf of Mexico oil spill in 2010 set
records
2
RISK UNDERESTIMATION IS
PREVELANT
Variety of reasons – correlation,
overreliance on normal distribution,
etc.
We do not have a good track record
3
of estimating risk
PERCEPTION VS. REALITY
Plato Vs. Diogenes
Home Economicus and the Iron Bowl
Notion is risk decreases over time, but risk
perception increases up to critical design
as risks are discovered/admitted, and then
decreases as these risks are addressed
4
CALIBRATION IS THE ANSWER
Augustine’s Laws - “Unknown-unknowns cannot be
It is always riskier than you think,
specified in advance but their existence in the aggregate
can be predicted with every bit as much confidence as
even taking into account that it is
21
insurance companies place in actuarial statistics.” riskier than you think.Presented for the ICEAA 2021 Online Workshop - www.iceaaonline.com
CALIBRATION TO HISTORY
As cost growth and schedule delays are instances of the realization of risk,
calibration to historical growth data provides a means to realistically assess risk
COST GROWTH DATA SCHEDULE DELAY DATA
Both cost growth and schedule delay data closely follow a three-parameter
lognormal distribution
22Presented for the ICEAA 2021 Online Workshop - www.iceaaonline.com
THREE-PARAMETER
LOGNORMAL
MEAN, VARIANCE, AND LOCATION
MEAN
The expected value of the distribution, measures the
center For a lognormal the mean is greater than the
median, which in turn is greater than the mode
(peak)
VARIANCE
Measures the dispersion around the mean
The higher the variance, the greater the uncertainty
LOCATION
A two-parameter lognormal distribution is bounded
below by zero
Location parameter shifts this in one direction or the
otherPresented for the ICEAA 2021 Online Workshop - www.iceaaonline.com
HISTORICAL BASIS
FOR EACH PARAMETER
LOCATION
Numerous studies show 80-90% of projects overrun,
indicates typical point estimates of cost are
between the 10th and 20th percentiles
VARIATION
Effective coefficient of variation for historical project
overruns varies from 50% for roads to more than
150% for mining and metals and process plants
MINIMUM
The minimum value attainable (underrun) is typically
30-50% (without significant scope reductions)
24Presented for the ICEAA 2021 Online Workshop - www.iceaaonline.com
RISK and ESTIMATING METHODS
ANALOGY PARAMETRIC ENGINEERING BUILD-UP EXTRAPOLATION
Analogies can account for Incorporates input and Typically accounts for the least Can incorporate uncertainty
uncertainty in the similarity of estimating uncertainty amount of risk as it often relies via time series methods such
the project to the precedent (including historical unknown on subjective ranges as ARIMA
and in adjustment factors – will unknowns) - most uncertainty
tend to underestimate risk of any method, most realistic
25
depiction of riskPresented for the ICEAA 2021 Online Workshop - www.iceaaonline.com
CALIBRATION IN EXCEL
FOUR DIFFERENT POINT ESTIMATES Effective CV
PERCENTILE
Often applicable to engineering build-ups and
project estimates that do not have an independent
cross-check
Typical values are 10-20%
MEAN
Parametric models can produce mean estimates
MODE
Most likely estimate, could be produced by an
analogy estimate or extrapolation
You can download the Excel tool for free from:
MAIMS (MONEY ALLOCATED IS MONEY SPENT) https://christianbsmart.com/unknown-unknowns-
With transparency, project manager will spend all and-project-risk/
available funds, this accounts for that tendency
26Presented for the ICEAA 2021 Online Workshop - www.iceaaonline.com
WHAT CAN BE DONE
THREE KEYS TO SUCCESS
1: RECOGNIZE THE 2: MEASURE RISK MORE 3: MANAGE RISK
PROBLEM ACCURATELY EFFECTIVELY
Recognize that lack of planning for risk hinders Projects need to manage risk, not just
Recognize that risk is underestimated, especially
projects success measure it
early in planning
Don’t plan for best case Need a measure of risk plus ways to address
Quantitative risk measurement is a necessity –
Realize that you are prone to biases such as significant growth
matrices and qualitative methods are not
optimism – don’t drink the Kool-Aid! Calculate risk at the portfolio level
enough!
Look for independent and critical input Assess the impact of potential new missions
Use methods such as calibration to ensure
realism over a long time
Measure risk coherently – S-curves are not Think strategically
sufficient! Take the right tail into account
Projects must do things differently in risk management if they want to be more successful
27Presented for the ICEAA 2021 Online Workshop - www.iceaaonline.com
WHAT IS THE POINT?
UNDERSTANDING CONTEXT:
THE HEART OF RISK
MANAGEMENT
Urban Legend: NASA spent millions to design a pen to
write in low gravity environments while Russian
cosmonauts used a pencil – the story is not exactly true Risk management is
(e.g., pencils are flammable) but it provides a valuable not about avoiding
lesson: risk management also entails looking at the risk but
outcome you want to achieve and finding low risk way to understanding it in
achieve it. order to maximize
the odds of success.
28Presented for the ICEAA 2021 Online Workshop - www.iceaaonline.com
ABOUT THE AUTHOR
• Chief Scientist with Galorath Federal
• Former Cost Director for Missile Defense
Agency
• Twenty years of experience with cost and
schedule risk analysis, predictive
analytics, probabilistic reliability analysis,
and machine learning
• Exceptional public service medal from
NASA
• Named Parametrician of the Year by the
International Society of Parametric
Analysts
• Ph.D. in Applied Mathematics
• Contact: csmart@galorath.com
29You can also read