Beyond Weather Time-Scale Prediction for Hurricane Sandy and Super Typhoon Haiyan in a Global Climate Model
←
→
Page content transcription
If your browser does not render page correctly, please read the page content below
524                                        MONTHLY WEATHER REVIEW                                                             VOLUME 143

Beyond Weather Time-Scale Prediction for Hurricane Sandy and Super Typhoon Haiyan
                           in a Global Climate Model

      BAOQIANG XIANG,* SHIAN-JIANN LIN,1 MING ZHAO,* SHAOQING ZHANG,1 GABRIEL VECCHI,1
                 TIM LI,# XIANAN JIANG,@ LUCAS HARRIS,1 AND JAN-HUEY CHEN*
             * NOAA/Geophysical Fluid Dynamics Laboratory, Princeton, New Jersey, and University Corporation for
                                              Atmospheric Research, Boulder, Colorado
                               1
                                 NOAA/Geophysical Fluid Dynamics Laboratory, Princeton, New Jersey
                #
                  International Pacific Research Center, Department of Meteorology, University of Hawai‘i at Manoa,
                                                          Honolulu, Hawaii
             @
               Joint Institute for Regional Earth System Science and Engineering, University of California, Los Angeles,
                                                        Los Angeles, California

                                 (Manuscript received 13 July 2014, in final form 27 August 2014)

                                                            ABSTRACT

               While tropical cyclone (TC) prediction, in particular TC genesis, remains very challenging, accurate pre-
            diction of TCs is critical for timely preparedness and mitigation. Using a new version of the Geophysical Fluid
            Dynamics Laboratory (GFDL) coupled model, the authors studied the predictability of two destructive
            landfall TCs: Hurricane Sandy in 2012 and Super Typhoon Haiyan in 2013. Results demonstrate that the
            geneses of these two TCs are highly predictable with the maximum prediction lead time reaching 11 days. The
            ‘‘beyond weather time scale’’ predictability of tropical cyclogenesis is primarily attributed to the model’s
            skillful prediction of the intraseasonal Madden–Julian oscillation (MJO) and the westward propagation of
            easterly waves. Meanwhile, the landfall location and time can be predicted one week ahead for Sandy’s U.S
            landfall, and two weeks ahead for Haiyan’s landing in the Philippines. The success in predicting Sandy and
            Haiyan, together with low false alarms, indicates the potential of using the GFDL coupled model for
            extended-range predictions of TCs.

1. Introduction                                                      Atlantic City, New Jersey, late on Monday evening, 29
                                                                     October. Sandy was the second most expensive Atlantic
  Tropical cyclones (TCs) are one of the most common
                                                                     TC in history, causing over $60 billion (U.S. dollars) in
and devastating natural disasters that result in serious
                                                                     damage, and claimed 147 lives in Jamaica, Cuba, Haiti,
impacts on marine activities and coastal communities.
                                                                     the Dominican Republic, Puerto Rico, the Bahamas,
Two intense landfall TCs—Sandy in 2012 and Haiyan in
                                                                     the United States, and Canada (Blake et al. 2013).
2013—have received great attention given their severe
                                                                     Sandy was the largest Atlantic TC since those records
damages and the resultant enormous losses (Blake et al.
                                                                     began on 1988, causing wind damage as far inland as the
2013; Malakoff 2012; Lander et al. 2014).
                                                                     Indiana shore of Lake Michigan (Blake et al. 2013).
  On 21 October 2012, the storm that would become
                                                                     Despite its impact and size, Sandy was only a minimal
Hurricane Sandy formed over the central Caribbean.
                                                                     category 1 hurricane upon landfall and had been un-
The incipient Sandy moved northward over Jamaica on
                                                                     dergoing extratropical transition into a midlatitude
24 October, over Cuba the following day, and continued
                                                                     cyclone.
migrating northward thereafter. After passing near Ber-
                                                                       Much more intense, and much deadlier, was Super
muda, Sandy curved northwestward and made landfall
                                                                     Typhoon Haiyan, which occurred just over a year after
along the densely populated U.S. Atlantic coast near
                                                                     Sandy. Haiyan formed in the western North Pacific
                                                                     (WNP) on 3 November 2013, and a few days later un-
  Corresponding author address: Baoqiang Xiang, GFDL, UCAR,
                                                                     derwent a rapid intensification. It first affected the Fed-
201 Forrestal Rd., Princeton, NJ 08540.                              erated States of Micronesia and Palau. Satellite estimates
E-mail: baoqiang.xiang@noaa.gov                                      indicated a storm with 1-min sustained winds possibly as

DOI: 10.1175/MWR-D-14-00227.1

Ó 2015 American Meteorological Society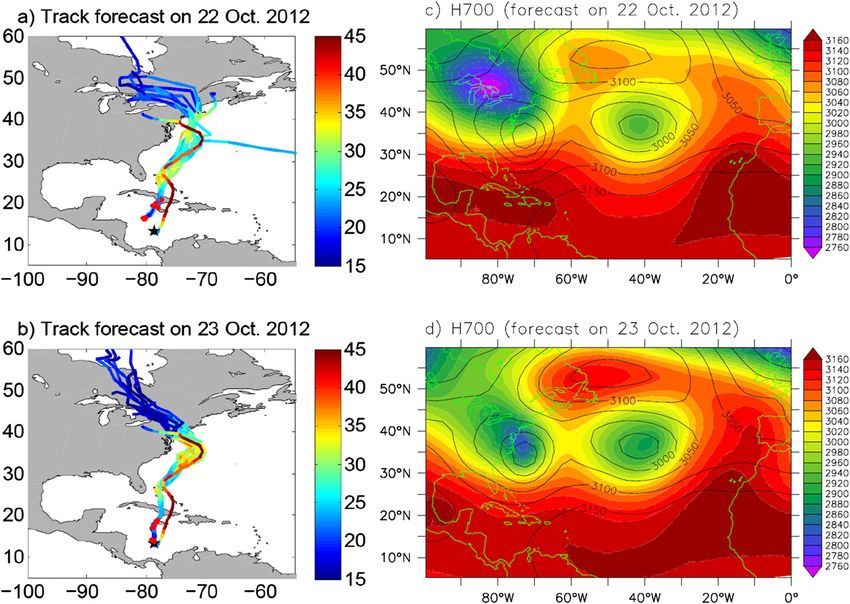
FEBRUARY 2015                                     XIANG ET AL.                                                      525

high as 87.5 m s21 on 7 November (Lander et al. 2014),        the data lag for incorporating 2013 seasonal data into
before making a cataclysmic landfall near Guiuan, east-       IBTrACS, the track data for Typhoon Haiyan are
ern Samar. Haiyan then crossed the Philippines, mi-           obtained directly from the Regional Specialized Meteo-
grated westward into the South China Sea, and made            rological Center in Tokyo (http://www.jma.go.jp/jma/
its landfall in Vietnam as a weak TC. This storm cau-         jma-eng/jma-center/rsmc-hp-pub-eg/trackarchives.html).
sed more than 6000 deaths and left 14 million affected.       For comparison with Sandy-induced precipitation and
(http://reliefweb.int/sites/reliefweb.int/files/resources/    snowfall, we use the observed daily rainfall databased on
HB-AP-2013.FINAL__0.pdf) Typhoon Haiyan reached               the Tropical Rainfall Measuring Mission (TRMM) ver-
a category 5–equivalent super typhoon on the Saffir–          sion 3B42 (Huffman et al. 1995), and daily snowfall
Simpson hurricane wind scale as the strongest TC in 2013      analysis data from the National Operational Hydrologic
and also the strongest TC at landfall on world record         Remote Sensing Center.
(Lander et al. 2014).                                            A new version of GFDL coupled model was
   Previous studies have primarily focused on track           employed in this study, which is similar to the Forecast-
predictions only after tropical cyclogenesis has oc-          Oriented Low Ocean Resolution (FLOR) version
curred, and prediction skill has been steadily increasing     (Vecchi et al. 2014) of GFDL CM2.5 (Delworth et al.
in recent decades. For example, the Atlantic basin TC         2012). The main difference between the new model and
track error has been reduced substantially from around        FLOR is the convection scheme in the atmospheric
400 km in the 1970s to around 100 km in the early 2010s       model. Based on the GFDL High Resolution Atmo-
with respect to the 3-day lead forecast (http://www.nhc.      spheric Model (HiRAM) with a single convective plume
noaa.gov/verification/verify5.shtml). For Hurricane Sandy,    (Zhao et al. 2009), the new convection scheme in-
the European Centre for Medium-Range Weather Fore-            troduces an additional bulk plume to represent deep
casts (ECMWF) made a successful prediction of the TC          convection [referred to as a double-plume convection
ashore one week ahead (Kerr 2012). The U.S. models in         (DPC) scheme]. More details about the convection
general showed less skill in predicting the landfall for      scheme and its performance in climate simulations are
Sandy than the ECMWF model (Blake et al. 2013).               referred to in M. Zhao et al. (2015, unpublished manu-
   Our knowledge about cyclogenesis is severely limited       script). The ocean model horizontal resolution is about
in understanding whether an observational tropical            18, and the atmospheric model has a roughly 50-km
disturbance will evolve into a full TC or not although        horizontal grid spacing and 32 vertical levels, formulated
some progresses have been achieved recently (e.g., Fu         on a ‘‘cubed sphere’’ grid described on 6 sides of a cube
et al. 2012; Peng et al. 2012). Thus, cyclogenesis pre-       projected onto a sphere (Putman and Lin 2007).
diction is still a challenging task that remains an area         The initial conditions are obtained through a simple
requiring considerable additional research. Up to now,        nudging method. The atmospheric nudging fields in-
the Joint Typhoon Warning Center (JTWC) only pro-             clude winds, surface pressure, geopotential height, and
vides 24-h TC genesis forecast for the western Pacific        temperature using the National Centers for Environ-
and Indian Oceans, and the National Hurricane Center          mental Prediction (NCEP) Global Forecast System
(NHC) provides 48-h and 5-day experimental TC gen-            (GFS) analysis data (;28 km, 6-h interval) as used
esis probability forecast for other basins including the      in Chen and Lin (2013) for seasonal hurricane pre-
Atlantic and eastern Pacific.                                 dictions. Following Zhang et al. (2014), the sea surface
   Geophysical Fluid Dynamics Laboratory (GFDL)               temperature (SST) is nudged to National Oceanic and
global climate models have been used for seasonal fore-       Atmospheric Administration (NOAA) Optimum In-
cast for TC genesis with significant prediction skill (Chen   terpolation 1/ 4 Degree Daily SST Analysis (OISST, v2)
and Lin 2013; Vecchi et al. 2014), while its capability in    (Reynolds et al. 2007). The nudging time scale is 6 h for
predicting an individual TC has not been studied yet. In      atmospheric variables and 1 day for SST. The coupled
this study, a new version of the GFDL coupled model is        model is spun up with the observed atmospheric and
used to explore the predictability of individual TC (Sandy    SST conditions from 1 January 2010 to October 2012
and Haiyan), and demonstrate the potential of this model      and October 2013 to generate the initial conditions for
for extended-range TC prediction.                             predicting Sandy and Haiyan. Initial conditions are ar-
                                                              chived each hour. Each ensemble is integrated forward
                                                              one month for prediction.
2. Data, model, and methodology
                                                                 A simple tracking scheme is adopted using pri-
  The observational TC data before 2013 are from the          marily the sea level pressure (SLP) to detect TCs
International Best Track Archive for Climate Stewardship      (L. Harris et al. 2015, unpublished manuscript). We
(IBTrACS) version v03r05 (Knapp et al. 2010), and given       have compared the results by using another tracking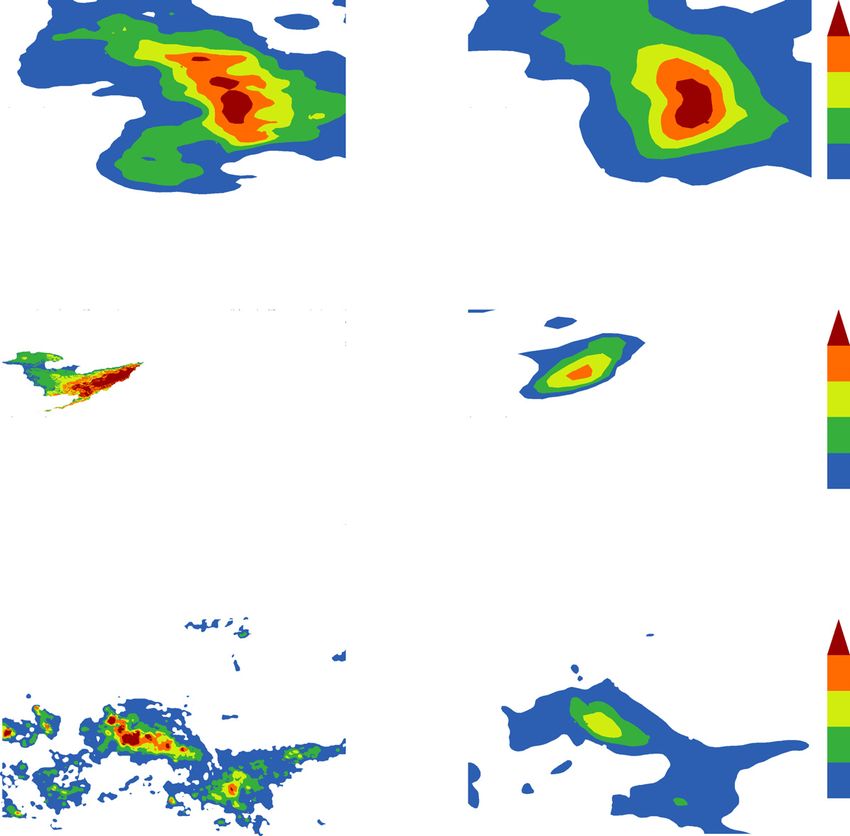
526                                       MONTHLY WEATHER REVIEW                                                     VOLUME 143

                     FIG. 1. Annual tropical cyclogenesis density (shading in number per year) in (a) observations
                  (1983–2012), (b) AMIP-like runs with daily SST nudging forcing, and (c) fully coupled runs.
                  Cyclogenesis is defined as the mean number per 58 (longitude) 3 48 (latitude) box per year. The
                  black dots show the genesis location during 15 Oct to 14 Nov when Tropical Cyclones Sandy and
                  Haiyan formed. A total of 30 years of data are used here. Here only the tropical cyclones with
                  lifetimes of at least 3 days are shown.

scheme (Zhao et al. 2009) and the results remain very              experiments. The annual mean TC counts in AMIP-like
similar.                                                           and fully coupled runs are 80.8 and 79.8, respectively, in
                                                                   great agreement with the observed value of 81.1 per
3. Results                                                         year. Note that the TCs with lifetimes less than 3 days
                                                                   were excluded. The most apparent bias is more cyclo-
a. Climatological tropical cyclogenesis in the model
                                                                   genesis over the Eastern Hemisphere but less over the
   Before examining model prediction skill for Sandy               Western Hemisphere (Fig. 1). In the fully coupled run,
and Haiyan, it is informative to investigate the model’s           considerable bias is seen over the WNP with the maxi-
general performance in simulating climatological tropi-            mum center expanding far more eastward (Fig. 1c).
cal cyclogenesis especially during the latter portion of           Additionally, compared with both the observations and
TC season. Figure 1 depicts the climatology of tropical            AMIP-like run, the genesis density is lower over the
cyclogenesis for a 30-yr period from observations, an              western North Atlantic but more over the southern
Atmospheric Model Intercomparison Project (AMIP)-                  Atlantic in the coupled simulation.
like simulation, and a fully coupled simulation. Here the            Since Hurricane Sandy and Super Typhoon Haiyan
‘‘AMIP-like’’ simulation is referred to a coupled run but          were generated during the latter portion of their TC
with daily SST nudging to observations from 1984 to                seasons, special attention was paid to the period from
2013. In general, the genesis location and density agree           15 October to 14 November (black dots in Fig. 1). It is
reasonably well with observations in both of these                 noted that the coupled run produces very few TCs
FEBRUARY 2015 XIANG ET AL. 527
FIG. 2. The 5- and 10-day lead forecasts for the geneses of Sandy and Haiyan with 25 ensemble members for each
daily prediction. Blue (gray) lines represent the observed (predicted) TC track. Black stars (red dots) show the
observed (predicted) genesis locations.
over the Caribbean Sea within 30 years (Fig. 1c), depicts the 5- and 10-day lead forecast results, where 25
while this is much improved in the AMIP-like run members are used for each day. For example, the cy-
despite the northward displacement of genesis loca- clogenesis time for Sandy (when it became a tropical
tion (black dots in Fig. 1b). Over the WNP, both the storm) was found at 1200 UTC 22 October 2012. For the
fully coupled and AMIP-type runs produced more 5-day lead forecast the initial conditions for these 25
TCs to the east of 1708E. However, less TC genesis is ensemble members were produced with the coupled sys-
evident over the region west of 1408E. As expected, tem nudging from 0000 UTC 17 October to 0000 UTC 18
the AMIP-type run performs better in simulating cy- October (one forecast every hour). The ‘‘correct’’ pre-
clogenesis because of the better mean state, which diction is counted by the cyclogenesis within 1.5 days
justifies the mean state (SST) adjustment for seasonal around the observed genesis time (a 3-day window).
prediction (Vecchi et al. 2014). For the short-term Here, we define cyclogenesis as the time when the cyclone
prediction, however, the SST nudging would be suit- reaches tropical storm status [with winds .17.5 m s21
able as the mean state is not expected to drift much in observations and 15.2 m s21 in the model following
from the initial conditions. Zhao et al. (2009)] rather than tropical depression
because the time at which the tropical depression
b. Cyclogenesis prediction
forms varies considerably among ensemble members.
The above results illustrate the capability of the In other words, more TCs formed beyond the correct
GFDL model in simulating the climatology of tropical time window if the genesis time is defined as the TC
cyclogenesis. Given this, a series of hindcast experi- first reaching tropical depression. However, the con-
ments are made for both Sandy and Haiyan. Figure 2 clusions will not change since the time difference for528 MONTHLY WEATHER REVIEW VOLUME 143
a disturbance becoming a tropical depression com-
pared to a tropical storm is usually within one day of
each other.
Figure 2 shows that most of the members produce
‘‘Sandy like’’ and ‘‘Haiyan like’’ TCs with their genesis
locations slightly to the north or northeast of the ob-
servations for both the 5- and 10-day lead forecasts. The
location biases to a certain degree reflect the systematic
bias of the model as shown in Fig. 1. The genesis loca-
tions are rather concentrated for different ensemble
members, indicative of the high predictability of cyclo-
genesis for these two cases.
To quantitatively measure the cyclogenesis pre-
diction skill, a traditional verification statistics,
namely, probability of detection (POD, or named hit
rate) is used here. As mentioned above, we use a cor-
rect prediction time window, 1.5 days around the ob-
served genesis time. We use spatial limits of 600, 700,
and 800 km for 5-, 6-, and 7-day lead forecasts, re-
spectively, and 900 km for 8- to 13-day lead forecasts.
Meanwhile, the early and late genesis cases are de-
fined as the cyclone numbers 1.5 days before and 1.5
days after the correct prediction time window, but
with the same spatial limits as the correct forecasts.
For example, for the 5-day lead forecast, 25 ensemble
members predict 12 cases during the 3-day correct
forecast window, and 8 cases during 1.5 days before
and after the correct forecast window. Thus, the POD FIG. 3. Measure of prediction skill for (a) Sandy and (b) Haiyan.
is 48.0% (12/25), and the early/late genesis ratio is Red and blue bars represent the probability of detection (POD)
32.0% (8/25). From the 5- to 11-day lead forecast, the and early/late genesis ratio, respectively. A total of 25 members are
POD is all above 60% for both Sandy and Haiyan used for each daily prediction.
(Fig. 3). The skill drops dramatically for the 12- and
13-day lead forecasts. Meanwhile, there are some early/ of our model in predicting the tropical cyclogenesis
late genesis cases for Sandy for the 7–13-day lead forecasts, during the latter TC season.
implying that the model still has some skill in predicting
c. Understanding the predictability source of
the Sandy genesis for the 12- and 13-day lead forecasts. In
cyclogenesis
contrast, there are only a few early/late genesis cases for
Haiyan for the 10- and 11-day lead forecasts. The above The U.S. National Weather Service issues medium-
results suggest that the geneses of these two TCs are range weather forecasts over the next 3–7 days and
highly predictable for a lead time of at least 11 days, extended-range forecasts for 6–10 and 8–14 days. By
a time scale slightly beyond the medium-range weather contrast, the definition of medium-range forecasts from
time scale (;7–10 days). the World Meteorological Organization (WMO) is
During 21–23 October 2012, there were four TCs 7–10 days, and 10 days up to 1 month for extended-range
worldwide including Sandy that provided additional op- forecasts. The beyond weather (or extended range) time
portunities to test the validity of our methodology and scale is usually thought to be a difficult time range for
model performance (Fig. 4). In addition to Sandy, the prediction, as it is sufficiently long for the atmosphere to
geneses of the other three TCs are also skillfully pre- lose its memory from initial condition and probably too
dicted with at least a 6-day lead time, and this included short for oceanic variability to provide a predictability
a weak TC over the Arabian Sea that can even be pre- source (Vitart 2014). However, some low-frequency
dicted 10 days in advance (not shown). Intriguingly, the variability modes in the atmosphere–ocean coupled
model produces very few false alarms spatially (Figs. 4a,b), system may provide a predictability source for cyclo-
which is another crucial aspect in measuring the skill of genesis, such as the intraseasonal Madden–Julian oscil-
TC prediction. These results suggest the great potential lation (MJO; Fudeyasu et al. 2008; Fu and Hsu 2011;FEBRUARY 2015 XIANG ET AL. 529
FIG. 4. The 5-day lead prediction for the geneses of (a) Sandy and (b) Haiyan. Blue and gray
lines show the track for observation and prediction, respectively. Black stars (red dots) rep-
resent the observed (predicted) tropical cyclogenesis locations.
Vitart 2009, 2010; Belanger et al. 2010; Elsberry et al. One distinct difference between these two cases is that
2010), tropical waves (Frank and Roundy 2006), and the pronounced lower-level convergence is apparent over
persistent SST anomaly (Leroy and Wheeler 2008). the WNP (around 1508E), but not over the Caribbean Sea
As the most dominant intraseasonal mode over the (Fig. 5). The presence of the large-scale confluent flow
tropics, MJO has long been revealed to have a tight associated with MJO in the WNP may favor the energy
relationship with cyclogenesis (Liebmann et al. 1994; accumulation of easterly waves as well as the formation of
Maloney and Hartmann 2000; Mo 2000; Camargo et al. TCs (Tam and Li 2006). The model predicts well the low-
2009; Jiang et al. 2012; Diamond and Renwick 2014). level wind and precipitation prior to the Sandy and
The extended-range TC predictability might be con- Haiyan genesis (Figs. 5b and 5d), suggesting that the
ceived in the skillful prediction of MJO. We examined skillful prediction of MJO may play a prominent role on
the MJO signals before the Sandy and Haiyan genesis by the successful predictions of Sandy and Haiyan.
using a 20–100-day bandpass-filtered data for observa- Yet, it should also be noted that the MJO usually
tions and 7-day running mean data for model prediction exhibits a larger spatial scale and longer time scale than
(after removing its 1-month mean). As shown in Fig. 5a, TCs. A successful prediction of an active phase of the
before Sandy genesis, strong intraseasonal westerly MJO provides a wide time window and a large spatial
wind prevailed over the northeastern Pacific and south area favoring the tropical cyclogenesis. However, our
Caribbean Sea accompanying pronounced precipitation model prediction illustrated that the predicted genesis
mainly over the Caribbean Sea, representing a typical timing was in a narrow time window, and the locations
active phase of MJO over this region (Maloney and were rather concentrated and close to the observed
Hartmann 2000). Before Haiyan genesis, enhanced genesis location for the majority of the predicted cy-
precipitation was apparent over the WNP but sup- clogenesis (Fig. 2). This indicates that some other factors
pressed precipitation was over the Maritime Continent may work cooperatively for skillful prediction of cyclo-
and the north Indian Ocean (Fig. 5c), suggesting a typi- genesis. Although there are substantial differences for
cal phase 5 of boreal summer MJO mode (Waliser et al. the precursor disturbance between the Atlantic and
2009). How does MJO influence the cyclogenesis? In- WNP, easterly waves act as one common factor trig-
creased low-level absolute vorticity and the moistening gering the TC development in these two basins (e.g.,
of the midtroposphere due to enhanced surface heat flux Landsea 1993; Ritchie and Holland 1999; Belanger et al.
and convection, were argued to facilitate the cyclogen- 2010; Li 2012). The TC genesis associated with easterly
esis (Maloney and Hartmann 2000; Camargo et al. 2009). waves usually tends to occur near the intersection of the530 MONTHLY WEATHER REVIEW VOLUME 143
FIG. 5. Observed and predicted MJO signals before Sandy and Haiyan genesis. (a) The 20–100-day filtered pre-
cipitation (shading, mm day21) and 850-hPa winds (vectors, m s21) averaged over 18–21 Oct 2012. Precipitation is
from TRMM data and winds are from NCEP analysis data. (b) Predicted MJO signal during 18–21 Oct 2012 for
10-day lead forecast for Sandy genesis with initial condition roughly on 12 Oct 2012. For model prediction, the MJO
signal is obtained by using 5-day running mean after removing the corresponding 1-month mean in prediction. (c),(d)
As in (a),(b), but for Haiyan prediction (31 Oct–3 Nov 2013).
critical surface and the trough axis of the precursor formed. Along the easterly wave track, another reason
parent wave according to the so-called marsupial theory for the genesis location in the Caribbean Sea and WNP
(Dunkerton et al. 2009; Wang et al. 2009). The westward (near 1508E) rather than in their eastern part is the
propagation of easterly waves offers predictability for relatively stronger mean vertical wind shear and cooler
the TC genesis. The 3–8-day bandpass-filtered 700-hPa SST in the eastern Atlantic and eastern Pacific.
meridional wind averaged over 58–178 clearly features Here we did not emphasize the possible role of SST
the easterly wave couplets starting from the west coast for the geneses of these two TCs based on the following
of Africa on around 11 October 2012 and propagating reasons. Before Sandy’s genesis, about 0.28C SST warming
westward into the Caribbean Sea (Fig. 6a). The 10-day was found over the south Caribbean Sea. This is due to the
lead forecast can reasonably predict the propagation of MJO variability as the anomalous intraseasonal westerly
easterly waves (Fig. 6c), leading to the genesis of wind (Fig. 5a) is against the climatological mean easterly
‘‘Sandy’’ after reaching the convective center related to wind so as to reduce the mean evaporation. From late June
MJO (Fig. 5a). Similarly, the external forcing from of 2013, pronounced SST warming (.0.38C) was seen over
a train of Pacific easterly waves, manifested as wave the western Pacific including the region of Haiyan’s gen-
couplets in the 850-hPa meridional wind, was also cru- esis. It lasted for several months and thus should be ex-
cial in triggering the Haiyan’s genesis although the cluded as the direct factor driving the Haiyan genesis.
predicted easterly waves were weaker than what was
d. Trajectory and landfall prediction
observed (Figs. 6b,d). The Pacific easterly waves prop-
agate into the convective region associated with MJO For Typhoon Haiyan, the model predicted a reason-
(west of 1708E) and stall for about two days before a TC able westward trajectory in forecasts initialized at both 5FEBRUARY 2015 XIANG ET AL. 531
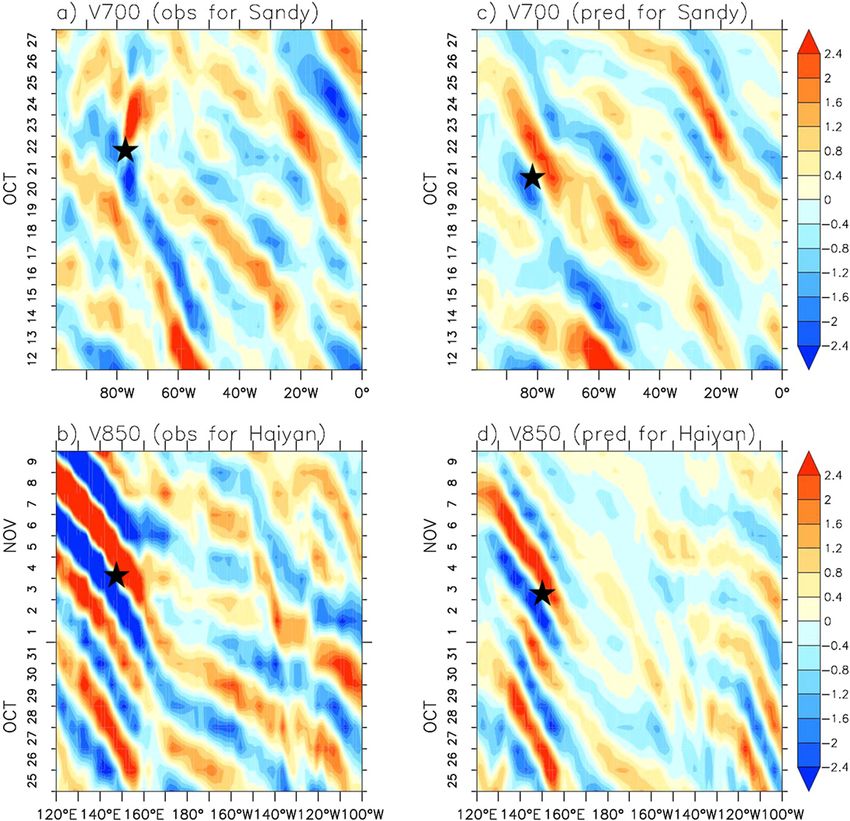
FIG. 6. Observed and predicted easterly waves for Sandy and Haiyan. The 700-hPa meridional winds (58–178N)
from (a) observations and (c) ensemble mean of model prediction on 12 Oct 2012. The 850-hPa meridional winds (58–
108N) from (b) observations and (d) ensemble mean of model prediction on 25 Oct 2013. Black stars show the
approximate cyclogenesis. Here a 3–8-day bandpass filter is applied to the wind data, while for prediction, the ob-
served data are used before the prediction starting time. A wave propagation feature is more apparent at 850 hPa
than that at 700 hPa for Haiyan (not shown).
and 10 days prior to its genesis despite a systematic suggesting that the model completely loses all skill in
northward bias (Fig. 2). Meanwhile, most of the en- predicting the actual trajectory.
semble members show the landfall time in Samar, The predicted northwestward curvature of Sandy in
Philippines, on 7 November 2013 for both 5- and 10-day the midlatitudes continues to pose a great forecasting
lead forecasts, implying that the model has the capa- challenge. With the initial conditions before the ob-
bility to predict its first landfall with a lead time of served genesis, this model was not able to predict this
about two weeks. For Hurricane Sandy, the 5-day lead northwestward turn as well as the final landfall into the
forecast predicted a reasonable northward movement United States. However, the successful prediction can
crossing Cuba as a typical storm trajectory in the latter be achieved with initial condition on 22 October 2012
TC season over this region, but failed to predict its after its genesis despite the slightly northward landfall
northwestward curvature toward the northeastern location (Fig. 7a). The atmospheric nudging is applied
United States. The 10-day lead forecast exhibited a di- beyond a radius of 300 km and we use a ‘‘bogus’’ method
verse track with most of the ensemble members pre- to incorporate the observational SLP associated with
dicting a westward trajectory to the Gulf of Mexico, Sandy (from IBTrACS) into the 300-km radius area532 MONTHLY WEATHER REVIEW VOLUME 143 FIG. 7. Track forecast of Sandy on (a) 22 Oct and (b) 23 Oct 2012. A total of 12 ensemble members are used here. The observational Sandy genesis is marked by black star. (c),(d) The corresponding 700-hPa geopotential height from observations (contours) and model prediction (shading) during 28–29 Oct 2012 when Sandy made its landfall. near the TC center before the real forecast. The reason the 20–100-day intraseasonal variability (ISV). It gives we did not use the NCEP analysis data nudging near the a clue that the predictability source for the landfall TC center is due to the fact that the assimilation of at- of Sandy may also come from the ISV, which may also mospheric data tends to filter out small-scale perturba- be linked to the tropical MJO-forcing effect (Cassou tions, prohibiting the potential development of TCs in 2008). the model (Zhang et al. 2014). The bogus method is only While the landfall location for Sandy was in New suggested to use for prediction after TC genesis. With Jersey, the maximum precipitation associated with the initial condition on 23 October, almost all the Hurricane Sandy and its extratropical remnants were members are capable of predicting its landfall location observed near southern Maryland and Delaware for 27– on New Jersey (Fig. 7b) as well as the landfall time on 31 October 2012 (Blake et al. 2013). The predicted late 29 October or early 30 October. The northwestward precipitation pattern is very similar to observations with curvature is mainly driven by a high pressure system a maximum over 200 mm (8 in.) (Fig. 8b). Of particular over the northwestern Atlantic Ocean (Barnes et al. interest is that the model does very well in predicting the 2013). The model can well predict this high center near pattern of the tropical cyclone–induced snowfall that 558N, 508W (Figs. 7c,d), leading to the successful landfall occurred over West Virginia and Pennsylvania but with prediction for Sandy. The track prediction skill is com- underestimated amplitude (Fig. 8d). We also examine parable with the ECMWF forecast results (Kerr 2012). the precipitation associated with Haiyan, and the model The anomalous high in the North Atlantic actually re- can predict the precipitation reasonably well with two flects one component of a strong negative phase of weeks lead time, although the maximum center shifts North Atlantic Oscillation (NAO). Further analysis northward together with weakened magnitude (Figs. 8e,f). shows that the NAO-related winds largely stems from These results are encouraging.
FEBRUARY 2015                                                  XIANG ET AL.                                                                        533

  FIG. 8. (a) Observed (five gridpoint smoothed) and (b) predicted precipitation (in.) associated with Hurricane Sandy and its extratropical
remnants during 27–31 Oct 2012, with initial condition on 23 Oct 2012. (c),(d) As in (a),(b), but for snowfall (in.) during 28–31 Oct 2012. (e) Observed
and (f) predicted precipitation (in.) associated with Super Typhoon Haiyan during 6–8 Nov 2013 with an initial condition on 25 Oct 2013.

4. Conclusions and discussion                                                initialization. Results show that the geneses of both TCs
                                                                             can be well predicted with a lead time of 11 days, a skill
  The Superstorm Sandy in 2012 was the largest TC (by                        beyond the medium-range of weather forecasts. Further
area) over the Atlantic basin on record and Haiyan in                        analysis suggests that these two TCs share a similar source
2013 was the strongest landfall typhoon in history. Un-                      of predictability for genesis, which is attributed to the MJO
derstanding the predictability of their genesis has great                    and the westward propagation of easterly waves. The
societal and scientific significance. This study attempts                    landfalls of Sandy and Haiyan can also be well predicted
to reveal the predictability of these two TCs by using                       with one- and two-week lead times, respectively. Although
a new version of the GFDL coupled model system with                          this study focused only on two important cases, it may give
a simple atmospheric and SST nudging method for                              us some confidence using this model for individual TC
534 MONTHLY WEATHER REVIEW VOLUME 143
prediction, especially for those triggered by the MJO and Proc. Natl. Acad. Sci., 110, 15 211–15 215, doi:10.1073/
easterly waves. This study suggests some potential im- pnas.1308732110.
Belanger, J. I., J. A. Curry, and P. J. Webster, 2010: Predictability of
provements of the lead time of current operational fore-
North Atlantic tropical cyclone activity on intraseasonal time
casts and provides useful guidance on extended-range scales. Mon. Wea. Rev., 138, 4362–4374, doi:10.1175/
time-scale TC forecasts, while a larger, statistical sample 2010MWR3460.1.
size is needed to thoroughly evaluate this model. ——, P. J. Webster, J. A. Curry, and M. T. Jelinek, 2012: Extended
A sensitivity test for the impacts of model physics on prediction of North Indian Ocean tropical cyclones. Wea.
Forecasting, 27, 757–769, doi:10.1175/WAF-D-11-00083.1.
TC predictive skills was also performed. The GFDL
Blake, E. S., T. B. Kimberlain, R. J. Berg, J. P. Cangialosi, and J. L.
HiRAM atmospheric model has been demonstrated to be Beven III, 2013: Tropical cyclone report: Hurricane Sandy
one of the best models in simulating and predicting TCs (AL182012) 22–29 October 2012. Tech. Rep. AL182012,
especially over the Atlantic Ocean when forced by ob- NOAA/National Hurricane Center, 157 pp. [Available online
served SST (Chen and Lin 2013; Zhao et al. 2009; Shaevitz at http://www.nhc.noaa.gov/data/tcr/AL182012_Sandy.pdf.]
et al. 2014). Forecasts were also carried out by using the Camargo, S. J., M. C. Wheeler, and A. H. Sobel, 2009: Diagnosis of
the MJO modulation of tropical cyclogenesis using an em-
coupled model but with the HiRAM atmospheric model pirical index. J. Atmos. Sci., 66, 3061–3074, doi:10.1175/
component (retaining exactly the same for other compo- 2009JAS3101.1.
nents and the initialization). The 5-day lead forecast has no Cassou, C., 2008: Intraseasonal interaction between the Madden-
skill (no ensemble members predicting the Sandy-like TC) Julian Oscillation and the North Atlantic Oscillation. Nature,
in predicting the geneses of Sandy mainly because of the 455, 523–527, doi:10.1038/nature07286.
Chen, J.-H., and S.-J. Lin, 2013: Seasonal predictions of tropical
unrealistically strong vertical wind shear over the Carib- cyclones using a 25-km-resolution general circulation model.
bean Sea in the predictions (figure not shown). The im- J. Climate, 26, 380–398, doi:10.1175/JCLI-D-12-00061.1.
proved skill in TC prediction may be attributed to a better Delworth, T. L., and Coauthors, 2012: Simulated climate and
representation of the tropical mean state through adoption climate change in the GFDL CM2.5 high-resolution cou-
of the new DPC cumulus scheme over the single plume pled climate model. J. Climate, 25, 2755–2781, doi:10.1175/
JCLI-D-11-00316.1.
convective scheme as used in HiRAM.
Diamond, H. J., and J. A. Renwick, 2014: The climatological re-
It should be noted that here we use a relatively coarse- lationship between tropical cyclones in the southwest Pacific and
resolution atmospheric model (;50 km) for TC pre- the Madden–Julian Oscillation. Int. J. Climatol., doi:10.1002/
diction and a very simple initialization method (nudging) joc.4012, in press.
compared to operational forecast systems. Thus, our Dunkerton, T. J., M. T. Montgomery, and Z. Wang, 2009: Tropical
cyclogenesis in a tropical wave critical layer: Easterly waves.
forecast experiments show very encouraging results and
Atmos. Chem. Phys., 9, 5587–5646, doi:10.5194/acp-9-5587-2009.
suggest large potential for future operational forecasts. Elsberry, R. L., M. S. Jordan, and F. Vitart, 2010: Predictability of
Given the skillful predictions skill on seasonal to decadal tropical cyclone events on intraseasonal timescales with the
time scales of GFDL coupled models (e.g., Vecchi et al. ECMWF monthly forecast model. Asia-Pac. J. Atmos. Sci., 46,
2014; Jia et al. 2015; Yang et al. 2013), we have increased 135–153, doi:10.1007/s13143-010-0013-4.
confidence to develop and deliver a seamless forecast Frank, W. M., and P. E. Roundy, 2006: The relationship between
tropical waves and tropical cyclogenesis. Mon. Wea. Rev., 134,
model from weather to climate time scales. A more 2397–2417, doi:10.1175/MWR3204.1.
comprehensive assessment of the predictability of cyclo- Fu, B., M. S. Peng, T. Li, and D. E. Stevens, 2012: Developing
genesis and TC track will be conducted based on forecasts versus nondeveloping disturbances for tropical cyclone for-
of more TC events in the future. mation. Part II: Western North Pacific. Mon. Wea. Rev., 140,
1067–1080, doi:10.1175/2011MWR3618.1.
Fu, X., and P. Hsu, 2011: Extended-range ensemble forecasting of
Acknowledgments. The authors appreciate helpful tropical cyclogenesis in the northern Indian Ocean: Modula-
comments from Howard Diamond and they benefit- tion of Madden-Julian Oscillation. Geophys. Res. Lett., 38,
ted from the discussions with Frederic Vitart, Zhuo L15803, doi:10.1029/2011GL048249.
Wang, Xiaosong Yang, and Hiroyuki Murakami. The Fudeyasu, H., Y. Wang, M. Satoh, T. Nasuno, H. Miura, and W. Yanase,
authors acknowledge support from NOAA under 2008: The global cloud-system-resolving model NICAM success-
fully simulated the lifecycles of two real tropical cyclones. Geophys.
Grant NA14OAR4830101 (BX, SJL, GV, and JHC) and
Res. Lett., 35, L22808, doi:10.1029/2008GL036003.
NOAA MAPP Program under Awards NA12OAR4310075 Huffman, G. J., R. F. Adler, B. Rudolf, U. Schneider, and P. R. Keehn,
(BX, MZ, XJ). TL was supported by ONR Grant 1995: Global precipitation estimates based on a technique for
N00014-12-10450. combining satellite-based estimates, rain gauge analysis, and
NWP model precipitation information. J. Climate, 8, 1284–1295,
doi:10.1175/1520-0442(1995)008,1284:GPEBOA.2.0.CO;2.
REFERENCES Jia, L., and Coauthors, 2015: Improved seasonal prediction of tem-
perature and precipitation over land in a high-resolution
Barnes, E. A., L. M. Polvani, and A. H. Sobel, 2013: Model pro- GFDL climate model. J. Climate, doi:10.1175/JCLI-D-14-00112.1,
jections of atmospheric steering of Sandy-like superstorms. in press.FEBRUARY 2015 XIANG ET AL. 535
Jiang, X., M. Zhao, and D. E. Waliser, 2012: Modulation of tropical Reynolds, R. W., T. M. Smith, C. Liu, D. B. Chelton, K. S. Casey, and
cyclones over the eastern Pacific by the intraseasonal vari- M. G. Schlax, 2007: Daily high-resolution-blended analyses
ability simulated in an AGCM. J. Climate, 25, 6524–6538, for sea surface temperature. J. Climate, 20, 5473–5496,
doi:10.1175/JCLI-D-11-00531.1. doi:10.1175/2007JCLI1824.1.
Kerr, R. A., 2012: One Sandy forecast a bigger winner than others. Ritchie, E. A., and G. J. Holland, 1999: Large-scale patterns asso-
Science, 338, 736–737, doi:10.1126/science.338.6108.736. ciated with tropical cyclogenesis in the western Pacific. Mon. Wea.
Knapp, K. R., M. C. Kruk, D. H. Levinson, H. J. Diamond, and C. J. Rev., 127, 2027–2043, doi:10.1175/1520-0493(1999)127,2027:
Neumann, 2010: The International Best Track Archive for LSPAWT.2.0.CO;2.
Climate Stewardship (IBTrACS). Bull. Amer. Meteor. Soc., Shaevitz, D. A., and Coauthors, 2014: Characteristics of tropical
91, 363–376, doi:10.1175/2009BAMS2755.1. cyclones in high-resolution models in the present climate.
Lander, M., C. Guard, and S. Camargo, 2014: Super Typhoon J. Adv. Model. Earth Syst., doi:10.1002/2014MS000372,
Haiyan [in ‘‘State of the Climate in 2013’’]. Bull. Amer. Meteor. in press.
Soc., 95, S112–S114, doi:10.1175/2014BAMSStateoftheClimate.1. Tam, C.-Y., and T. Li, 2006: The origin and dispersion character-
Landsea, C. W., 1993: A climatology of intense (or major) Atlantic istics of the observed tropical summertime synoptic-scale
hurricanes. Mon. Wea. Rev., 121, 1703–1713, doi:10.1175/ waves over the western Pacific. Mon. Wea. Rev., 134, 1630–
1520-0493(1993)121,1703:ACOIMA.2.0.CO;2. 1646, doi:10.1175/MWR3147.1.
Leroy, A., and M. C. Wheeler, 2008: Statistical prediction of weekly Vecchi, G. A., and Coauthors, 2014: On the seasonal forecasting of
tropical cyclone activity in the Southern Hemisphere. Mon. regional tropical cyclone activity. J. Climate, 27, 7994–8016,
Wea. Rev., 136, 3637–3654, doi:10.1175/2008MWR2426.1. doi:10.1175/JCLI-D-14-00158.1.
Li, T., 2012: Synoptic and climatic aspects of tropical cyclogenesis Vitart, F., 2009: Impact of the Madden–Julian Oscillation on
in Western North Pacific. Cyclones: Formation, Triggers and tropical tropical cyclones and risk of landfall in the ECMWF
Control, K. Oouchi and H. Fudeyasu, Eds., Nova Science forecast system. Geophys. Res. Lett., 36, L15802, doi:10.1029/
Publishers, Inc., 61–94. 2009GL039089.
Liebmann, B., H. H. Hendon, and J. D. Glick, 1994: The re- ——, 2014: Evolution of ECMWF sub-seasonal forecast skill scores.
lationship between tropical cyclones of the western Pacific and Quart. J. Roy. Meteor. Soc., 140, 1889–1899, doi:10.1002/qj.2256.
Indian Oceans and the Madden-Julian Oscillation. J. Meteor. Waliser, D. E., and Coauthors, 2009: MJO simulation diagnostics.
Soc. Japan, 72, 401–411. J. Climate, 22, 3006–3030, doi:10.1175/2008JCLI2731.1.
Malakoff, D., 2012: Scientists assess damage from Sandy’s deadly Wang, Z., M. T. Montgomery, and T. J. Dunkerton, 2009: A
punch. Science, 338, 728–729, doi:10.1126/science.338.6108.728. dynamically-based method for forecasting tropical cyclogene-
Maloney, E. D., and D. L. Hartmann, 2000: Modulation of hurricane sis location in the Atlantic sector using global model products.
activity in the Gulf of Mexico by the Madden–Julian oscillation. Geophys. Res. Lett., 36, L03801, doi:10.1029/2008GL035586.
Science, 287, 2002–2004, doi:10.1126/science.287.5460.2002. Yang, X., and Coauthors, 2013: A predictable AMO-like pattern
Mo, K. C., 2000: The association between intraseasonal oscilla- in the GFDL fully coupled ensemble initialization and de-
tions and tropical storms in the Atlantic basin. Mon. Wea. cadal forecasting system. J. Climate, 26, 650–661, doi:10.1175/
Rev., 128, 4097–4107, doi:10.1175/1520-0493(2000)129,4097: JCLI-D-12-00231.1.
TABIOA.2.0.CO;2. Zhang, S., M. Zhao, S. J. Lin, X. Yang, and W. Anderson, 2014:
Peng, M. S., B. Fu, T. Li, and D. E. Stevens, 2012: Developing Retrieval of tropical cyclone statistics with a high-resolution
versus nondeveloping disturbances for tropical cyclone for- coupled model and data. Geophys. Res. Lett., 41, 652–660,
mation. Part I: North Atlantic. Mon. Wea. Rev., 140, 1047– doi:10.1002/2013GL058879.
1066, doi:10.1175/2011MWR3617.1. Zhao, M., I. M. Held, S.-J. Lin, and G. A. Vecchi, 2009: Simulations
Putman, W. M., and S.-J. Lin, 2007: Finite-volume transport on of global hurricane climatology, interannual variability, and
various cubed-sphere grids. J. Comput. Phys., 227, 55–78, response to global warming using a 50-km resolution GCM.
doi:10.1016/j.jcp.2007.07.022. J. Climate, 22, 6653–6678, doi:10.1175/2009JCLI3049.1.You can also read