BIG TECH DOMINANCE (1): THE NEW FINANCIAL TYCOONS - Paul-Adrien HYPPOLITE Antoine MICHON - Fondapol
←
→
Page content transcription
If your browser does not render page correctly, please read the page content below

Paul-Adrien HYPPOLITE
Antoine MICHON

BIG TECH
DOMINANCE (1):
THE NEW FINANCIAL
TYCOONS

                        December 2018

fondapol.org
2
BIG TECH DOMINANCE (1):
THE NEW FINANCIAL TYCOONS

      Paul-Adrien HYPPOLITE
         Antoine MICHON

                              3
The Fondation pour l’innovation politique
    is a French think tank for European integration and free economy.

                            Chair: Nicolas Bazire
                        Vice-chair: Grégoire Chertok
                  Executive Director: Dominique Reynié
      Chair of Scientific and Evaluation Board: Christophe de Voogd

4
FONDATION POUR L’INNOVATION POLITIQUE
   A French think tank for European integration and free economy

The Fondation pour l’innovation politique provides an independent forum
for expertise, opinion and exchange aimed at producing and disseminating
ideas and proposals. It contributes to pluralism of thought and the renewal
of public discussion from a free market, forward-thinking and European
perspective. Four main priorities guide the Foundation’s work: economic
growth, the environment, values and digital technology.

The website www.fondapol.org provides public access to all the Foundation’s
work. Anyone can access and use all the data gathered for the various surveys
via the platform “Data.fondapol” and the data relating to international
surveys is available in several languages.

In addition, our blog “Trop Libre” (Too Free) casts a critical eye over
the news and the world of ideas. “Trop Libre” also provides extensive
monitoring of the effects of the digital revolution on political, economic
and social practices in its “Renaissance numérique” (Digital Renaissance)
section.

Additionally, reflecting the Foundation’s editorial policy, our blog
“Anthropotechnie” aims to explore new avenues prompted by human
enhancement, reproductive cloning, human/machine hybridization, genetic
engineering and germline manipulation. It contributes to thinking and
debate on transhumanism. “Anthropotechnie” offers articles tackling
ethical, philosophical and political issues associated with the expansion of
technological innovations in the fields of enhancement of human bodies and
abilities.

The Fondation pour l’innovation politique is a state-recognized organization.
It is independent and receives no financial support from any political party.
Its funding comes from both public and private sources. Backing from
business and individuals is essential for it to develop its work.

                                                                                5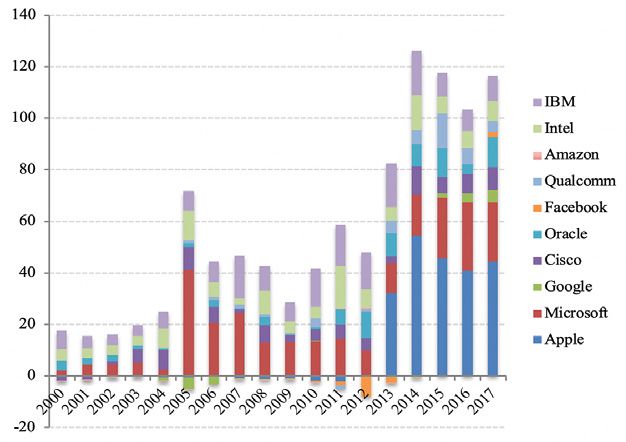
TABLE OF CONTENTS

    INTRODUCTION

        I.	THE TRANSFORMATION OF AMERICAN TECH CHAMPIONS
            INTO GLOBAL ASSET MANAGERS................................................................................................................... 11
     1. Huge reserves of cash sustained by enormous profits............................. 11
     2. Ultra-conservative cash management................................................................................. 19
     3. A lasting and undesirable cash hoarding dynamics...................................... 24

      II.	POSSIBLE SOLUTIONS TO HALT THE “FINANCIALISATION”
           OF BIG TECH FIRMS................................................................................................................................................................ 38
     1.	Speeding up cash distribution through
         greater shareholder involvement in decision-making?............................ 38
     2. Discouraging cash retention through financial regulation?............. 42
     3. Limiting future cash accumulation through taxation?.............................. 44

    CONCLUSION.................................................................................................................................................................................................... 47

    APPENDICES................................................................................................................................................................................................... 49

    REFERENCES................................................................................................................................................................................................. 52

6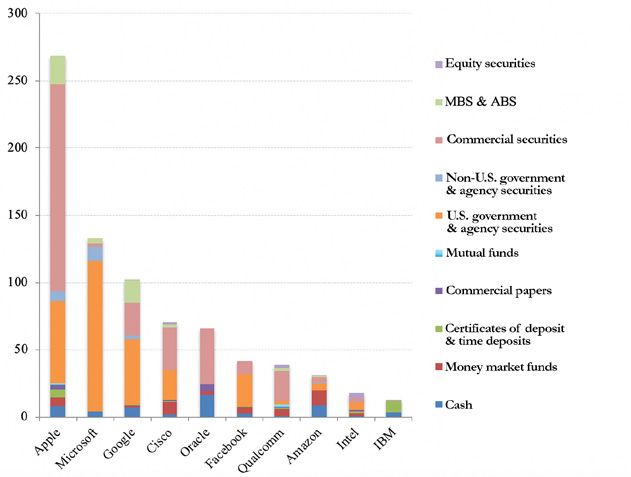
SUMMARY

American big tech companies are either idolised when they launch new
products or vilified for their influence over our everyday lives, massive use of
personal data, and low tax contributions. However, one issue remains largely
concealed – their increasing influence over global finance.
Their unprecedented commercial success over the past twenty years has
enabled them to accumulate huge reserves of cash. In contrast to their image
as first-class innovators, they have chosen to manage this capital in an ultra-
conservative manner. Their corporate treasurers now appear more like low-
risk bond funds managers than working capital managers.
Several solutions exist to curtail this accumulation of cash: (i) increasing
shareholders’ influence over the allocation of profits, thus encouraging
distribution; (ii) imposing restrictions on big tech companies by means of
financial regulation to discourage the retention of cash on their balance sheets;
or (iii) increasing taxes on their profits, thus imposing a de facto limit on their
potential for future hoarding. However, all of these solutions are limited in
that they attack the symptoms and not the cause of the problem – namely
abnormally high profits, which are currently generated more by increasing
monopolisation of key segments of the tech market than by the pursuit of a
rigorous innovation process.
The second section of this paper is entitled Big Tech Dominance (2): A barrier
to technological innovation? It proposes solutions to restore fair competition
in the tech industry.
A French version of this study is also available on the website of the Foundation
for Political Innovation.

                                                                                      7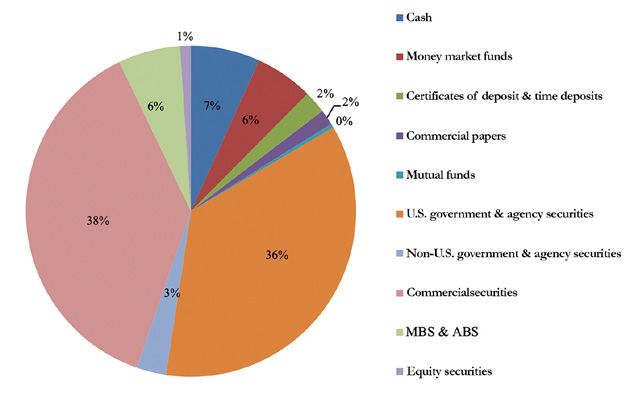
All the graphs and tables in this study were developed from the authors’
    use of public data. The sources used are: companies’ regulatory statements
    to the regulatory authority for financial data (in most cases: the Securities
    Exchange Commission), the Center for Responsive Politics and the European
    Union Transparency Register for lobbying, the websites of the European
    Commission, the Federal Trade Commission and the U.S. Department of
    Justice for antitrust, and the U.S. Patent and Trademark Office for patents.

    This text was written in French by Paul-Adrien Hyppolite and Antoine
    Michon for the Foundation for Political Innovation. The original version is
    available on our website. This version is a translation, by Caroline Lorriaux
    and Michael Scott.

8
BIG TECH DOMINANCE (1):
THE NEW FINANCIAL TYCOONS
Paul-Adrien HYPPOLITE
Corps des Mines engineer and graduate of the École normale supérieure.
He has been a visiting scholar at Harvard University and has worked for a financial advisory firm,
an investment fund, and a private European aerospace company.
Antoine MICHON
Corps des Mines engineer and graduate of the École Polytechnique.
He has worked for a financial data platform, a company specialising in urban mobility solutions,
and a data software company.
INTRODUCTION
Apple, Amazon, Google, Microsoft and Facebook – hidden behind these
familiar names are the top five global market caps at the time of writing. What
do they have in common? They are all American tech companies that have
achieved a degree of supremacy in their sector, which is without precedent in
the modern history of capitalism. This dominance that we see today is partly
the result of innovations, which have in many ways revolutionised our lifestyles
and made a significant contribution to consumers’ and companies’ welfare.
From a consumer perspective, Microsoft and Apple have democratised access
to cutting-edge information technology by speeding up computer development
and precipitating the “smartphone revolution” with the launch of the iPhone
in 2007. Google developed an extraordinary search engine providing quick
and easy access to information and knowledge. The company from Mountain
View also offers a variety of free services that many of us use every day: email
(Gmail), navigation and orientation (Google Maps, Waze), data storage
(Google Drive), collaborative work (Google Doc), etc. Amazon, on the other
hand, offers an incredibly diverse range of goods on its e-commerce platform.
Not satisfied with significantly cutting prices and delivery times by optimising
its operations, the company is on the verge of revolutionising our approach
to shopping. Through their rating and recommendation systems, Google and
Amazon have furthermore considerably increased the quantity and quality of
9information available to consumers who, faced with a wider range of options,
can now make more informed choices. Finally, through its social network and
integrated messaging service, Facebook has simplified virtual communication
and transformed our approach to social relationships.
From a business perspective, the big tech firms have prompted faster
development and even encouraged the emergence of numerous activities.
Google and Facebook enable businesses to easily gain a reputation and target
potential consumers much more precisely and effectively than in the days when
only traditional media (newspapers, radio, television) were available. Apple
and Google have encouraged the development of mobile apps through their
app stores and Amazon has provided outlets for numerous resellers through its
“marketplace”. Cloud services offered by Amazon, Microsoft, Google, Oracle
and IBM allow companies increasingly affordable access to premium quality
back office services (hosting, computing capacity, storage, security, etc.). Finally,
by freely sharing the source code of some of their machine learning tools such
as TensorFlow (Google) or Open Neural Network Exchange (Facebook and
| l’innovation politique
Microsoft), the tech giants appear to foster innovation in artificial intelligence.
However, it does not take an expert to identify the negatives. Firstly, the tech
giants cause a number of major social problems. For instance, an increasing
number of studies point to the negative impact of smartphones and social
media on health, especially among younger people (addiction, frustration,
fondapol
insecurity, depression, etc.) 1. In schools, researchers have also observed that
“connected” students are becoming increasingly distracted. These problems
are becoming so serious that activist shareholders, who one would normally
expect to be purely interested in profits, recently urged Apple to quickly
introduce features enabling parents to more effectively control their children’s
smartphone use 2. In politics, the spread of fake news and, in a broader sense,
the use of social media by foreign powers or ill-intentioned groups as part of
interference strategies, threaten the health of our liberal democracies. Finally,
the big tech firms’ lobbying power raises the issue of their influence over
political and regulatory decisions.
Yet, in addition to these well-documented and widely debated social issues, we
believe that the tech giants’ dominance also raises questions in terms of their
impact on the economy. Facebook and Google clearly enable businesses to
boost their visibility. However, the social benefits of the marketing expenses they
generate are questionable. While experts are warning of a significant downturn
in productivity growth in developed countries, we consumers are seeing
fewer major innovations. For example, it is becoming increasingly difficult
1. Jean M. Twenge, “Have Smartphones Destroyed a Generation” published by The Atlantic in September 2017
(www.theatlantic.com/magazine/archive/2017/09/has-the-smartphone-destroyed-a-generation/534198/).
2. Leslie Hook, “Apple faces activist pressure over children’s iPhone use”, Financial Times, 7 January 2018
(www.ft.com/content/a4a0d8d0-f3fc-11e7-8715-e94187b3017e).
10to distinguish iPhones from other smartphones. And while the tech giants,
especially Google, are continually announcing ultra-ambitious and innovative
projects in development (driverless cars, balloons, drones or satellites designed
to bring high-speed Internet to the world), concrete results are undeniably rare
and often disappointing (e.g. the Google Glass or Facebook Aquila drone). As
such, it is reasonable to question whether the unregulated domination of the
big tech firms is currently hampering innovation in the tech sector and, if so,
what avenues the public authorities could explore to attempt to remedy this.
We will firstly demonstrate how the tech giants’ extraordinary profitability
has resulted in an astounding accumulation of cash that barely finances the
productive economy and does not benefit innovation. In contrast to their
popular image as exceptionally dynamic companies, the big tech firms have
in practice opted for an ultra-conservative capital management strategy.
After exploring a number of potential solutions to counter this cash hoarding
phenomenon, we will frankly address what we believe to be the root cause of
Big Tech Dominance (1): The New Financial Tycoons
the problem, namely an insufficiently intense competition in the tech market.
This will lead naturally to our proposed solutions for restoring a fair degree
of competition in the sector.
THE TRANSFORMATION OF AMERICAN TECH CHAMPIONS
INTO GLOBAL ASSET MANAGERS
1. Huge reserves of cash sustained by enormous profits
In order to identify the companies of interest for this study, we will begin by
comparing the cash position of the main global tech companies at the end
of 2017. In practice, a company’s cash position is a financial portfolio that
typically includes pure cash and bank deposits, but also various types of liquid
securities such as commercial papers, notes, bonds, etc.
a. Extreme concentration of cash
The exponential distribution shown in the graph below highlights an extreme
concentration of cash among a small number of tech companies, which are
mainly American (shown in red on the graph). In fact, the ten richest of these
own seven times more cash than their Chinese counterparts and thirty times
more than their European counterparts. Google 3 alone possesses almost
the same amount of cash as the ten richest Chinese tech giants put together
($102 billion versus $107 billion). Apple holds ten times more cash than the
top ten wealthiest European tech companies ($269 billion versus $25 billion.
3. Here and throughout the paper (unless specified otherwise) ‘Google’ refers to its parent company Alphabet.
11Graph 1: The world’s leading tech companies’ cash positions at the end of 2017 in billions of
dollars (US)
| l’innovation politique
© Fondation pour l’innovation politique, November 2018
The ten richest American tech companies are shown in red. This is a purely
arbitrary limit insofar as we could just as easily have limited ourselves to the
fondapol
top five or extended the selection to the top fifteen. However, we believe that
the top 10 includes the main American tech giants and provides a useful basis
for comparison with their Chinese and European counterparts (cf. Top 10 Tech
China and Top 10 Tech Europe).
At this stage, it is important to point out that we have chosen to limit our
analysis to listed companies as they are subject to regulatory obligations
enabling us to collect standardised, long-term data. Therefore, readers should
not be surprised to find that familiar unlisted tech companies such as Uber or
Airbnb in the United States or Huawei in China 4 are not included. We will
subsequently use the term “Top 10 Tech US” (or “big tech”) to describe the
sample of the richest American tech companies, namely (in descending order):
Apple, Microsoft, Google, Cisco, Oracle, Facebook, Qualcomm, Amazon, Intel
and IBM.
b. Companies with diverse business activities and income sources
It will be quickly apparent to readers familiar with the tech industry that
our sample companies cover a wide range of business activities, namely
4. Those seeking details of the exact composition of Chinese and European company samples (“Top 10 Tech China” and
“Top 10 Tech Europe”) should refer to Appendix 1(a).
12software, electronic equipment, web platforms and services (including cloud
computing) 5. A description of our ten selected tech giants’ activities can be
found in Appendix 1(b).
However, the differences between companies in the sample should not
obscure significant common features. All offer products or services related to
information technology or the Internet and, as we will see later, hold at least
one dominant position in one of their markets. Moreover, they all pursue
business activities on several of the segments mentioned above. For example,
Microsoft is a software developer (OfficeSuite), hosting and computing service
provider (through Microsoft Azure), and electronic equipment producer
(Surface computers and tablets, Xbox consoles, etc.). While Amazon is mainly
known as an e-commerce platform, the company also provides hosting and
cloud computing solutions (through Amazon Web Services) and develops and
markets software integrated in electronic devices (Kindle tablets, Amazon
Echo, etc.).
Big Tech Dominance (1): The New Financial Tycoons
As such, several companies in the sample are in fact much less different than
they may appear. Let us consider three familiar examples: Facebook-Google,
Apple-Google and Amazon-Facebook.
• Facebook and Google offer their users different services, the former as
a social network and the latter as a search engine. However, both rely
on content providers to attract users and their value proposition for
advertisers is similar – namely enhanced targeting of relevant customers.
Both companies’ main income source is therefore online advertising.
• Most of Apple’s profit is generated by designing and marketing cutting-
edge consumer electronic devices, with iPhone sales representing no less
than 62% of the company’s revenues. However, its main competitor,
Google, has a very small share of this market. Its smartphones have
never been a commercial success and their popularity is insignificant
compared to the iPhone. The two companies are in fact locked in battle
on a different front, namely the markets for mobile operating systems
(iOS versus Android) and app stores (App Store vs. Google Play). While
Google has secured itself a quasi-monopoly with other smartphone
producers through its software, Apple is relying on the development of
its own software to maintain its overwhelming margins in the high-end,
cutting-edge consumer electronic device segment.
• Finally, like Facebook, Amazon’s business model is based on accumulating
and processing its users’ data using sophisticated algorithms to create
personalised experiences that encourage them to return to the platform.
5. It should be noted that we have chosen to exclude telecommunications companies such as AT&T and pure service
providers or consulting firms such as Accenture.
13c. Comparing trends for cash and marketable securities over time
We will now examine historic trends in the American tech giants’ cash and
marketable securities. Have these always been at their current record levels?
Between 2000 and 2017, the cash and marketable securities of the Top 10 Tech
US shot up from €64 to €782 billion, representing 16% mean annual growth.
This was particularly pronounced between 2008 and 2017, with 21% mean
annual growth (compared to 10% between 2000 and 2008).
Considering the bigger picture, we decided it would be useful to compare these
amounts with those seen in the oil industry, which includes companies that
are considered to be particularly powerful and rich, and also with those of the
“CAC 37”, which encompasses the main French companies included in the
CAC 40 index (excluding its three banking institutions) 6.
The results speak for themselves, with “Top 10 Tech US” currently holding 3.5
times more cash and marketable securities than “Top 10 Oil” (compared to
1.8 times at the end of 2000) and approximately 2.9 times more than “CAC
| l’innovation politique
37” (compared to 0.7 times at the end of 2000). The growth of cash and
marketable securities among the American tech giants was therefore on a
completely different scale to that of the main traditional companies.
Graph 2: Comparison of cash positions in billions of dollars (US)
fondapol
©Fondation pour l’innovation politique, November 2018
6. See Appendix 1(a) for details of sample composition.
14On closer examination of the dynamics of each company in the Top 10 Tech
US sample, we note that the top 5 now account for 82% of the total cash and
marketable securities (Apple 34%, Microsoft 17%, Google 13%, Cisco 9%
and Oracle 8%) and that the rate of cash growth varies among companies.
For instance, between 2008 and 2017, Facebook’s cash position grew at the
frenetic annual rate of 73%. Apple (31%), Amazon (27%), Google (23%),
Oracle (22%) and Microsoft (21%) are above the mean level, while Intel (5%)
and IBM (0%) are below it.
Graph 3: Cash positions - Top 10 Tech US in billions of dollars (US)
©Fondation pour l’innovation politique, November 2018 Big Tech Dominance (1): The New Financial Tycoons
d. Excess cash
Having noted this meteoric growth in the American tech giants’ cash positions,
we will now examine how this cash was accumulated in the first place. To
that end, we must go back to the profits that fuel them, measuring them in
economic rather than accounting terms in order to discard any non-monetary
items included in income statements. Consequently, the relevant variable is free
cash flow, or cash from operations less capital expenditures (capex). Compared
to the revenues for each period, this indicates a company’s ability to convert its
sales into available liquidity for acquisitions of other companies, shareholder
remuneration, and finally, allocation to cash positions.
15Graph 4: Comparison of free cash flow in percentage of revenues
| l’innovation politique
© Fondation pour l’innovation politique, November 2018
Statistics show us that big tech companies converted 21% of sales into free
cash flow between 2000 and 2017, which, in relative terms, makes them five
times more profitable than the oil giants and the CAC 37 companies, whose
mean proportion was just over 4%. To appreciate the full implications of this
fondapol
observation, it is worth noting that the 20% conversion of sales into free cash
flow in 2017 generated no less than $185 billion. The tech giants’ ability to
sustain this level of performance over the long term is truly remarkable.
However, we must also acknowledge the existence of significant disparities
among the big tech companies. While Facebook, Oracle and Microsoft, for
example, respectively converted 43%, 34% and 32% of their sales into free
cash flow over the course of 2017, Amazon lagged behind at just 4%. This was
due to its business being intrinsically less profitable but also to above-average
capital expenditure levels 7.
In order to understand how the tech giants allocate their profits, we will
break down their free cash flow into its various uses 8. It should generally be
noted that some flows may be negative depending on companies’ divestiture
activities and financing arrangements. Such may be the case, for example, if
they issue more debt or capital than they eliminate by repaying the principal
or repurchasing shares, or if they divest of more businesses than they acquire
through mergers and acquisitions.
7. Therefore, caution is required when interpreting this profitability ratio since a resurgence of capital expenditure
would automatically lower the ratio, even though this may reflect a company’s ability to invest in profitable projects
and thus pave the way to accelerated future growth.
8. To that end, we will examine investment- and financing-related cash flows shown in the cash flow statements
published by the companies in the sample.
16A breakdown of the big tech companies’ free cash flow reveals that despite
their operations being remarkably profitable, the tech giants have issued debt
securities in recent years. We will come back to the reasons for this situation
later. In any event, if we calculate total free cash flow for the 2000-2017 period
and add back negative flows corresponding to (net) resources, the capital
allocation of big tech is as follows: 11% and 46% of “adjusted” free cash
flow was used to finance the acquisition of companies (less divested businesses)
and shareholder distributions (less capital raised) respectively, while 43% was
used to increase the cash positions.
Graph 5: Allocation of free cash flow - Top 10 Tech US in percentage of revenues
Big Tech Dominance (1): The New Financial Tycoons
© Fondation pour l’innovation politique, November 2018
Hence, profits clearly outstrip any requirements in terms of financing new
investments (capital expenditures and mergers and acquisitions) and
shareholder remuneration. Every year, the resulting “residual” financial
surplus, which has no real use in the productive process, augments the cash
positions that we examined earlier.
e. Increasing share of financial assets in the balance sheets
Having analysed cash flows, we will now go back to stocks. We note that by
allocating a significant share of the extraordinary profits generated by their
business activities to their cash positions, the tech giants have prompted a
gradual “financialisation” of assets on their balance sheets. Indeed, while the
cash and marketable securities of the oil giants and the CAC 37 companies as a
percentage of their total assets remained constant on average at approximately
176% and 8% respectively between 2000 and 2017, it rose almost uninterruptedly
for the technology giants, from 26% at the turn of the 21st century to 48%
seventeen years later.
As such, half of the big tech companies’ balance sheet assets now consist of
liquid securities available for sale. Drawing on their operational success, the
American tech giants have now become de facto financial portfolio managers
and seem to edge closer every day to the tacit status of financial institutions.
Graph 6: Comparison of cash positions as a percentage of total assets
| l’innovation politique
fondapol
© Fondation pour l’innovation politique, November 2018
Once again, this average trend masks differences between companies: the
balance sheets of Apple (72%), Qualcomm (59%), Cisco (54%), Microsoft
(53%) and Google (52%) exhibit the highest degree of “financialisation”,
while those of IBM (10%), Intel (15%) and Amazon (24%) are at much more
reasonable levels.
182. Ultra-conservative cash management
Having revealed the extraordinary sums accumulated by big tech companies
in the form of cash and marketable securities, we will attempt to determine
how these are managed. We will show that in contrast to their popular image
as dynamic and innovative companies, the tech giants have in fact opted for
an ultra-conservative capital management strategy.
a. Internal or external management?
Determining how these cash positions are managed is not an easy task, since
most of the companies exhibit limited transparency in this area. However,
some, including Cisco, Oracle and Facebook, state that they outsource cash
management to specialist custodian financial institutions. Others such as Apple
and Google appear to have opted for an internal management strategy. For
instance, the Cupertino-based company set up its own management company,
Braeburn Capital, in Nevada in 2005. Numerous sources concur that its rival
from Mountain View also has its own team of traders. Several job vacancies
Big Tech Dominance (1): The New Financial Tycoons
posted on LinkedIn provide further evidence of this.
b.Increasing maturity of investments
Despite this lack of transparency with regard to management strategies, the
companies’ annual reports combined with their regulatory declarations to
the Securities Exchange Commission (SEC) provide precious details on the
maturity and nature of the assets that make up their cash positions. Firstly,
the distinction between “cash and cash equivalents” and “marketable
securities” gives an indication on their assets’ maturity. In accordance with the
regulatory standards in force, “cash and cash equivalents” are any highly liquid
investments with a maturity date that is up to three months from the purchase
date, while “marketable securities” are any marketable assets available for sale
with a maturity date that is over three months from the purchase date.
Unlike the oil giants and CAC 37 companies, it is apparent that the big tech
invest most of their undistributed cash in financial assets with maturity dates of
over three months 9. Besides, the growth in big tech companies’ cash positions
has been accompanied by a gradual increase in the share of relatively longer
maturity investments (from 55% of total cash in 2007 to over 80% at the end
of 2017).
9. 81% at the end of 2017 versus 25% for the oil giants and 20% for the CAC 37 companies. While Apple and Oracle claim
that the maturity of marketable securities in their portfolios does not exceed five years, the average maturity of their
investments is impossible to estimate as they have disclosed insufficiently detailed financial information.
19Graph 7: Cash positions: cash versus marketable securities - Top 10 Tech US in billions of
dollars (US)
| l’innovation politique
©Fondation pour l’innovation politique, November 2018
Graph 8: Comparison of cash positions - cash versus marketable securities in billions of
dollars (US)
fondapol
© Fondation pour l’innovation politique, November 2018
Graph 9: Marketable securities as a percentage of cash positions
20Big Tech Dominance (1): The New Financial Tycoons
©Fondation pour l’innovation politique, November 2018
These idiosyncrasies suggest that the tech giants currently have no intention
of using these funds to finance investments or distributions, a sign that their
cash positions have reached such high levels that they are no longer used for
business operations.
c. Ultra-conservative management and minimal return
The regulatory declarations that we used to analyse the maturity of big tech
companies’ investments also provide us with information on the various
classes of assets in which they invest. An analysis of the data reveals that “pure”
cash represents a low percentage of the total (7%). In fact, almost 80% of
the aggregated cash position is invested in bonds, half of which are issued by
governments or government-related agencies and half by companies (either
financial or non-financial). This apparent diversification conceals a securities
portfolio with a major emphasis on US sovereign debt. Several companies
clearly appear to adopt an investment policy that excludes investment in
foreign governments’ debt securities, including Facebook whose regulatory
declarations explicitly state this.
21Graph 10: Breakdown of cash positions by asset class - Top 10 Tech US as at the end of
2017
| l’innovation politique
© Fondation pour l’innovation politique, November 2018
However, there are interesting differences regarding investment profiles among
fondapol
big tech companies. For example, Apple, Oracle and Qualcomm stand out for
allocating over 50% of their cash to corporate bonds, while Microsoft and
Facebook use the vast majority of theirs to finance the US government. IBM,
on the other hand, is extremely prudent in its allocation, since almost a third
of its cash position is made of “pure” cash and two-thirds of safe bank debt. In
contrast, Google allocates over 15% of its cash to mortgage-backed securities,
while Intel allocates over 20% of its capital to shares in listed companies.
22Graph 11: Breakdown of cash positions by asset class as at the end of 2017 in billions of
dollars (US)
Big Tech Dominance (1): The New Financial Tycoons
© Fondation pour l’innovation politique, November 2018
Even though some of these positions entail a relatively higher level of risk,
the tech giants’ investment strategy is overall extremely conservative. They
all state that their investment decisions are conditional on protecting their
initial capital. This strategy clearly implies a strict focus on risk minimisation.
For example, all the corporate bonds that they hold are “investment grade”,
which means that they have been issued by well-established institutions with
the best credit scores.
To avoid relying solely on the claims of the companies in question, we
determined the average annual return on the big tech companies’ investments
by taking into account the interest payments from the cash positions. As the
graph below shows, this return is extremely low at approximately 1.3% per
annum over the past five years, which is barely equivalent to the consumer
price inflation in the United States.
23Graph 12: Average return on cash and marketable securities - Top 10 Tech US
| l’innovation politique
© Fondation pour l’innovation politique, November 2018
Therefore, while the extraordinary rise in the tech giants’ cash positions seems
to be coupled with an extension of the average maturity of the securities
portfolio, this has not resulted in greater risk-taking. Far from their image
as innovators investing massively in the development of future technologies,
fondapol
the tech giants actually allocate and manage their capital in an exceptionally
conservative manner.
3. A LASTING AND UNDESIRABLE CASH HOARDING DYNAMICS
To recap, the big tech companies have become key players in global finance
by accumulating huge financial surpluses and their corporate treasurers
appear more like managers of huge low-risk bond funds than working capital
accounts. In terms of capital allocation, the scale and management of their cash
positions leave no doubt as to the suboptimal nature of the current situation.
However, can we expect this hoarding phenomenon to continue in the future?
If so, what are the consequences for the economy?
a. Big tech cash hoarding: a temporary phenomenon or the new normal?
Tax arbitrage and the Trump reform
Many people claim that big tech hoarding is a temporary phenomenon as
it was, for a long period, the result of a tax arbitrage, to which the Trump
administration put an end last year by passing the “Tax Cuts and Jobs Act of
242017” (TCJA 2017). Before discussing the merits of this theory, we will take
a moment to examine the idiosyncrasies of the American tax system and the
recent changes made to it.
Until 2017, unlike most OECD countries, the United States levied a global
corporate tax, whereby profits made by American companies overseas were
taxable once they were repatriated in the United States at the federal corporate
tax rate (35%) less taxes already paid overseas. The tax reform passed by
President Donald Trump enshrined two major modifications: firstly, a cut in
the federal corporate tax rate from 35% to 21%; secondly the replacement
of the previous tax system by a territorial model under which only domestic
profits are subject to tax, and the introduction of a 15.5% one-time tax on
undistributed profits previously accumulated by American multinationals in
their overseas affiliates, regardless of their intentions to repatriate 10.
Given the cost of repatriating profits made overseas before TCJA 2017 was
passed, the tech giants chose to accumulate their financial surpluses in their
Big Tech Dominance (1): The New Financial Tycoons
non-American affiliates - with the result of 82% of their current cash and
marketable securities being domiciled overseas 11 - and finance distributions to
their shareholders (dividend payments and share repurchase programmes) by
contracting debt on the US bond markets. With a general environment of low
interest rates and high market confidence in the soundness of their business
models, this arbitrage was a no-brainer 12.
Consequently, the argument that distortions caused by the American tax
system have influenced the tech giants’ capital allocation is absolutely relevant.
However, it is unreasonable to suggest that these same distortions explain the
entire hoarding phenomenon and hence the “financialisation” of the big tech
companies outlined above.
For evidence of this, we need look no further than the trend of the big tech
companies’ net cash positions, i.e. cash and marketable securities minus their
debts. Although growth of the aggregated “net” position is, as one might
expect, less sustained than the “gross” one, it is still very significant: an average
of 15% per annum between 2000 and 2017 (versus 16% for the “gross”
figure), 13% between 2000 and 2008 (versus 10%) and 17% between 2008
10. More specifically, the law provides for taxation of undistributed profits that are reinvested in liquid securities, at a
rate of 15.5%, and those reinvested in illiquid assets, at a rate of just 8%. We only mention the first rate in the body of the
text as the second is not relevant to our analysis. It is worth noting that under the new tax code, American corporations
will have eight years to pay this one-time tax.
11. Apple: 94%, Microsoft: 96%, Google: 62%, Cisco: 96%, Oracle 82%, Facebook: 38%, Qualcomm: 76%, Amazon: 31%,
Intel: 60%.
12. It was indeed much less expensive to pay interest on debts equivalent to the distributed sums than to pay a flat
tax of around 35% on the same repatriated sums. Note that big tech companies make extensive use of tax avoidance
techniques to register their profits made overseas in jurisdictions where tax rates are extremely low (Ireland,
Luxembourg, etc.). We may therefore assume that although their effective tax rate in the event of repatriation would,
strictly speaking, be lower than 35%, it would not be far off this figure.
25and 2017 (versus 21%). Thus, at the end of 2017, “net” cash and marketable
securities reached $352 billion with debt equivalent to just 55% of “gross”
cash and marketable securities (versus 242% for the oil giants and 195% for
the CAC 37 companies).
Graph 13: Comparison of net cash positions (cash and marketable securities minus total
debt) in billions of dollars (US)
| l’innovation politique
fondapol
©Fondation pour l’innovation politique, November 2018
26Graph 14: Net cash positions (cash and marketable securities minus total debt) in billions
of dollars (US)
Big Tech Dominance (1): The New Financial Tycoons
© Fondation pour l’innovation politique, November 2018
Finally, we should add that besides having access to other sources of finance
such as domestic cash and marketable securities of $141 billion (as at the end
of 2017), the tech giants faced no credit restrictions impeding bond issues if
they had wished to distribute more cash to their shareholders or finance new
investment projects. In other words, even if they had been able to repatriate
all their cash domiciled overseas at no cost, it seems highly unlikely that they
would have used them differently to the way we have observed.
Hence, the indisputable existence of a tax arbitrage that led big tech companies
to issue debts rather than use their cash resources to pay for shareholder
distributions only partly explains the hoarding phenomenon.
Repatriation of cash: what scale, what impact?
We will now examine the present situation and try to anticipate the future. In
contrast to the US administration’s previous attempts, including George W.
Bush’s “repatriation tax holiday” in 2004, the Trump reform is unique in that
it permanently eliminates the disincentive to repatriate profits while stopping
short of any repatriation incentive. Whether or not they decide to repatriate
their cash, the American tech giants will therefore pay a one-time tax of almost
$100 billion over the next eight years 13.
13. 15.5% (tax rate) * 82% (percentage cash and marketable securities domiciled overseas) * 782 billion dollars (cash
and marketable securities) = 99.39 billion dollars.
27As of yet, only Apple and Cisco have publicly announced their intention
to repatriate the majority of their cash domiciled overseas 14. In their latest
regulatory filings, Microsoft, Oracle and Qualcomm have made it clear that
their overseas profits should be considered as being “permanently reinvested”
there. Microsoft has even gone so far as stating explicitly that they currently
do not intend nor foresee a need to repatriate these funds 15. The “repatriation
tax holiday” experience of 2004 moreover leaves us sceptical as to the interest
of repatriation for tech giants. According to Moody’s rating agency, the five
giants Apple, Microsoft, Google, Cisco and Oracle only decided to repatriate
9% of eligible sums at the time 16.
While President Trump promised widespread repatriations followed by
massive productive investment in the United States, it appears that the
multinationals do not see things quite the same way. Furthermore, the reasons
that lead us to believe that cost-free repatriation would not have radically
changed the tech giant’s capital allocation in the past are still valid today and
are likely to remain so, at least for a certain period of time. With abundant
| l’innovation politique
domestic financial resources and immediate access to the financial markets at
significantly lower costs than their cost of capital, the big tech for sure do not
have any “delayed” investments 17 and have so far been able to remunerate
their shareholders generously.
The big tech companies’ capital expenditure as a percentage of revenues is
fondapol
currently higher than its long-term trend (8% and 7% in 2017 and 2016
compared to an average of 6% between 2000 and 2017). It is worth noting that
at the time of the 2004 “repatriation tax holiday” - a similar situation in which
companies had easy access to credit - the impact of repatriation on domestic
investment proved negligible. Indeed, according to Wells Fargo (2018), less
than 1% of repatriated sums were used to finance capital expenditure 18.
14. Daisuke Wakabayashi and Brian X. Chen, “Apple, Capitalizing on New Tax Law, Plans to Bring billions in Cash Back
to U.S.”, The New York Times, 17 January 2018 (www.nytimes.com/2018/01/17/technology/apple-tax-bill-repatriate-
cash.html).
15. Cf. Microsoft, Annual Report 2017, p. 40-41, (view.officeapps.live.com/op/view.aspx?src=https://c.s-microsoft.
com/en-us/CMSFiles/2017_Annual_Report.docx?version=fdf60a00-f415-bcd2-9b39-885a21c40164).
16. Ciara Linnane, “Trump’s tax holiday won’t make much of a difference without corporate-tax reform“, C. Linnane,
Marketwatch, 10 December 2016 (www.marketwatch.com/story/trumps-tax-holiday-wont-make-much-of-a-
difference-without-corporate-tax-reform-2016-12-08).
17. In other words: if appropriate investment opportunities existed, they would already have been financed.
18. Wells Fargo Asset Management, “Tax Reform–Overseas Cash and Repatriation Implications”, Wells Fargo Funds
Management, 2018, p. 2 (www.wellsfargofunds.com/assets/pdf/fmg/commentary/mmkt/tax-reforemoverseas-cash-
repatriation-implications.pdf).
28Graph 15: Comparison of capital expenditures (as a percentage of revenues )
Big Tech Dominance (1): The New Financial Tycoons
© Fondation pour l’innovation politique, November 2018
Moreover, in addition to the exceptional shareholder value creation generated
by the spectacular rise in their share prices, the tech giants did not deviate from
the average in terms of distributions. In the long term, their shareholders’ yield
is indeed comparable to that of the CAC 37 companies.
Graph 16: Investment multiple of a diversified portfolio of shares for each sample
© Fondation pour l’innovation politique, November 2018
29Graph 17: Comparison of shareholder yield 19
| l’innovation politique
© Fondation pour l’innovation politique, November 2018
Graph 18: Dividends and net share repurchases in billions of dollars (US)
fondapol
© Fondation pour l’innovation politique, November 2018
19. For each period, the shareholder yield is calculated as a ratio of the sum of all forms of distribution (dividends, net
share repurchases and net debt reduction) to market cap. This measurement therefore does not include the other
major component of shareholder return on investment, namely share price gain.
30However, could some giants take this opportunity to repatriate and return more
money than usual to their shareholders? A number of recent announcements
suggest that this might be the case. Apple and Qualcomm have revealed
their plans to set up share buyback programmes of $100 and $30 billion
respectively 20. But on closer inspection, these two companies’ circumstances
appear quite specific. With the lowest P/E ratio in the big tech sample, Apple’s
share price seems under-valued given the company’s growth prospects. This
announcement of a one-time distribution may therefore be interpreted as an
attempt by the management to boost the share price and therefore avoid the
return of activists to its general meeting of shareholders. As regards Qualcomm,
the announcement was made following the abandonment of the acquisition
of the Dutch semiconductor manufacturer NXP. Therefore, it was simply a
matter of redistributing money that had been set aside specifically for this
transaction. In any case, nothing would currently suggest that the other tech
giants are likely to perform these one-time distributions.
Big Tech Dominance (1): The New Financial Tycoons
Nevertheless, we think that big tech companies will gradually repatriate a large
portion of their cash domiciled overseas in order to repay the face value of
their debts when they reach maturity. We believe this is all the more plausible
since the interest payable on these debts is currently roughly equal to the total
interest generated by cash investments. In any event, it is unlikely that such
repatriation will take place overnight for at least two reasons: on the assets
side, there is no benefit in the tech giants selling off their bond securities before
they mature as this could expose them to losses (especially in a context of
rising interest rates); on the liabilities side, even if their debt agreements include
early repurchase clauses, it would probably cost more to activate these than
waiting until securities mature. This assumption is moreover confirmed by a
Bank of America Merrill Lynch survey with a representative sample of relevant
companies. When asked “What will you do with your repatriated cash?”, most
companies responded that they would “pay down debt” 21.
20. Jack Nicas, “Apple Says It Will Buy Back $100 billion in Stock”, The New York Times, 1 May 2018 (www.nytimes.
com/2018/05/01/technology/apple-stock-buyback-earnings.html).
21.Michael Cimbalest, “Tax Cuts and Jobs Act of 2017”, 19 December 2017, JP Morgan, p. 28
(www.jpmorgan.com/jpmpdf/1320744529831.pdf).
31Graph 19: Income from cash positions versus debt service - Top 10 Tech US in billions of
dollars (US)
| l’innovation politique
© Fondation pour l’innovation politique, November 2018
Graph 20: Return on cash positions versus cost of borrowing - Top 10 Tech US
fondapol
© Fondation pour l’innovation politique, November 2018
32In summary, the impact of Donald Trump’s tax reform on big tech capital
allocation is likely to be moderate in the short term and more substantial in the
medium term when the time comes to pay down the face value of debts issued
in the past. Whatever the case, we do not expect this to affect the persistence of
large sums of cash and marketable securities on the tech giants’ balance sheets.
Beyond repatriation – a multi-factor dynamic
Ultimately, a multitude of factors other than repatriation will impact the big
tech’s cash position.
In purely fiscal terms, Donald Trump’s one-time tax on undistributed profits
accumulated overseas is set to cut cash and marketable securities by €100 billion
(i.e. 13% of current cash position) over the next eight years. However, given
the trend for lower corporate tax in most developed countries 22, the negative
impact of this one-time tax is likely to be counterbalanced, all other things
being equal, by lower tax on future profits. However, it should be noted that if
the international community or at least Europe were to take firm action against
Big Tech Dominance (1): The New Financial Tycoons
tax havens and work towards harmonising tax rates, it is not inconceivable that
tech giants may end up paying more tax on their profits than they currently do.
With regard to capital allocation, the question arises of whether the big tech
companies’ future cash flows will keep on increasing their cash positions to
the same extent as in the past, or whether there will be greater distribution to
shareholders. With considerable projected profits reflected by the level of their
valuation multiples (see the P/E ratio below), the balance of power between
management and shareholders is set to remain largely in favour of the former.
So it is highly likely that they will continue to retain a significant portion of
future profits for the very same reasons that have hitherto driven them to
accumulate such high levels of cash (risk aversion and maintaining financial
independence from banks and financial markets).
22. Examples: 35% to 21% in the United States (a cut already implemented by Donald Trump in 2017), 33.3% to 25% in
France by 2022 (in line with Emmanuel Macron’s electoral promise), 20% to 17% in the United Kingdom in 2020 (initial
cut of 20% to 19% implemented in 2017).
33Graph 21: Comparison of P/E ratios at the end of 2017
| l’innovation politique
© Fondation pour l’innovation politique, November 2018
It should be noted that several companies in the sample have not yet developed
fondapol
the habit of regularly distributing cash to their shareholders. For instance,
Amazon, Facebook and Google have never paid a single dividend. Amazon
has not repurchased any shares since 2012. Google and Facebook began to do
so in 2015 and 2017 respectively, although for derisory sums. However, their
distribution policy may well change in the coming years, in line with the path
taken by Apple since 2012. In this case, growth of the big tech companies’ cash
positions would probably slow down naturally.
Finally, if the next wave of innovations (e.g. artificial intelligence, driverless
cars, robotics, drones, etc.) were to prove relatively more capital intensive, the
big tech companies may see their capital expenditure increase, which would
de facto reduce their free cash flows and eventually limit their cash hoarding
potential.
Although multiple factors with uncertain and potentially divergent effects are
at play, it is likely that the tech giants will still retain high levels of cash in the
future. We therefore consider big tech hoarding to be a more structural than
temporary phenomenon. What are its consequences for the global economy?
Can such microeconomic phenomenon have macroeconomic effects?
34b. A sub-optimal capital allocation for the economy
Companies involved in cutting-edge industries such as information technology,
electronics and biotechnology are generally expected to encounter investment
opportunities whose financing requirements outstrip internally generated cash,
prompting them to tap financial markets in order to speed up their growth.
However, with capital allocation more akin to the patterns of old monopolistic
industries than those of dynamic, innovative companies, the American tech
giants have long since moved from being “net borrowers” with respect to the
rest of the economy to the more comfortable position of “net lenders”. We
believe this persistent trend is harmful from a macroeconomic perspective.
Orders of magnitude
First of all, we believe it is important to have some orders of magnitude in mind.
Cash and marketable securities accumulated by big tech companies between
2000 and 2017 ($718 billion) equates to almost one and a half times their
total capital expenditure over the same period ($505 billion). To reach a figure
Big Tech Dominance (1): The New Financial Tycoons
approaching the $718 billion of capital held as cash and marketable securities,
one would have to add the total value of mergers and acquisitions performed
over the same period (i.e. acquisitions less divestitures). These hoarded sums
are therefore truly colossal in proportion to the investments made. In absolute
terms, they are comparable to the foreign exchange reserves held by central
banks in the main emerging regions (Latin America, East Asia, the Middle
East), or to the assets under management of the ten largest private global bond
funds (see graph below) 23.
Moreover, we estimate that approximately $281 billion of big tech companies’
cash is invested in US government securities, which represents just under 2%
of total US sovereign debt excluding intragovernmental holdings 24.
Finally, investments in corporate bonds amount to $294 billion, which is
around 6% of the US investment grade market according to the estimates of
Morgan Stanley 25.
23. Estimated foreign exchange reserves as at the end of 2017 (in billions of dollars and percentage of big tech cash
and marketable securities): Latin America: 858 (91%), Southeast Asia: 886 (88%), Middle East: 1119 (70%). Assets
under management of the ten largest private global bond funds (in billions of dollars and percentage of big tech cash
and marketable securities): 884 (89%). A list of the ten funds in question can be found in the appendix.
24. Of the $21 trillion in US sovereign debt, $5.6 trillion (30% of the total) is held by entities that are affiliated in one
way or another to the US administration. For example, creditors include the Social Security Trust Fund or the Federal
Disability Insurance Trust Fund.
25. Tyler Durden, “The Corporate Bond Market Is Getting Junkier”, Bloomberg, 10 July 2018 (www.bloomberg.com/
opinion/articles/2018-07-10/corporate-bonds-are-getting-junkier).
35Graph 22: Cash positions of Top 10 Tech US vs. assets under management of top 10 bond
funds in billions of dollars (US)
| l’innovation politique
© Fondation pour l’innovation politique, November 2018
With these orders of magnitude in mind, we will now examine the
macroeconomic consequences of the tech giants’ approach to capital allocation
fondapol
and cash management.
c. Impact on productivity gains
We believe that their current capital allocation policy runs the risk of slowing
down productivity gains and therefore hampering the economy’s potential
output growth. As we have demonstrated, capital held as cash and marketable
securities is allocated in an excessively conservative manner and therefore only
contributes to a limited extent to financing the productive economy. Therefore,
the big tech companies’ excessive cash hoarding could be a factor behind the
marked slowdown in productivity gains observed in the US economy over
the past decade by Robert J. Gordon 26, and more specifically within the tech
industry by John G. Fernald 27.
26. Mean annual growth of total factor productivity: +1.9% between 1920 and 1970, +0.6% between 1970 and 1994,
+1% between 1994 and 2004 (acceleration linked to the information revolution), and just +0.4% between 2004 and
2014. Robert J. Gordon, The Rise and Fall of American Growth, Princeton University Press, 2016
27. John Fernald, “Productivity and Potential Output before, during, and after the Great Recession”, NBER
Macroeconomics Annual 2014, vol. 29, The University of Chicago Press, 2015 (www.journals.uchicago.edu/doi/
pdfplus/10.1086/680580).
36You can also read