Bio-Organic Fertilizer: A Green Technology to Reduce Synthetic N and P Fertilizer for Rice Production - Frontiers
←
→
Page content transcription
If your browser does not render page correctly, please read the page content below
ORIGINAL RESEARCH
                                                                                                                                    published: 23 March 2021
                                                                                                                               doi: 10.3389/fpls.2021.602052

                                             Bio-Organic Fertilizer: A Green
                                             Technology to Reduce Synthetic N
                                             and P Fertilizer for Rice Production
                                             Umme Aminun Naher* , Jatish Chandra Biswas, Md. Maniruzzaman,
                                             Faruk Hossain Khan, Md. Imran Ullah Sarkar, Afsana Jahan,
                                             Md. Hasibur Rahaman Hera, Md. Belal Hossain, Aminul Islam, Md. Rafiqul Islam and
                                             Md. Shahjahan Kabir
                                             Bangladesh Rice Research Institute, Gazipur, Bangladesh

                                             Decomposed organic materials, in combination with plant growth-promoting bacteria
                                             (PGPB), are environmentally friendly and reduce synthetic fertilizer use in rice production.
                                             A bio-organic fertilizer (BoF) was prepared using kitchen waste (79%), chita-dhan
                                             (unfilled rice grain) biochar (15%), rock phosphate (5%), and a consortium of 10 PGPB
                        Edited by:           (1%) to supplement 30% nitrogen and to replace triple superphosphate (TSP) fertilizer
                     Jianbin Zhou,
     Northwest A&F University, China
                                             in rice production with an improvement of soil health. PGPB were local isolates and
                        Reviewed by:
                                             identified using 16S ribosomal RNA partial gene sequences as Bacillus mycoides,
                     Corina Carranca,        Proteus sp., Bacillus cereus, Bacillus subtilis, Bacillus pumilus, Paenibacillus polymyxa,
    Instituto Nacional de Investigação
                                             and Paenibacillus spp. Isolates could fix N2 by 0.7–1.4 g kg−1 , solubilize 0.1–1.2 g
     Agrária e Veterinária, I. P. (INIAV),
                                Portugal     kg−1 phosphate, and produce 0.1–40 g kg−1 indoleacetic acid. The performance of
                M. Sudhakara Reddy,          BoF was evaluated by 16 field experiments and 18 farmers’ field demonstration trials
               Thapar University, India
                                             during the year 2017–2020 in different parts of Bangladesh. Performances of BoF
                  *Correspondence:
                 Umme Aminun Naher
                                             were evaluated based on control (T1 ), full synthetic fertilizer dose of N, P, and K (T2 ),
                  naher39@gmail.com          BoF (2 t ha−1 ) + 70% N as urea + 100% K as muriate of potash (T3 ), 70% N as
                                             urea + 100% P as TSP + 100% K as muriate of potash (T4 ), and 2 t ha−1 BoF (T5 )
                   Specialty section:
         This article was submitted to
                                             treatments. At the research station, average grain yield improved by 10–13% in T3
                        Plant Nutrition,     compared with T2 treatment. Depending on seasons, higher agronomic N use efficiency
               a section of the journal
                                             (19–30%), physiological N use efficiency (8–18%), partial factor productivity (PFP)N (114–
            Frontiers in Plant Science
                                             150%), recovery efficiency (RE)N (3–31%), N harvest index (HIN ) (14–24%), agronomic
      Received: 02 September 2020
        Accepted: 21 January 2021            P use efficiency (22–25%), partial factor productivity of P (9–12%), AREP (15–23%), and
         Published: 23 March 2021            HIP (3–6%) were obtained in T3 compared with T2 treatment. Research results were
                              Citation:      reflected in farmers’ field, and significant (P < 0.05) higher plant height, tiller, panicle,
                Naher UA, Biswas JC,
          Maniruzzaman M, Khan FH,
                                             grain yield, partial factor productivity of N and P were obtained in the same treatment.
    Sarker MIU, Jahan A, Hera MHR,           Application of BoF improved soil organic carbon by 6–13%, along with an increased
  Hossain MB, Islam A, Islam MR and
                                             number of PGPB as compared with full synthetic fertilizer dose. In conclusion, tested
        Kabir MS (2021) Bio-Organic
       Fertilizer: A Green Technology        BoF can be considered as a green technology to reduce 30% synthetic N and 100%
to Reduce Synthetic N and P Fertilizer       TSP requirements in rice production with improved soil health.
                   for Rice Production.
         Front. Plant Sci. 12:602052.        Keywords: biochar, free-living N2 fixing bacteria, kitchen waste, indoleacetic acid, nitrogen use efficiency,
      doi: 10.3389/fpls.2021.602052          phosphate solubilizing bacteria, phosphorus use efficiency

Frontiers in Plant Science | www.frontiersin.org                                  1                                   March 2021 | Volume 12 | Article 602052
Naher et al. Bio-organic Fertilizer to Supplement Synthetic N and P
INTRODUCTION 83% of cultivated lands are with low SOM (Jahiruddin and Satter,
2010). It had proven that long-term chemical fertilization without
Rice dictates food security in many Asian countries, such as applying organic materials impaired soil health and plateaued
Bangladesh. Rice cultivation involves a large number of nutrients rice yield, although there were so many improved rice varieties
that are derived from synthetic fertilizers. Among the plant (Naher et al., 2020). The correction of nutrients deficiency by
nutrients, nitrogen (N) is the most limiting factor for rice synthetic fertilizers in all kinds of soil is a short-term management
production, and its application rate is higher than the other strategy. Nevertheless, if we consider soil health, breaking yield
nutrients. In Bangladesh, rice grows three times in a year, ceiling, and sustainable rice production, we need to improve rice
covering 10 m ha of land. Average synthetic N use in the wet soil biochemical properties. Additionally, soil health restoration
and dry seasons is 65 and 100 kg ha−1 , respectively, which for higher crop productivity requires external application of SOM
partakes approximately 83% of the total urea-N fertilizer of the and improved soil biology. However, major sources of organic
country (BBS, 2017). Unfortunately, N use efficiency is poor in matter in the country (cow dung and poultry litter) are scarce
rice cultivation, and approximately 50% of applied N is lost to due to its diverse use as fish feed, animal feed, and fuel. In this
the environment (Islam et al., 2016), in the form of ammonia, context, biodegradable kitchen waste can be an alternate option
nitrate, and nitrogen oxides through volatilization, leaching, and of SOM in densely populated countries, such as Bangladesh.
emissions, respectively (Sutton et al., 2013; Battye et al., 2017), Because of the high population pressure, waste management,
causing serious environmental pollution and human health especially household wastes (mostly kitchen waste) produced in
hazards (Schlesinger, 2009; Canfield et al., 2010). Phosphorus the urban and semi-urban areas, is a big issue in the country.
(P) is the second most important nutrient and is held naturally Parvin and Begum (2018) estimated that the population density
in the earth as rock phosphate (RP), which is used as the raw was 1,015 people per square kilometer and per capita waste
material of synthetic fertilizers such as triple superphosphate generation was 0.56 kg day−1 . In many cases, wastes are dumped
(TSP) or other phosphate fertilizer. The solubility of RP limits onto the roadsides, creating an unhealthy environment. Dhaka
its use in annual crop production, including rice. Furthermore, city alone generates approximately 5,800 tons of solid organic
any fertilizer production, transportation, and consumption cause waste each day, at least 80% of which is suitable for composting
greenhouse gas emission, and it is energy involving process. (Rothenberger et al., 2006). About half of it is collected by Dhaka
Park et al. (2012) stated that the use of N fertilizer added City Corporation, and the rest remains in open areas and creates
approximately 20% nitrous oxide (N2 O) accumulation since the environmental pollution. Proper management of such waste
industrial revolution, and approximately 2% of global energy is reduces greenhouse gas emissions by approximately 89,000 tons
used for reactive N (Nr) production through the Haber–Bosch of carbon dioxide year−1 (Parvin and Begum, 2018). Nonetheless,
process (Sutton et al., 2013). Moreover, approximately 120 Tg our preliminary observation indicates that co-composting of
N year−1 is added into the environment due to synthetic N these materials with RP improves bioavailable P contents (Naher
production (IFA, 2016). Besides chemical synthesis, biological et al., 2018). Co-composting of household waste materials with
N2 fixation (BNF) is another important Nr source. According to RP and phosphate solubilizing bacteria (PSB) may provide a new
Ladha et al. (2016), BNF by symbiotic and free-living microbes era of P fertilizer management in rice cultivation and improve rice
add 30–51 Tg Nr to the atmosphere. Wetland rice ecosystem soil health without the use of any synthetic P fertilizer.
can harbor a diverse group of plant growth-promoting bacteria Increasing global demand for food production with
(PGPB), which efficiently colonizes with a root that has been population pressure forces intensive agriculture to lean toward
shown to fix a substantial amount of N2 (Hurek et al., 1997; Naher synthetic fertilizer use and simultaneously increases risks of soil
et al., 2013) and solubilize organic and inorganic phosphate degradation and environmental pollution by altering the earth’s
(Panhwar et al., 2014). Since the ancient period, Bacillus, biogeochemical processes (Singh et al., 2014; Amundson et al.,
Azospirillum, Pseudomonas, Rhizobium, and Burkholderia were 2015; Steffen et al., 2015). Furthermore, among the agricultural
being used as biofertilizer due to their unique characteristics inputs, synthetic fertilizers are required in huge amounts, and
of N2 fixing, phosphate solubilizing, disease suppression, and every year, the government has to subsidize urea and TSP
indoleacetic acid (IAA) production (Pathak and Kumar, 2016; fertilizers for crop production. Potential management of BNF
Di Benedetto et al., 2017). Proper management of such bacteria and PSB may decrease the demand for synthetic N and P fertilizer
can compensate for synthetic N fertilizer use and promote RP in requirements for rice production. Considering soil health and
rice cultivation. Conversely, soil microorganisms play a crucial the environment, we hypothesized that BNF by free-living N2
role in soil nutrient cycling (Richardson et al., 2009; Jacoby fixing bacteria might compensate at least 30% of Nr in rice
et al., 2017) and are known as indicators to maintain soil quality production, and co-composting of biodegradable kitchen waste
and soil health (Doran and Zeiss, 2000). The number and types with PR and PSB may fulfill the required P demand of rice and
of soil microbial inhabitants’ and their activity in the vicinity consecutively improve soil health via the addition of organic
are crucial to maintaining crop productivity, soil health, and matter. To verify this hypothesis, a bio-organic fertilizer was
ecosystem functions. prepared using biodegradable kitchen waste, RP, chita-dhan
Maintenance of rice soil health is crucial for obtaining national biochar, and consortium of locally isolated PGPB and, finally,
food security in Bangladesh. However, intensive cropping and applied to the rice field. Hence, a study was undertaken with the
continuous use of synthetic fertilizers are responsible for objectives: (i) to evaluate the efficacy of formulated bio-organic
reducing soil organic matter (SOM) content, and approximately fertilizer that can supplement 30% N and eliminate 100% TSP
Frontiers in Plant Science | www.frontiersin.org 2 March 2021 | Volume 12 | Article 602052Naher et al. Bio-organic Fertilizer to Supplement Synthetic N and P
fertilizer use in rice production and (ii) to find the impact of determined from the filtrate using the procedure described by
bio-organic fertilizer application on rice soil biology and carbon Cappucino and Sherman (1992).
restoration as well soil health.
Determination of P Solubilization by the
Phosphate Solubilizing Bacteria
MATERIALS AND METHODS The PSB were cultured in the National Botanical Research
Institute’s phosphate growth medium broth (Nautiyal, 1999)
Formulation of Bio-Organic Fertilizer containing RP for 5 days. Exactly, 2 ml of samples was taken
Bio-organic fertilizer consists of solid based (20% moisture) for P determination. The samples were first allowed to sediment
organic material (particle size is 2 mm) that was developed at for 15 min and then centrifuged at 4,000 × g for 5 min. The
the soil microbiology laboratory of Bangladesh Rice Research supernatant was filtered through 0.2-mm filter paper and kept
Institute (BRRI) Gazipur. Active ingredients of the product are at −20◦ C until analysis. Available P was determined using the
0.5–1% inoculum mass of locally isolated 10 bacteria (free- procedure described by Murphy and Riley (1962).
living N2 fixing, PSB, and IAA producing bacteria) and RP
(5%), whereas carrier materials were biodegradable kitchen Determination of Indoleacetic Acid
waste/vegetable waste (79.5%) available in the kacha bazar Production
(local market) and chita-dhan biochar (15%). The bacteria were All of the identified isolates (10 bacteria) were inoculated in
cultured in 2.5% molasses by maintaining a population of nutrient broth with an addition of tryptophan (2 mg ml−1 ) and
109 CFU ml−1 and added during co-composting of organic incubated at 28 ± 2◦ C for 3 days. The culture was centrifuged
materials along with RP and biochar. The product contained at 7,000 rpm for 7 min, and 1 ml of the supernatant was mixed
approximately 250 g kg−1 organic carbon, 10.4 g kg−1 N, and with 2 ml of Salkowsky’s reagent. The IAA concentration was
approximately 10.4 g kg−1 available P, which was sufficient determined using a spectrophotometer at 535 nm.
to replace TSP (100%) fertilizer for a single rice crop. It also
contained 9.1 g kg−1 exchangeable K, 3.5 g kg−1 available S,
Evaluation of Bio-Organic Fertilizer for
0.03 mg kg−1 available Zn, 0.006 mg kg−1 Cu, 0.01 mg kg−1 Pb,
and 0.67 mg kg−1 Cd. The pH of the product was 7.2. Plant Growth and Yield
To evaluate the performance of BoF, 16 field experiments
were conducted at BRRI research stations of Gazipur, Cumilla,
Isolation and Identification of the Barishal, and Rajshahi, and 18 farmer’s field demonstration trials
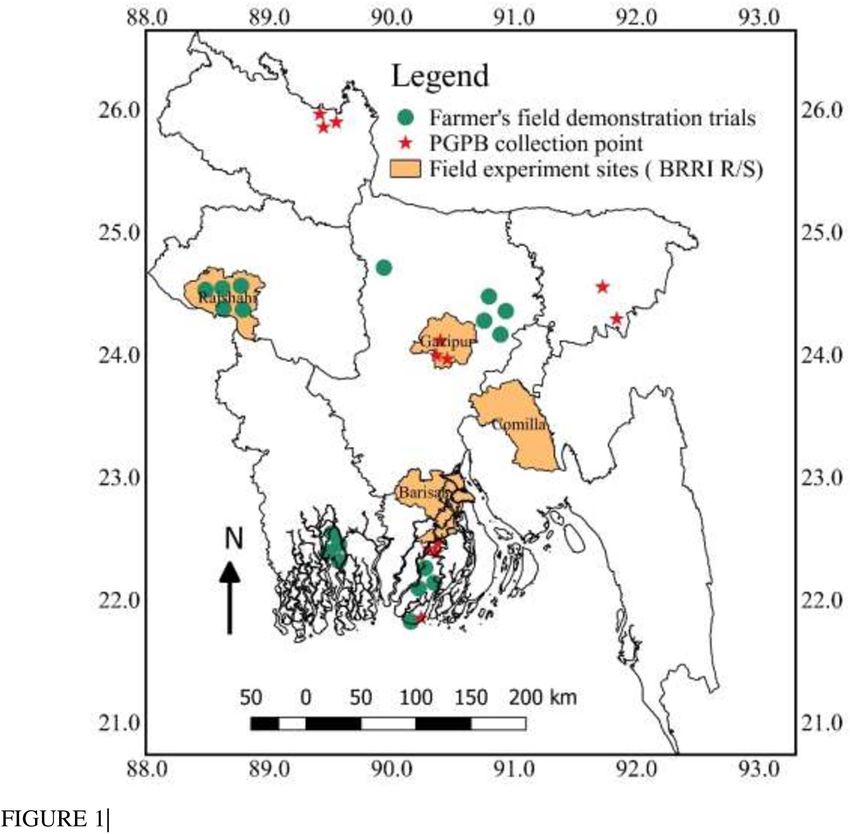
Growth-Promoting Bacteria were performed in different parts of Bangladesh (Figure 1)
Beneficial bacteria used in the bio-organic fertilizer (BoF) were during the year 2017 to 2020. Treatments considered in the field
isolated from paddy soils of Gazipur (terrace soil), Lalmonirhat experiments were T1 = control, T2 = full synthetic fertilizer dose
(active Tista floodplain soil), and Kuakata (saline soil) (Figure 1) (FSFD) of N, P, and K fertilizer as urea, TSP, and muriate of potash
following protocols of Naher et al. (2009). Isolated potential (MoP), T3 = BoF (applied, at 2 t ha−1 ) + 70% N as urea + 100%
bacteria were identified by 16S ribosomal RNA partial gene K as MoP, T4 = 70% N as urea + 100% P as TSP + 100% K
sequences using universal primers. Free-living N2 fixing bacteria as MoP, and T5 = BoF (2 t ha−1 ). Treatments were assigned
were identified according to Naher et al. (2013), where forward in randomized complete block design with three replications.
and reverse primers were used as 8 F, 50 -AGA GTT TGA TCC Farmers’ field demonstration trials were conducted in different
TGG CTC AG-30 and 1492R, 50 -GGT TAC CTT ACG ACT parts of Bangladesh to check the suitability of the BoF in different
T-30 (Versalovic et al., 1991), respectively. PSB were identified types of soil (saline, floodplain, and terrace soil) and climate
following the protocol of Panhwar et al. (2014) with forward (Figure 1). Five field trials were conducted in drought-prone
primer F 5-AGA GTT TGA TCC TGG CTC AG-3 and reverse areas of Rajshahi (Poba, Durgapur, Godagari, and Shampur),
primer R3-ACG GCT ACC TTG TTA CGA CTT-5 (Weisburg eight trials in the saline soils of Dakope, Khula, and Amtoli,
et al., 1991). Gene sequences acquired were deposited in the Barguna, four trials in flood plain soils of Kotiadi, Kishoreganj,
sequence read archive, PRJNA662441: bio-organic fertilizer. and one trial in the terrace soil of Dhanbari, Tangail. Farmers field
demonstration trials were non-replicated and treatments were as
Determination of N2 Fixation T1 = BoF at 2 t ha−1 + 70% urea N + 100% K as MoP, T2 = FSFD.
The amount of N2 fixation was determined via NH4 production Rice was grown in both T. Aman wet and Boro irrigated seasons.
by the isolated strains. Identified free-living N2 fixing bacteria Applied fertilizer doses for FSFD were N, P, K, and S at 80–
were grown in N free (NFB) broth. The composition of the 20–50 and 140–20–80 kg ha−1 in T. Aman wet and Boro
NFB broth was slightly modified from Prasad et al. (2001), as irrigated seasons, respectively, as urea, TSP, and MoP. During the
(grams/liter): 5 g malic acid, 0.5-g K2 HPO4 , 0.2-g MgSO4 . 7 H2 O, calculation of fertilizer doses, additional N and P nutrients added
0.1-g NaCl, 0.02-g CaCl2 , 1.64% Fe-EDTA solution (4 ml), and from BoF were deducted from respective treatments. At all of the
the pH was adjusted to 7.2. The isolated strains were cultured research stations, each treatment was assigned in a 4-m × 5-m
in the prepared broth at 30◦ C for 5 days on a rotary shaker sized plot surrounded by a 50-cm bund. Approximately 30- and
(120 rpm). The bacteria culture was then centrifuged at 4000 × g 45-day-old rice seedlings of high yielding modern varieties were
for 5 min and filtrated through a 0.2-mm filter paper. The N was transplanted at 20 cm × 20 cm plant spacing in the T. Aman
Frontiers in Plant Science | www.frontiersin.org 3 March 2021 | Volume 12 | Article 602052Naher et al. Bio-organic Fertilizer to Supplement Synthetic N and P
FIGURE 1 | Bangladesh Map showing different locations of PGPB collections, field experiments, and farmers’ field trials.
wet and Boro irrigated seasons, respectively. Weeding and plant Determination of Nutrient Concentration,
protection measures were done as required. Urea fertilizer was N and P Uptake
applied in three splits at equal amounts; during land preparation,
During harvest, plant samples were separated into grain and
maximum tillering stage, and finally at the panicle initiation
straw followed by oven drying at 60◦ C for 3 days and ground
stage. During final land preparation, BoF was applied along with
before wet digestion using perchloric acid and HNO3 (5:2) at
synthetic fertilizers and incorporated with soil. The flooded water
100◦ C. Phosphorus was determined from the digested sample
level at 5–7 cm depth was maintained during rice cultivation
following the Colorimetric method (Dick and Tabatabai, 1977)
and then drained 21 days before rice harvesting. At the farmer’s
and K by atomic absorption spectrometer (AA-7000, Shimadzu).
field trials, plot size was varied from 122 to 1,336 m2 , and
Total N was determined by the Kjeldahl method (Bremner
high-yielding rice varieties were selected as per farmers’ choice;
and Mulvaney, 1982). Plant nutrient uptakes were calculated in
however, plant spacing and fertilizer application rate and method
kilograms per hectare in relation to yield kilograms per hectare
were the same. In the research stations, crops were harvested
(Yadav et al., 2019):
manually at maturity from a 5-m2 area. At farmer’s fields, crop
was harvested on a whole plot basis. Grain yield was adjusted at
Nutrient uptake N or P or K kg ha−1
14% moisture content. Tiller and panicle numbers plant−1 were
calculated from a 1-m2 plot area. Yield contributions of BoF were Nutrient content (%) × yield kg ha−1
calculated from the average yield data (16 experiments) of T3 /T5 = (2)
treatments as 100
% Grain yield contribution of BoF t ha−1
Determination of N and P Use Efficiency
Agronomic use efficiency (AE) and physiology use efficiency (PE)
Yield of BoF + reduced synthertic fertilizer were calculated according to Ladha et al. (2005). PFP and RE
= × 100 (1)
Yield of BoF were calculated as per Chuan et al. (2016), and nutrient HI was
Frontiers in Plant Science | www.frontiersin.org 4 March 2021 | Volume 12 | Article 602052Naher et al. Bio-organic Fertilizer to Supplement Synthetic N and P
determined using formulae of Huang et al. (2018); Organic C was determined by following the method of Walkley
−1
and Black (1934). Total N was determined by the Kjeldahl
AE for N or P kg kg
digestion method (Bremner and Mulvaney, 1982). Available
Grain yield of nutrient applied plot − Grain yield of control plot P was determined by the extraction method of Bray and
= (3)
Amount ofapplied nutrient Kurtz (1945) following colorimetric in a spectrophotometer.
Exchangeable K was extracted using ammonium acetate buffer
at pH of 7 (Page et al., 1982) and determined by AAS (AA-7000,
PEN kg kg −1
Shimadzu). The population of free-living N2 fixing bacteria and
Grain yield of nutrient applied plot − Grain yield of control plot PSB was determined by serial dilution of soil sample and spread
= (4)
N uptake in N applied plot − N uptake in N omission plot plate technique in specific media plates described by Naher et al.
(2009) and Panhwar et al. (2014), respectively.
PFP for N or P kg kg −1 Statistical Analyses
Biochemical analyses in the laboratory were arranged in
Grain yield of nutrient applied plot
= (5) a completely randomized design with five replicates. The
Amount ofapplied nutrient quantitative results of the laboratory and field experiments were
subjected to an analysis of variance, and means of different
RE for N or P kg kg −1
treatments were compared at a 5% level of significance by
Duncan’s Multiple Range Test using STAR 2.01 (Statistical
Nutrient uptake fertilized plot − Nutrient uptake control plot
= (6) Tool for Agricultural Research [STAR], 2014) statistical
Amountofapplied nutrient
program. A combined statistical analysis tool (t-test) was
applied to compare the data generated in the farmers’ field
demonstration trials.
HI for N or P kg kg −1
Nutrient accumulation in grain
= × 100 (7) RESULTS
Amountofnutrient uptake (Grain + Straw)
Determination of Soil Nutrient Potentiality of the PGPB to Supplement
Concentration Reactive N and Solubilize Rock
After completion of eight crop cycles, soil (0–20 cm depth) Phosphate
was collected from the experimental field of BRRI Gazipur and Bio-organic fertilizer prepared using a consortium of 10
BRRI regional station Cumilla for determination of organic microaerophilic PGPB isolated from the floodplain, terrace, and
carbon (OC), total N, available P, exchangeable K, and a total saline rice soil (Figure 1) was subjected to 16S ribosomal RNA
population of PSB and free-living N2 fixing bacteria. Before partial gene sequences and identified commonly as Bacillus and
chemical analyses, soil was air-dried, ground, and sieved (2 mm). Paenibacillus spp. Most PGPB were proficient in N2 fixing,
TABLE 1 | Identification and biochemical properties of bacterial strains used in bio-organic fertilizer.
Bacteria strains *ID: SRA/EMBL-NCBI **Similarity (%) Biochemical properties (g kg−1 )
***IAA Total N Extractable P
Paenibacillus sp. SRX9106118 97 0.3 b 0.7 ab 1.1 a
Paenibacillus polymyxa SRX9106116 98 4.0 a 1.4 a 0.5 ab
Bacillus sp. SRX9106117 85 0.3 b 1.0 a 1.2 a
Bacillus mycoides SRX9106115 97 0.1 b 0.7 ab 0.4 b
Proteus sp. SRX9106121 95 0.1 b 1.3 a 0.1 b
Bacillus cereus SRX9106122 95 3.6 a 0.8 ab 1.1 a
Bacillus subtilis JQ820255 97 0.1 b 0.8 ab 0.4 b
Bacillus pumilus SRX9106119 97 0.3 b 0.4 b 0.8 ab
Bacillus sp. SRX9106120 85 0.2 b 1.2 a 0.7 ab
Bacillus sp. SRX9106114 85 0.1 b 1.1 a 0.4 b
Different lowercase letters within the column denote significant differences between the treatments according to ANOVA and Duncan’s multiple range test at a 5%
level of significance. *Sequence Read Archive/European Molecular Biology Laboratory databank— National Center for Biotechnology Information. **Based on nucleotide
sequence database (National Center for Biotechnology Information). ***Indoleacetic acid.
Frontiers in Plant Science | www.frontiersin.org 5 March 2021 | Volume 12 | Article 602052Naher et al. Bio-organic Fertilizer to Supplement Synthetic N and P
Grain Yield Response to the Applied
Bio-Organic and Synthetic Fertilizer
Field experiments (18) were conducted at different research
stations of BRRI in both T. Aman wet and Boro irrigated seasons.
Average grain yield data obtained from different replicated
treatments of all experiment sites (eight at each season) were
arranged in a box plot. Figure 2A illustrates the results of T.
Aman wet seasons where an average 10.44% higher grain yield
was obtained in the BoF (2 t ha−1 ) + 70% N as urea + 100%
K as MoP treatment (T3 ) compared with full synthetic fertilizer
(T2 ) treatment. Grain yield varied from 3.89 to 5.98 t ha−1 with
an average value of 5.18 in T3 treatment. Conversely, in the full
synthetic N, P, and K fertilizer treatment (T2 ), grain yield ranged
from 3.56 to 5.60 t ha−1 with an average of 4.69 t ha−1 . Reduction
of 30% N from the full dose of urea fertilizer (T2 ) reduced 8% of
average grain yield in T4 treatment. Nonetheless, BoF treatment
(T5 ) alone was not capable of producing grain yield comparable
with FSFD treatment (T2 ), although the total contribution of
bio-organic fertilizer on grain yield was 65.83% in T. Aman wet
seasons. The lowest average grain yield obtained in the control
plot was 2.2 t ha−1 .
In general, grain yield was higher in the Boro irrigated
compared with T. Aman wet seasons (Figure 2B). The yield trend
of Boro irrigated seasons (average eight experiments) followed
a similar pattern of T. Aman wet seasons, where grain yield in
BoF + 70% N as urea + 100% K as MoP (T3 ) ranged from 6.0
to 8.9 t ha−1 with an average of 7.87 t ha−1 . In this treatment
(T3 ), 25% grain yield value below the median was 7.22 t ha−1 , and
above the 75th percentile value was 8.64 t ha−1 . On average, 13%
higher grain yield was obtained in the T3 treatment compared
with the FSFD application. In the FSFD treatment (T2 ), grain
FIGURE 2 | Effect of fertilizer management practices on grain yield of rice. yield varied from 4.54 to 8.66 t ha−1 , and the average yield
Grain yield data obtained from field experiments conducted at BRRI research was 6.97 t ha−1 . In the Boro irrigated seasons, a reduction of
stations (eight experiments in each season) during years 2017–2020. 30% N from FSFD treatment (T2 ) reduced 19% grain yield in
(A) T. Aman wet seasons, (B) Boro irrigated seasons. Line that divides box
T4 . Nevertheless, the application of BoF alone gave an average
represents median of data. End of box shows upper and lower quartiles
(n = 24 for each season). T1 = control, T2 = FSFD: full synthetic fertilizer dose
5.21 t ha−1 grain yield. The total contribution of bio-organic
of N, P, and K at 80–20–50 and 140–20–80 kg ha−1 as urea, triple super fertilizer on grain yield was 66.79% in Boro irrigated seasons.
phosphate (TSP), and muriate of potash (MoP) in T. Aman wet and Boro The lowest average grain yield was 3.11 t ha−1 recorded in the
irrigated seasons, respectively; T3 = BoF (2 t ha−1 ) + 70% N as urea + 100% control treatment.
K as MoP, T4 = 70% N as urea + 100% P as TSP + 100% K as MoP;
T5 = sole BoF at 2 t ha−1 . BoF was added as dry weight basis.
Effect of Fertilizer Management
Practices on Plant Nutrient Uptake
Bio-organic and synthetic fertilizer management practices have
P solubilizing, and produced IAA (Table 1). The biological significant effects on plant N, P, and K uptakes. Across all field
N2 fixing capability of the isolated strains ranged from 0.07 experiments and irrespective of seasons, the highest average plant
to 0.14%. Among the isolates, Proteus sp. and Paenibacillus N uptake was recorded in both the BoF (2 t ha−1 ) + 70%
polymyxa fixed the highest amounts of atmospheric N2 . However, urea N + 100% MoP (T3 ) and a full dose of synthetic
results were statistically similar with B. subtilis, B. cereus, fertilizers (T2 ) followed by sole BoF (T5 ) application. In T4 , a
Paenibacillus sp., and other two Bacillus spp. The ability of reduction of 30% N from FSFD (T2 ) significantly reduced N
PSB for phosphate solubilization from RP ranged from 0.01 uptake, and the lowest N uptake was recorded in the fertilizer
to 0.12%. Potential P solubilizers were B. pumilus (0.08%), control treatment (T1 ). Table 2 demonstrates the nutrient uptake
B. cereus (0.11%), Paenibacillus sp. (0.11%), and one Bacillus in T. Aman wet seasons, where N uptake in T3 treatment
sp. (0.12%). The highest amount of IAA (0.36%) was produced ranged from 64 to 110 kg ha−1 with an average value of
by both P. polymyxa and B. cereus; nevertheless, all the 92 kg ha−1 . Correspondingly, in the FSFD (T2 ) practice, the
identified strains had the potential to produce this particular average N uptake was 90 kg ha−1 , and it ranged from 63
plant growth hormone. to 106 kg ha−1 . Reduction of 30% N from the full dose of
Frontiers in Plant Science | www.frontiersin.org 6 March 2021 | Volume 12 | Article 602052Naher et al. Bio-organic Fertilizer to Supplement Synthetic N and P
synthetic fertilizer (T2 ) reduced 30.41% average N uptake in (27 kg kg−1 ) was found in the T2 treatment. The highest average
T4 . Nevertheless, 42–100 kg ha−1 N uptake was recorded in N recovery efficiency (REN ) (56 kg kg−1 ) was recorded in the BoF
the sole BoF use. (T5 ) treatment, whereas, in the other three treatments, REN was
Variation in P uptake was found among the treatments. almost identical. In N harvest index (HIN ), comparable values
A higher range of P uptake (13–26 kg ha−1 ) with an average value were obtained among the treatments (Figure 3A).
of 21 kg P ha−1 was obtained in T3 , where RP was the source of In the Boro irrigated seasons (Figure 3B), among the eight
P nutrient. However, P uptake ranged from 10 to 24 kg ha−1 in field experiments, a high average AEN (75 kg kg−1 ) was recorded
synthetic fertilizer (TSP) applied treatment (T2 ). Conversely, in in the BoF treatment (T5 ). AEN increased by approximately 30%
the sole BoF treatment (T5 ), P uptake was 12 to 24 kg ha−1 , and in T3 parallel to FSFD (T2 ) treatment. FSFD treatment exhibited
average P uptake was 19 kg ha−1 , which proved a copious supply the lowest average AEN (23 kg kg−1 ) in the Boro irrigated
of available P from RP during the plant growth period. Average seasons. A similar PEN value (42 kg kg−1 ) was obtained in both
K uptake was high in both FSFD and BoF (2 t ha−1 ) + 70% urea T3 and T4 treatments, and the lowest value was found in the
N + 100% K as MoP (T3 ) compared with other fertilizer practices. T5 (28 kg kg−1 ) treatment. Application of full synthetic fertilizer
Reduction of 30% N from FSFD reduced average 12% P and 24% (T2 ) showed 8% less PEN compared with T2 and T3 treatments.
K uptake in the T. Aman wet seasons. The lowest N, P, and K The average partial factor productivity of applied N was highest
uptakes were found in the control treatment (Table 2). (170 kg kg−1 ) in the BoF (T5 ), followed by T4 (62 kg kg−1 ) and
In the Boro irrigated seasons, rice grain yield and plant T3 (56 kg ka−1 ) treatments. A full dose of synthetic fertilizer
nutrient uptakes were found higher than T. Aman wet seasons. application (T2 ) had the lowest (23 kg kg−1 ) PFPN . REN was
Nutrient uptakes by rice plant in Boro irrigated seasons were almost comparable in both FSFD (T2 ) and BoF (2 t ha−1 ) + 70%
illustrated in Table 2. Average N uptakes were 142 and 131 kg N as urea + 100% K as MoP treatment (T3 ); however, an
ha−1 in the T3 and T2 practices, respectively. N uptakes varied increment was observed in the T3 treatment. The highest REN
from 96 to 192 and 92 to 188 kg ha−1 in T3 and T2 treatment, (145 kg kg−1 ) was obtained in the BoF (T5 ) treatment. Compared
respectively, whereas they ranged from 88 to 141 and 71 to with T. Aman wet seasons, HIN was higher in the Boro irrigated
139 kg ha−1 in the T4 (30% reduced N from FSFD) and T5 (BoF) seasons, and the highest HIN (74 kg kg−1 ) was obtained in the
treatments, respectively. Reduction of 30% N from T2 reduced T4 , trailed by T3 (62 kg kg−1 ) treatment. Comparable values of
15% N uptake in T4 , whereas reduction of 70% synthetic N in HIN (49 kg kg−1 ) were obtained due to the application of full
the BoF (T5 ) in comparison with T3 reduced only 31% N uptake synthetic fertilizer (T1 ) or sole bio-organic fertilizer (T5 ) among
in Boro irrigated seasons, which proved Nr increment via bio- the field experiments (Figure 3B).
organic fertilizer. The average high P uptake was 35 kg ha−1 , and Triple superphosphate and RP were used as the source of P
it ranged from 22 to 44 kg ha−1 in the T3 , although hardly soluble nutrient in this study. Irrespective of the source, equal amounts
RP was used as the source of P. In contrast, the average P uptake of P were added to all treatments. Figure 4A explains the average
was 29 kg ha−1 and ranged from 20 to 40 kg ha−1 in the TSP data generated in T. Aman wet seasons from the eight field
applied FSFD treatment (T2 ). In general, N, P, and K uptakes were experiments and found that agronomic use efficiency of P was
highest in the T3 followed by T2 practice. Reduction of 30% N highest (27 kg kg−1 ) in the T3 treatment, where RP was used
from FSFD reduced 8.3% N, 26% P, and 10.38% K uptakes in T4 as P source during the formulation of bio-organic fertilizer.
treatment during the Boro irrigated seasons. Nonetheless, 23 and 16 kg kg−1 agronomic P use efficiency (AEP )
were recorded in the T2 and T4 treatments, respectively, where
TSP was the source of P. Approximately 12 kg kg−1 AEP was
Effect of Fertilizer Management found due to the application of sole BoF (T5 ). Similar to the
Practices on Agronomic N Use trend of AEP , the average productivity of P fertilizer [partial factor
Efficiency, Physiological N Use productivity of P (PFPP )] was 7% higher in the T3 (59 kg kg−1 )
followed by T2 (55 kg kg−1 ) treatment. Comparable PFPP was
Efficiency, N Recovery Efficiency, Partial
recorded in the T4 (48 kg kg−1 ) and T5 (45 kg kg−1 ) treatments.
Factor Productivity of N, and N Harvest REP was also higher in the T3 (16 kg kg−1 ) where the P source
Index was RP. Nevertheless, 13 kg kg−1 REP was found in the T2 ,
Across the eight field experiments in T. Aman wet seasons, the 9.91 kg kg−1 in the T5 , and the lowest REP (7 kg kg−1 ) was
average agronomic N use efficiency (AEN ) was higher in the bio- exhibited in the T4 treatment. In both circumstances, P source
organic fertilizer applied plots. The highest average AEN (46 kg was TSP. A similar HIP (67 kg kg−1 ) was found in the TSP applied
kg−1 ) was recorded in the sole BoF (T5 ) followed by the T3 treatments (T2 and T4 ), although a little higher (4%) average HIP
(32 kg kg−1 ) treatment (Figure 3A). Comparable N use efficiency (70 kg kg−1 ) was obtained in the RP added BoF (2 t ha−1 ) + 70%
was found in T2 (27 kg kg−1 ) and T4 treatment. However, 30% N as urea + 100% K as MoP treatment (T3 ). In the BoF (T5 )
synthetic N reduction in T3 increased by 22% AEN over T2 treatment, HIP was 64 kg kg−1 .
treatment that evidenced BNF contribution. Physiological N use In the Boro irrigated seasons, average P nutrient use
efficiency (PEN ) was also higher in T3 (46 kg kg−1 ) compared efficiencies and HIP were higher than in the T. Aman wet seasons
with T2 (39 kg kg−1 ), and the lowest PEN was found in T5 (Figure 4B). The highest AEP of 39 kg kg−1 P was found in
treatment. The average partial factor productivity of N (PFPN ) the T3 treatment, where the P source was RP from bio-organic
was high in T3 (85 kg kg−1 ) followed by T4 . The lowest PFPN fertilizer. Full synthetic fertilizer treatment (FSFD) exhibited an
Frontiers in Plant Science | www.frontiersin.org 7 March 2021 | Volume 12 | Article 602052Naher et al. Bio-organic Fertilizer to Supplement Synthetic N and P
TABLE 2 | Contribution of bio-organic and synthetic N, P, and K fertilizers on nutrient uptake (kilograms per hectare) in T. Aman wet seasons and Boro irrigated seasons.
Treatment T. Aman wet seasons Boro irrigated seasons
Uptake (kg ha−1 )
N P K N P K
T1 29 d 9c 30 c 4d 2d 6d
T2 90 a 19 b 67 a 12 b 4b 10 b
T3 92 a 21 a 69 a 13 a 4a 11 a
T4 69 c 17 b 54 b 7c 3c 8 bc
T5 79 b 19 b 55 b 17 c 3c 14 c
CV (%) 14.4 16.4 14.5 16.6 17.5 18.5
P-value 0.00 0.00 0.00 0.00 0.00 0.00
Data generated from field experiments conducted at BRRI research stations during years 2017–2020. Different lowercase letters within the column denote significant
differences between the treatments according to ANOVA and Duncan’s multiple range test at a 1% level of significance. T1 = Fertilizer control, T2 = full synthetic fertilizer
dose of N, P, and K at 80–20–50 as urea, triple superphosphate (TSP), and muriate of potash (MoP); T3 = BoF (2 t ha−1 ) + 70% N as urea + 100% K as MoP, T4 = 70%
N as urea + 100% P as TSP + 100% K as MoP T5 = Sole BoF at 2 t ha−1 BoF was added as dry weight basis.
AEP of 32 kg kg−1 , whereas T4 treatment gave 27 kg kg−1 gave 8.03 and 6.4% higher PFPN and PFPP , respectively, as
AEP . Approximately 22% AEP increased in T3 compared with compared with FSFD practice. The results mentioned earlier
T2 treatment, and a reduction of 30% N from FSFD reduced rejected the alternate hypothesis at a 0.05% level of significance
23% AEP in the T4 treatment. BoF (T5 ) exhibited the lowest and provided evidence of the efficacy of bio-organic fertilizer that
average AEP (21 kg kg−1 ) in the Boro irrigated seasons. Partial supplemented 30% Nr and 100% TSP in rice production over a
factor productivity of P fertilizer was also higher (70 kg kg−1 ) in full dose of chemical fertilizer treatment.
the BoF (2 t ha−1 ) + 70% N as urea + 100% K as MoP (T3 ),
where P source was RP. Synthetic fertilizer (TSP) application in Effect of Bio-Organic and Synthetic
T2 and T4 treatments gave an average of 63 and 58 kg kg−1 PFPP , Fertilizer on Soil Biochemical Properties
respectively. Sole application of BoF had 49 kg kg−1 PFPP . REP Different fertilizer management practices (4 years) affected soil
was 24 kg kg−1 in T3 (P source was RP) and 20 kg kg−1 in T2 biochemical properties (Table 4). Bio-organic fertilizer was an
(P source was TSP). Conversely, a 30% reduction of synthetic N organic-based component, and it contained 15% biochar as an
fertilizer reduced 81% REP in T4 compared with FSFD treatment ingredient, which improved soil carbon from 6 to 13% over
(T2 ). The lowest RE of 11 kg kg−1 was found in the T4 treatment. synthetic fertilizer. Application of synthetic fertilizer N, P, or K or
In the Boro irrigated seasons, the average HIP was analogous bio-organic fertilizer improved soil N, P, K, and S concentration
regardless of treatments. compared with control treatment. The population of free-living
N2 fixing bacteria and PSB significantly increased over synthetic
fertilizer treatment, which proved strain survivability in the
Farmers’ Field Demonstration Trials vicinity. In general, the application of bio-organic fertilizer
Partial factor productivity of N, P fertilizer, plant growth, enriched soil carbon and biology with beneficial bacteria.
and yield parameters were subjected to pooled analysis via a
two-tailed t-test with the following hypothesis: H0 : BoF (2 t
ha−1 ) + 70% N as urea + 100% K as MoP treatment (T1 ) DISCUSSION
supplemented by 30% Nr, which had eliminated 100% TSP in
rice production and produced higher plant height, tiller number, Results of our field experiments and farmers’ field trials proved
panicle number, grain yield, and PFPN and PFPP compared that PGPB could compensate at least 30% Nr and eliminate 100%
with full-dose synthetic fertilizer (FSFD) application (T2 ), Ha : TSP requirement of rice plants without sacrificing yield. In the
BoF (2 t ha−1 ) + 70% N as urea + 100% K, (T1 ), which was present study, potential indigenous PGPB were isolated from
not able to supplement 30% Nr, had eliminated 100% TSP in the floodplain, terrace, and saline soils and identified mostly as
rice production and produced lower plant height, tiller number, Bacillus and Paenibacillus spp. The ability of BNF P solubilization
panicle number, grain yield, and PFPN and PFPP compared and IAA production by these potential bacteria were quantified
with FSFD treatment (T2 ). The statistical analyses obtained and found that all the strains have those relevant mechanisms
from 18 field demonstration trials are illustrated in Table 3. to complement plant nutrients and augment plant growth. Our
Irrespective of soil and climate across the farmers’ field trials, findings were concomitant with the research results of Kuan et al.
T1 produced higher average plant height (5.4%), tiller number (2016), Weselowski et al. (2016), Xie et al. (2016), and Li et al.
(6.1%), panicle number (8.8%), and grain yield (7.2%) compared (2017) where elucidated Bacillus and Paenibacillus spp. mediated
with the full dose of synthetic fertilizer (T2 ) application. Partial crop growth promotion with the involvement of those single or
factor productivity of N and P were calculated, and it was found combined mechanisms. Nevertheless, PGPB-mediated nutrient
that BoF (2 t ha−1 ) + 70% N as urea + 100% K treatment acquisition and mechanisms of crop growth promotion in food
Frontiers in Plant Science | www.frontiersin.org 8 March 2021 | Volume 12 | Article 602052Naher et al. Bio-organic Fertilizer to Supplement Synthetic N and P FIGURE 3 | Effect of fertilizer management practices on agronomic efficiency of N (AEN ), physiological efficiency of N (PEN ), partial factor productivity of N (PFPN ), recovery efficiency of N (REN ), and N harvest index (HIN ). Data generated from field experiments conducted at BRRI research stations (eight experiments in each season) during years 2017–2020. (A) T. Aman wet seasons, (B) Boro irrigated seasons. Error bar indicates standard error (n = 24). FSFD, full synthetic fertilizer dose of N, P, and K at 80–20–50 and 140–20–80 kg ha−1 as urea, triple superphosphate (TSP), and muriate of potash (MoP) in T. Aman wet and Boro irrigated seasons, respectively. BoF (2 t ha−1 ) + 70% N as urea + 100% K as MoP; 70% N as urea + 100% P as TSP + 100% K as MoP. Sole BoF at 2 t ha−1 . BoF was added as dry weight basis. crops were also documented by Brown (1974), Burr et al. (1978), Akintokun et al. (2019). The potentiality of N2 fixation by applied Teintze et al. (1981), Lin et al. (1983), and Jacoby et al. (2017). inoculant was reflected in the plant N uptake. The study report In the formulated bio-organic fertilizer, the BNF capacity showed that regardless of seasons, N uptake was similar in was varied among the PGPB isolates, and our biochemical both full synthetic fertilizer (T2 ) and bio-organic fertilizer (2 t analysis proved P. polymyxa, Proteus sp., and Bacillus spp. ha−1 ) + 70% N as urea + 100% K as muriate of potash have a higher capacity of NH4 production. The prospect of applied treatment (T3 ). Although 70% synthetic N was reduced Paenibacillus sp. to be used as bioinoculant was reported by in the bio-organic fertilizer treatment (T5 ) in comparison to T3 Goswami et al. (2015), where the strain produced 3.6 mg kg−1 treatment, N uptake reduction was only 16–31% in T5, which NH4 within 96 h, and the rate of NH4 production was in firmly supported the incidence of adequate Nr in bio-organic agreement with our study. Individual N2 supplying capability fertilizer and also established the N delivering capacity of Bacillus of P. polymyxa, B. cereus, and Proteus sp. in association with and Paenibacillus spp. throughout the plant growing seasons. cereal crops were also reported by Jimtha et al. (2017) and Kuan et al. (2016) also reported the BNF potentiality of several Frontiers in Plant Science | www.frontiersin.org 9 March 2021 | Volume 12 | Article 602052
Naher et al.                                                                                                          Bio-organic Fertilizer to Supplement Synthetic N and P

  FIGURE 4 | Effect of fertilizer management practices on agronomy use efficiency of P (AEP ), partial factor productivity of P (PFPP ), recovery efficiency of P (REP ), and
  P harvest index (HIP ). Data generated from field experiments conducted at BRRI research stations (eight experiments in each season) during years 2017–2020. (A) T.
  Aman wet seasons, (B) Boro irrigated seasons. Error bar indicates standard error (n = 24). FSFD, full synthetic fertilizer dose of N, P, and K at 80–20–50 and
  140–20–80 kg ha−1 as urea, triple superphosphate (TSP), and muriate of potash (MoP) in T. Aman wet and Boro irrigated seasons, respectively. BoF (2 t
  ha−1 ) + 70% N as urea + 100% K as MoP; 70% N as urea + 100% P as TSP + 100% K as MoP. Sole BoF at 2 t ha−1 . BoF was added as dry weight basis.

TABLE 3 | Plant height, tiller number, panicle number, grain yield, and partial factor productivity of N and P as influenced by bio-organic and synthetic fertilizers at
farmers’ field demonstration trials (18) during years 2017–2020 (n = 18).

Parameters               Plant height           Tiller number/m2             Panicle number/m2              Grain yield (t ha−1 )                PFPN                  PFPP

                         T1         T2          T1            T2            T1              T2               T1             T2             T1            T2       T1          T2

Mean                   89.35       84.8        245           230            222            204               5             4.66           58.10         53.78     50          47
Variance               23.39      36.58       5603           5329           645            5986            1.968          1.958            273          295      196          196
T stat                 2.098                  2.649                        2.51                            2.874                          3.030                 1.729
P (T
Naher et al. Bio-organic Fertilizer to Supplement Synthetic N and P
TABLE 4 | Effect of bio-organic and synthetic N, P, K fertilizers on soil biochemical properties.
Treatments N OC Extractable. P Exch. K Avail. S Free-living N2 fixing *PSB
(g kg−1 ) (g kg−1 ) (mg kg−1 ) (mg kg−1 ) (mg kg−1 ) bacteria (Cfu g−1 soil)
(CFU g−1 soil)
T1 1.1 ± 0.1 15 ± 1 22 ± 3.2 42.9 ± 3.9 21 ± 0.3 2.4 × 10⁴ 6.2 × 10⁴
T2 1.4 ± 0.1 15 ± 3 30 ± 3.6 58.5 ± 4.2 23 ± 1.0 4.1 × 10⁵ 8.1 × 10⁵
T3 1.4 ± 0.08 17 ± 1 31 ± 0.3 58.5 ± 2.3 24 ± 0.4 5.3 × 10⁸ 2.8 × 10⁸
T4 1.3 ± 0.1 15 ± 2 26 ± 1.2 50.7 ± 4.0 22 ± 1.0 2.2 × 10⁴ 3.4 × 10⁵
T5 1.3 ± 0.09 16 ± 1 31 ± 2.2 58.5 ± 3.9 24 ± 1.5 6.1 × 10⁷ 2.9 × 10⁸
Average values generated from the field experiments conducted at BRRI research station Gazipur and Cumilla during years 2017–2020 (two cycles each year). (Standard
deviation, n = 24) T1 , BoF (2 t ha−1 ) + 70% N as urea + 100% K as MoP, T2 , FSFD (full synthetic fertilizer dose of N, P, and K fertilizer as urea, triple superphosphate,
and muriate of potash. N, P, K, and S at 80–20–50 and 140–20–80 kg ha−1 applied in the T. Aman wet and Boro irrigated seasons, separately). BoF, bio-organic fertilizer
applied as dry weight basis. *PSB, phosphate solubilizing bacteria.
Bacillus spp. and found B. pumilus alone supplemented 30.5% P. polymyxa was strongly supported by Xie et al. (2016); Hao
N requirement in maize. Furthermore, AEN , PEN , REN , and and Chen (2017), and Hashem et al. (2019). Similar to the
HIN were higher in the bio-organic fertilizer applied treatments. N nutrient, P uptake and use efficiencies were apparent in
Incidence of 30% synthetic N reduction increased 21% RE bioavailable P from RP during plant growth. In our study,
in T4 compared with full synthetic fertilizer (T2 ) treatment, approximately 21% lower P uptake was noticed in T2 compared
and the same reduction of synthetic N had increased 29% with T3 treatment that revealed spontaneously bioavailable P in
RE in the bio-organic with reduced N and TSP omitted (T3 ) the RP added treatment. We also found that, regardless of P
treatment and repeatedly proved the efficacy of applied free-living sources, comparable values of AEP and REP were obtained in
N2 fixing bacteria to supplement Nr fertilizer. In comparison both TSP fertilizer and RP applied treatments. However, lower
with synthetic and bio-organic fertilizer, PFPN of bio-organic AEP and PFPP values were obtained in the sole bio-organic
fertilizer was higher. Besides research results, a significantly fertilizer treatment (T5 ) due to low grain yield in the N and K
(p < 0.05) higher N partial factor productivity value of bio- deficient conditions.
organic fertilizer (2 t ha−1 ) + 70% N as urea + 100% K as muriate The values obtained for REP were concomitant with Baligar
of potash was obtained in the farmers’ field demonstration et al. (2001), Pheav et al. (2003), and Roberts and Johnston
trials that again supported the efficacy of bio-organic fertilizer (2015). A parallel HIP also proved the similar trend of P nutrient
to complement synthetic N. According to Dobermann (2007) from both sources. Partial factor productivity of fertilizer was
and Fixen (2007), the best nutrient management practice and used to evaluate the fertilizer use efficiency (Chuan et al., 2016),
agronomic use efficiency of N synthetic fertilizer should be and the partial factor productivity of P obtained from both
greater than 25 kg kg−1 , and RE should be 50–80%. Results farmers’ field trials and field experiments (total 36) proved the
of our field experiments provide evidence that the treatment efficacy of applied bio-organic fertilizer to replace 100% TSP in
comprised bio-organic fertilizer crossed the ranges described rice production.
earlier. Furthermore, the values of N use efficiencies and partial Besides PGPB-mediated BNF and P solubilization from RP,
factor productivity consequent in our study were in the array the contribution of IAA was remarkable for plant growth
described by Che et al. (2015). promotion (Shen et al., 2016). A considerable amount of
The TSP is a commonly used synthetic fertilizer utilized to IAA production by B. cereus (Akintokun et al., 2019) and
accomplish P nutrition in rice production. RP is the natural P. polymyxa (Liu et al., 2019) were concomitant with our
source of P, and it is the main ingredient of TSP fertilizer; research result. This particular growth hormone modulated
however, the hardly soluble criteria of RP limited its use in rice rice root architecture (Biswas et al., 2000) that enables higher
production. In the study, TSP fertilizer was substituted by RP nutrient acquisition for plants and impacts crop growth
with the assistance of B. pumilus, B. cereus, and Paenibacillus and yield (Di Benedetto et al., 2017). Significantly taller
sp., and these PGPB strains effectively abounded an adequate plants were noticed in the bio-organic treated farmers’ field
amount of bioavailable P from RP during the rice-growing demonstration trials, which might be the resultant effect of
period. Microbial-mediated P mobilization was mentioned by IAA production by the Bacillus and Paenibacillus spp. Across
many scientists (Nahas, 1996; Rodrıìguez and Fraga, 1999; the 18 field experiments, treatment contained bio-organic
Plassard et al., 2011; Panhwar et al., 2013; Ahemad and Kibret, fertilizer (2 t ha−1 ) with 30% reduced N, 100% K, and TSP
2014). In the study, we noticed Paenibacillus and Bacillus eliminated treatment (T3 ) produced 10–13% higher grain yield
spp. solubilized 0.1–1.2 g kg−1 P from RP. Several studies compared with full synthetic fertilizer treatment. Grain yield
supported our findings, where they reported RP solubilizing increment aligned with the result of Schütz et al. (2018),
capacity of B. pumilus was 0.35 g kg−1 (Dipta et al., 2017) which reported approximately 14% of crop yield response
and B. cereus 0.2 g kg−1 (Akintokun et al., 2019). However, due to microbial inoculant application from the meta-analysis
Din et al. (2020) reported P. polymyxa to solubilize 2.6 g kg−1 of 66 experiments in the tropical climate. Depending on
P from tricalcium phosphate. Furthermore, P solubilization by seasons, 30% Nr cutoff from full synthetic fertilizer treatment
Frontiers in Plant Science | www.frontiersin.org 11 March 2021 | Volume 12 | Article 602052Naher et al. Bio-organic Fertilizer to Supplement Synthetic N and P
(T2 ) reduced approximately 8–19% grain yield in the synthetic (15%), and the living cells of PGPB, mostly Bacillus, Proteus,
fertilizer treatment (T4 ); nevertheless, the same reduction of and Paenibacillus spp., which were isolated from the floodplain,
Nr in bio-organic fertilizer treatment (T3 ) evidenced 13% terrace, and saline soils. The results of 16 field experiments
higher grain yield. Yield increment incident has proven the and 18 farmers’ demonstration trials proved that added PGPB
spontaneous Nr and P supply by PGPB, and there was no supplemented 30% synthetic N requirement of rice production
hidden hunger for these nutrients. Field experiments result through BNF and fully complemented available P from RP by
showed that the total contributions of bio-organic fertilizer solubilization during the plant growth period. IAA production
on grain yield production were 65.83% in T. Aman wet by the PGPB might have promoted plant growth and resulted
seasons and 66.79% in the Boro irrigated seasons. Recently, in taller plants of the bio-organic added treatment. The organic
rice yield increases due to integrated approaches of organic, matter and biochar improved soil nutrient and carbon content
synthetic, and microbial inoculants, which have been reported as well. The combined effect of living ingredients and organic
by Yadav et al. (2019). A combination of both functional matter of the bio-organic fertilizer saved 30% urea-N, eliminated
traits was more effective than single traits. Combined activity 100% TSP fertilizer use in rice production, and simultaneously
of nutrient supplement and plant growth promotion by improved nutrient uptake, N, P use efficiencies, rice yield,
PGPB were reflected on plant nutrient uptake, N and P use and soil health.
efficiencies, and rice grain yield in the bio-organic fertilizer
(2 t ha−1 ) with 30% reduced N, 100% K, and TSP eliminated
treatment. Conversely, in the farmers’ field demonstration trials, DATA AVAILABILITY STATEMENT
significantly (P < 0.05) higher partial factor productivity of N
and P, plant height, tiller production, panicle number, and grain The raw data supporting the conclusions of this article will be
yield were obtained in the same treatment. The results of the made available by the authors, without undue reservation.
farmers’ field demonstration trials firmly strengthen our field
research findings.
After harvest of the eight crop cycle, soil nutrient contents AUTHOR CONTRIBUTIONS
were analyzed, and it was found that the application of bio-
organic fertilizer improved soil health. Bio-organic fertilizer UAN and JCB developed technology and wrote the manuscript.
provided adequate mineral nutrients, organic matter, and MIUS and AJ did laboratory analysis. FHK, MHRH, AI, MM,
beneficial microbial population and thus altered soil biochemical and MBH conducted experiments in BRRI research stations and
properties. It was known that soil organic carbon is an attached with farmers’ field demonstration trials. MRI and MSK
indicator of soil health by Biancalani et al. (2012), and provided the facilities to conduct experiments in BRRI research
maintaining soil quality and plant productivity requires stations. All authors contributed to the article and approved the
microbial diversity and an adequate number of bacteria in submitted version.
the soil system (Li C. et al., 2014; Li Y. et al., 2014). The
abundance of PGPB due to the application of bio-organic
fertilizer was noticed after the crop harvest. The spore- FUNDING
forming character of Bacillus and Paenibacillus spp. (Bloemberg
This work was generated in a government organization (BRRI).
and Lugtenberg, 2001) was a unique character that enables
There is no commercial link.
survival of the added PGPB in a wide range of soil and
environment. In short, the study report confirmed (4 years’)
application of bio-organic fertilizer, which contained organic ACKNOWLEDGMENTS
matter, biochar, and PGPB, improved soil organic carbon,
and enriched soil with PGPB as compared with full synthetic We thank BRRI, Competitive Research Grant of NATP-2,
fertilizer application. Krishi Gobeshona Foundation, South Asian Nitrogen
Hub, and International Nitrogen Management System for
research funding.
CONCLUSION
Emerging demand for food production made rice cultivation SUPPLEMENTARY MATERIAL
dependent on synthetic fertilizer and augmenting environmental
pollution. Bio-organic fertilizer that exhibited various qualities, The Supplementary Material for this article can be found
such as nutrient acquisition and plant growth promotion of rice, online at: https://www.frontiersin.org/articles/10.3389/fpls.2021.
is an organic-based biofertilizer that contains RP (5%), biochar 602052/full#supplementary-material
Frontiers in Plant Science | www.frontiersin.org 12 March 2021 | Volume 12 | Article 602052Naher et al. Bio-organic Fertilizer to Supplement Synthetic N and P
REFERENCES Fixen, P. (2007). Understanding and improving nutrient use efficiency as an
application of information technology. 52–59. Paper presented at the Proc. of the
Ahemad, M., and Kibret, M. (2014). Mechanisms and applications of plant growth Symp. on Information Tech. in Soil Fertility and Fertilizer Management. Beijing:
promoting rhizobacteria: current perspective. J. King Saud Univ.-Sci. 26, 1–20. China Agric. Press.
doi: 10.1016/j.jksus.2013.05.001 Goswami, D., Parmar, S., Vaghela, H., Dhandhukia, P., and Thakker, J. N. (2015).
Akintokun, A., Ezaka, E., Akintokun, P., Shittu, O., and Taiwo, L. (2019). Isolation, Describing Paenibacillus mucilaginosus strain N3 as an efficient plant growth
Screening and Response of Maize to Plant Growth Promoting Rhizobacteria promoting rhizobacteria (PGPR). Cogent. Food Agricult. 1:1000714. doi: 10.
Inoculants. Sci. Agricult. Bohemica 50, 181–190. doi: 10.2478/sab-2019-0025 1080/23311932.2014.1000714
Amundson, R., Berhe, A. A., Hopmans, J. W., Olson, C., Sztein, A. E., and Sparks, Hao, T., and Chen, S. (2017). Colonization of wheat, maize and cucumber by
D. L. (2015). Soil and human security in the 21st century. Science 348:6235. Paenibacillus polymyxa WLY78. PLoS One 12, 1–10. doi: 10.1371/journal.pone.
doi: 10.1126/science.1261071 0169980
Baligar, V., Fageria, N., and He, Z. (2001). Nutrient use efficiency in plants. Hashem, A., Tabassum, B., and Abd, A. E. F. (2019). Bacillus subtilis: A plant-
Commun. Soil Sci. Plant Anal. 32, 921–950. growth promoting rhizobacterium that also impacts biotic stress. Saudi J. Biol.
Battye, W., Aneja, V. P., and Schlesinger, W. H. (2017). Is nitrogen Sci. 26, 1291–1297. doi: 10.1016/j.sjbs.2019.05.004
the next carbon? Earth’s Fut. 5, 894–904. doi: 10.1002/2017ef00 Huang, S., Zhao, C., Zhang, Y., and Wang, C. (2018). Nitrogen use efficiency in
0592 rice. Nitr. Agricult. Updat. doi: 10.5772/intechopen.69052
BBS (2017). Year book of agricultural statistics. Bangladesh: Bangladesh Bureau of Hurek, T., Egener, T., and Reinhold-Hurek, B. (1997). Divergence in nitrogenases
statistics, 576. of Azoarcus spp. Proteobacteria of the beta subclass. J. Bacteriol. 179, 4172–
Biancalani, R., Petri, M., Bunning, S., Salvatore, M., and Tubiello, F. (2012). The 4178. doi: 10.1128/jb.179.13.4172-4178.1997
use of soil organic carbon as an indicator of soil degradation. Energia Ambiente IFA (2016). International fertilizer association. Available online at: https://www.
e Innovazione 4, 73–78. fertilizer.org/En/Statistics/PIT_Excel_Files.aspx [accessed on Feb 5, 2018]
Biswas, J. C., Ladha, J. K., and Dazzo, F. B. (2000). Rhizobial innoculation improves Islam, S. M., Gaihre, Y. K., Shah, A., Singh, U., Sarkar, M. I. U., Satter, M. A., et al.
uptake and growth of lowland rice. Am. J. Soil Sci Soc. 64, 1644–1650. doi: (2016). Rice yields and nitrogen use efficiency with different fertilizers and water
10.2136/sssaj2000.6451644x management under intensive lowland rice cropping systems in Bangladesh.
Bloemberg, G. V., and Lugtenberg, B. J. (2001). Molecular basis of plant growth Nutr. Cycling Agroecosyst. 106, 143–156. doi: 10.1007/s10705-016-9795-9
promotion and biocontrol by rhizobacteria. Curr. Opin. Plant Biol. 4, 343–350. Jacoby, R., Peukert, M., Succurro, A., Koprivova, A., and Kopriva, S. (2017). The
doi: 10.1016/s1369-5266(00)00183-7 role of soil microorganisms in plant mineral nutrition—current knowledge and
Bray, R. H., and Kurtz, L. (1945). Determination of total, organic, and available future directions. Front. Plant Sci. 8:1617. doi: 10.3389/fpls.2017.01617
forms of phosphorus in soils. Soil Sci. 59, 39–46. doi: 10.1097/00010694- Jahiruddin, M., and Satter, M. A. (2010). Agricultural Research Priority: Vision
194501000-00006 2030 and Beyond—Subsector: Land and Soil Resource Management. Dhaka:
Bremner, J., and Mulvaney, C. (1982). “Nitrogen-total in,” in Methods of soil Bangladesh Agricultural Research Council.
analysis. Part 2: Chemical and microbiological properties, ed. L. Page (Madison, Jimtha, J. C., Mathew, J., and Radhakrishnan, E. (2017). Bioengineering of
USA: Am. Soc. Agron), 595–624. Dioscorea nipponica with rhizospheric Proteus spp. for enhanced tuber size and
Brown, M. E. (1974). Seed and root bacterization. Annu. Review Phytopathol. 12, diosgenin content. 3 Biotech. 7:261. doi: 10.1007/s13205-017-0886-3
181–197. doi: 10.1146/annurev.py.12.090174.001145 Kuan, K. B., Othman, R., Abdul Rahim, K., and Shamsuddin, Z. H. (2016). Plant
Burr, T. J., Schroth, M. N., and Suslow, T. (1978). Increased potato yields by growth-promoting rhizobacteria inoculation to enhance vegetative growth,
treatment of seed pieces with specific strains of Pseudomonas fluorescens and nitrogen fixation and nitrogen remobilisation of maize under greenhouse
P. putida. Phytopathology 68, 1377–1383. doi: 10.1094/phyto-68-1377 conditions. PLoS One 11, 1–19. doi: 10.1371/journal.pone.0152478
Canfield, D. E., Glazer, A. N., and Falkowski, P. G. (2010). The evolution and future Ladha, J., Tirol-Padre, A., Reddy, C., Cassman, K., Verma, S., Powlson, D., et al.
of Earth’s nitrogen cycle. Science 330, 192–196. doi: 10.1126/science.1186120 (2016). Global nitrogen budgets in cereals: A 50-year assessment for maize, rice
Cappucino, J. C., and Sherman, N. (eds) (1992). Microbiology: A laboratory manual. and wheat production systems. Scient. Rep. 6, 1–9. doi: 10.1038/srep19355
(3rd ed.). New York, NY: Benjamin/Cumming. Ladha, J. K., Pathak, H., Krupnik, T. J., Six, J., and van Kessel, C. (2005). Efficiency
Che, S.-G., Zhao, B.-Q., Li, Y.-T., Liang, Y., Wei, L., Lin, Z.-A., et al. (2015). of fertilizer nitrogen in cereal production: retrospects and prospects. Adv.
Review grain yield and nitrogen use efficiency in rice production regions Agron. 87, 85–156. doi: 10.1016/s0065-2113(05)87003-8
in China. J. Integr. Agricult. 14, 2456–2466. doi: 10.1016/S2095-3119(15) Li, Y., Liu, X., Hao, T., and Chen, S. (2017). Colonization and maize growth
61228-X promotion induced by phosphate solubilizing bacterial isolates. Int. J. Mole. Sci.
Chuan, L., He, P., Zhao, T., Zheng, H., and Xu, X. (2016). Agronomic 18:1253. doi: 10.3390/ijms18071253
characteristics related to grain yield and nutrient use efficiency for wheat Li, Y., Zhang, W., Zheng, D., Zhou, Z., Yu, W., Zhang, L., et al. (2014). Genomic
production in China. PLoS One 11:e62802. doi: 10.1371/journal.pone.0162802 evolution of Saccharomyces cerevisiae under Chinese rice wine fermentation.
Di Benedetto, D. N. A., Corbo, M. R., Campaniello, D., Cataldi, M. P., Bevilacqua, Genome Biol. Evol. 6, 2516–2526. doi: 10.1093/gbe/evu201
A., Sinigaglia, M., et al. (2017). The role of plant growth promoting bacteria in Li, C., Yan, K., Tang, L., Jia, Z., and Li, Y. (2014). Change in deep soil microbial
improving nitrogen use efficiency for sustainable crop production: a focus on communities due to long-term fertilization. Soil Biol. Biochem. 75, 264–272.
wheat. AIMS Microbiol. 3, 413–434. doi: 10.3934/microbiol.2017.3.413 doi: 10.1016/j.soilbio.2014.04.023
Dick, W., and Tabatabai, M. (1977). Determination of orthophosphate in aqueous Lin, W., Okon, Y., and Hardy, R. W. (1983). Enhanced mineral uptake by Zea
solutions containing labile organic and inorganic phosphorus compounds. mays and Sorghum bicolor roots inoculated with Azospirillum brasilense. Appl.
J. Environ. Q. 6, 82–85. doi: 10.2134/jeq1977.00472425000600010018x Environ. Microbiol. 45, 1775–1779. doi: 10.1128/aem.45.6.1775-1779.1983
Din, A. R. J. M., Rosli, M. A., Azam, Z. M., Othman, N. Z., and Sarmidi, M. R. Liu, X., Li, Q., Li, Y., Guan, G., and Chen, S. (2019). Paenibacillus strains with
(2020). paenibacillus polymyxa role involved in phosphate solubilization and nitrogen fixation and multiple beneficial properties for promoting plant growth.
growth promotion of zea mays under abiotic stress condition. Proc. Natl. Acad. Peer J 7, 1–19. doi: 10.7717/peerj.7445
Sci. India Sect. B Biol. Sci. 90, 63–73. doi: 10.1007/s40011-019-01081-1 Murphy, J., and Riley, J. P. (1962). A modified single solution method for the
Dipta, B., Kirti, S., Bhardwaj, S., Gupta, S., and Kaushal, R. (2017). Phosphate determination of phosphate in natural waters. Analyt. Chim. Acta 27, 31–36.
solubilizing potential of Bacillus pumilus for the enhancement of Cauliflower doi: 10.1016/s0003-2670(00)88444-5
(Brassica oleracea var. botrytis L.). Ecol. Environ. Cons. 23, 1541–1548. Nahas, E. (1996). Factors determining rock phosphate solubilization by
Dobermann, A. (2007). Nutrient use efficiency–measurement and management. microorganisms isolated from soil. World J. Microbiol. Biotechnol. 12, 567–572.
Fertilizer Best Manag. Pract. 1:2007. doi: 10.1007/bf00327716
Doran, J. W., and Zeiss, M. R. (2000). Soil health and sustainability: managing the Naher, U., Radziah, O., Shamsuddin, Z., Halimi, M., and Razi, M. (2009). Isolation
biotic component of soil quality. Appl. Soil Ecol. 15, 3–11. doi: 10.1016/s0929- of diazotrophs from different soils of Tanjong Karang rice growing area in
1393(00)00067-6 Malaysia. Int. J. Agric. Biol 11, 547–552.
Frontiers in Plant Science | www.frontiersin.org 13 March 2021 | Volume 12 | Article 602052You can also read