Biomass Burning and Gas Flares create the extreme West African Aerosol Plume which perturbs the Hadley Circulation and thereby changes Europe's ...
←
→
Page content transcription
If your browser does not render page correctly, please read the page content below
Preprints (www.preprints.org) | NOT PEER-REVIEWED | Posted: 31 August 2021                       doi:10.20944/preprints202108.0554.v1

                Article

                Biomass Burning and Gas Flares create the extreme
                West African Aerosol Plume which perturbs the
                Hadley Circulation and thereby changes Europe’s
                winter climate
                Keith A. Potts1

                                               1. Kyna Keju Pty Ltd;
                                               * Correspondence: Keith.Potts@bigpond.com;

                                               Abstract: Europe’s winter climate has experienced three significant changes
                                               recently: increased UK flooding; Iberian drought; and warmer temperatures
                                               north of the Alps. The literature links all three to a persistent, significant
                                               increase in sea level pressure over the Mediterranean and Iberia which
                                               changes the atmospheric circulation system by: forcing cold fronts north away
                                               from Iberia; and creating a south westerly flow around the high-pressure
                                               region bringing warmer, moist air from the subtropical Atlantic to Europe
                                               which increases UK precipitation and European temperatures. Here I show,
                                               using modelled, reanalysis and measured data, that: the extreme,
                                               anthropogenic, West African aerosol Plume (WAP) which exists from late
                                               December to early April perturbs the northern, regional Hadley Circulation
                                               creating the high-pressure region; and that the WAP has only existed in its
                                               extreme form in recent decades as the major sources of the aerosols: biomass
                                               burning; and gas flaring have both increased significantly since 1950 due to: a
                                               four-fold increase in population (United Nations); and gas flaring rising from
                                               zero to 7.4 billion m3/annum (Global Gas Flaring Reduction Partnership). I
                                               also suggest that the WAP can be eliminated and Europe’s winter climate
                                               returned to its natural state after the crucial first step of recognising the cause
                                               of the changes is taken.

                                               Keywords: Biomass burning; Anthropogenic aerosols; West Africa; United
                                               Kingdom Floods; Iberian Drought; European winter temperatures; Last
                                               Millennium Ensemble; NASA MERRA-2;

            © 2021 by the author(s). Distributed under a Creative Commons CC BY license.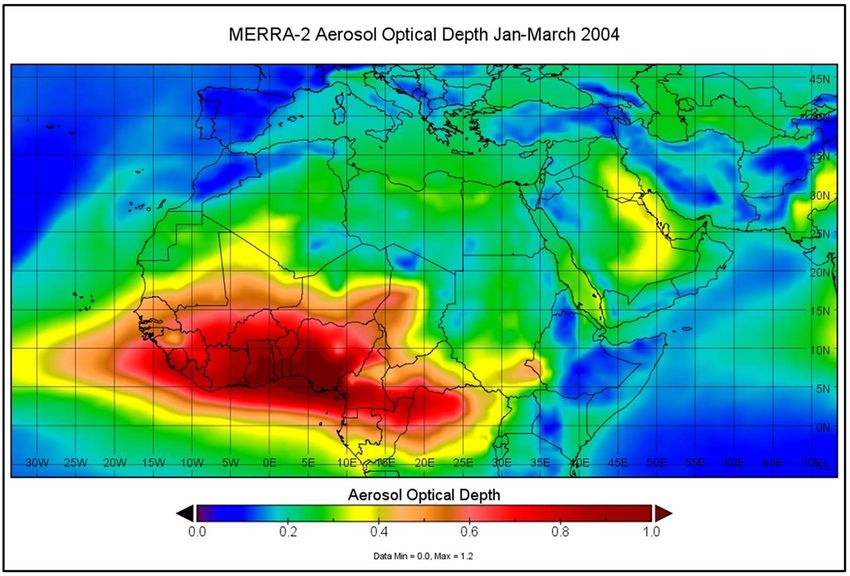
Preprints (www.preprints.org) | NOT PEER-REVIEWED | Posted: 31 August 2021 doi:10.20944/preprints202108.0554.v1
INTRODUCTION
The extreme West African aerosol Plume (WAP) is one of eight
continental scale aerosol plumes (Appendix A). It perturbs the
northern Hadley circulation in winter creating anomalous high
pressure over Southern Europe, the Mediterranean Sea, Iberia and the
Eastern Atlantic (SEMIEA) which creates floods in the United
Kingdom (UK), drought in Iberia and warmer temperatures north of
the Alps.
1.1 Floods in the United Kingdom
The UK has experienced significant floods in winter and early
spring in recent decades with 1998, 2000, 2001, 2002, 2005, 2009, 2010,
2012, 2014, 2015, 2019 and 2020 noted as significant rainfall/flood
events on the UK Met. Office website demonstrating a return
frequency of about 2 years. In 2020 and 2021 storms Ciara, Dennis,
Bella and Christoph unleashed more UK floods with Dennis causing
an estimated five fatalities in the UK (Mirror
https://www.mirror.co.uk/news/uk-news/fears-missing-woman-87-
sixth-21530531) and the Association of British Insurers estimating the
damage at £360 million (https://www.abi.org.uk/news/news-
articles/2020/03/insurance-pay-outs-to-help-customers-recover-from-
storms-ciara-and-dennis-set-to-top-360-million/). Determining the
cause of such events and why they are of such severity in recent
decades is therefore crucial socially, economically and scientifically to
enable mitigation action to start.
The literature includes:
From a 558 year paleorecord of floods derived from Lake
Bassenthwaite sediment “the cluster of devastating floods from
1990 to present is without precedent” [1] . This time period
coincides with the WAP reaching average aerosol optical depth
(AOD) levels from January to March (JFM) consistently above 0.5
in the MERRA-2 [2] data.
In winter in 2013-14 a rapid succession of Atlantic low pressure
systems crossed the UK with large increases in rainfall in the
south of England and much of Scotland [3] noting “The role of
anthropogenic aerosol effects requires further work, especially on
tropical atmospheric circulation and hence rainfall”.
A regional climate model investigation into the effects of
anthropogenic emissions on the winter climate of the UK [4] only
refers to “sulphate aerosol precursors” and it cannot therefore
have included the effects of the WAP which is predominantly
carbonaceous (Appendix B). However, the paper noted “More
studies of this nature are needed if loss and damage from
anthropogenic climate change are to be quantified objectively
and future assessments of the impacts of climate change are to
progress from attributing them simply to changes in climate
which are not themselves explained, to attributing them
specifically to human influence.”.
Atmospheric rivers flowing from the subtropical Atlantic
preceded the ten largest winter flood events in British river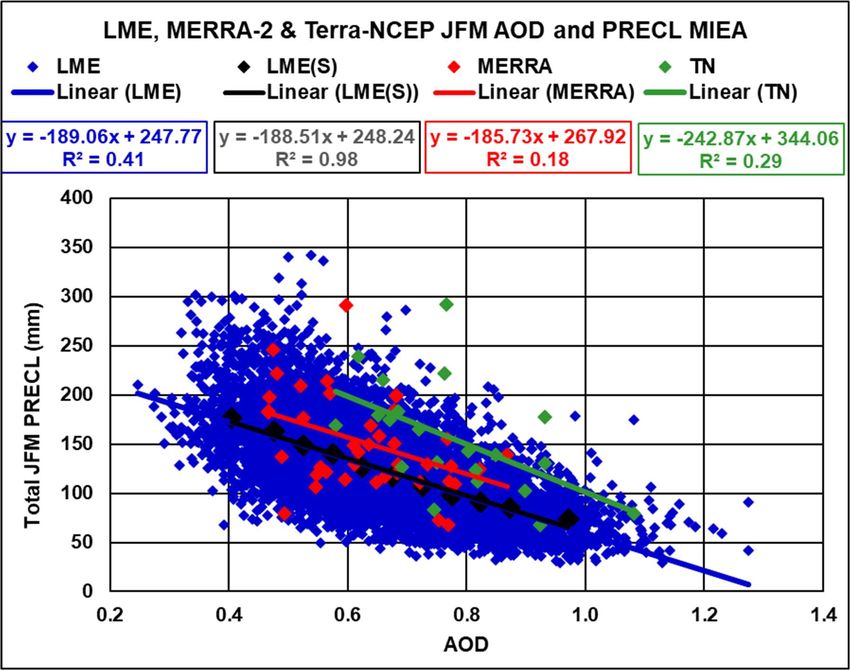
Preprints (www.preprints.org) | NOT PEER-REVIEWED | Posted: 31 August 2021            doi:10.20944/preprints202108.0554.v1

                                                basins and the SW-NE tilt in the large-scale atmospheric flow is
                                                crucial [5]. Figure 2(b) in this paper shows high pressure over
                                                SEMIEA.
                1.2   Drought in Spain
                                                A significant driver of the 2004/05 hydrological year drought in
                                           Iberia was “an impressive northward displacement of cyclone
                                           trajectories in the North Atlantic sector in winter months resulting in
                                           an almost complete absence of cyclones crossing Iberia and western
                                           Europe.” [6] and “The results … show the (North Atlantic Oscillation)
                                           NAO and (East Atlantic) EA indexes …incapable to detect the low
                                           precipitation totals in March.”.
                                                An increase in the number of anti-cyclonic (higher than average
                                           pressure) days in winter from 1950 to 2000 which results in lower
                                           rainfall in NE Spain was found in an investigation of the relationship
                                           between the occurrence of drought in NE Spain and atmospheric
                                           circulation [7].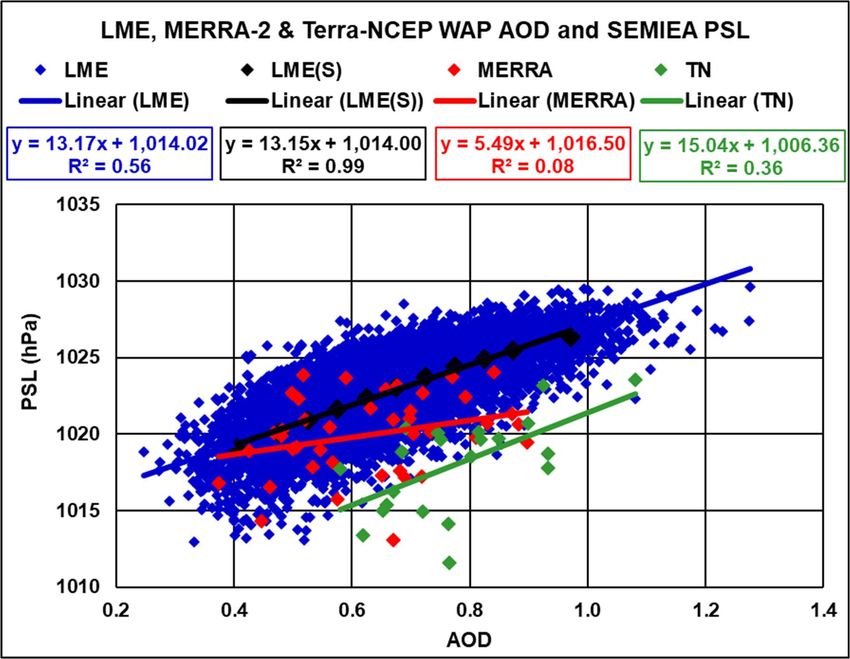
Preprints (www.preprints.org) | NOT PEER-REVIEWED | Posted: 31 August 2021 doi:10.20944/preprints202108.0554.v1
1.3 Higher Winter Temperatures in Northern Europe
The Intergovernmental Panel on Climate Change (IPCC)
identified Europe as one of the fastest warming regions and
Assessment Report 4 (AR4) discussing changes since 1979 stated:
“Warming in this period was strongest over western North America,
northern Europe and China in winter”. AR5 states “Regardless of
whether the statistics of flow regimes themselves have changed,
observed temperatures in recent years in Europe are distinctly
warmer than would be expected for analogous atmospheric flow
regimes in the past, affecting both warm and cold extremes citing [8]
[9].
The European winter of 2006-07 was exceptionally warm and the
temperatures experienced during autumn 2006 and winter 2007 are
likely to have been the warmest in 500 years [10]. The winter
temperature rise in Europe is dominated by circulation changes that
bring mild maritime air into Europe north of the Alps and climate
modelling fails to replicate these circulation changes – specifically the
higher pressure over the SEMIEA [11] [12]. The SEMIEA high-
pressure anomaly advects warm air from the central Atlantic to
northern Europe resulting in anomalously high temperatures [11].
These papers demonstrate that the climate modelling which was
reviewed did not include the forcing agent which caused the rise in
pressure over the SEMIEA which I show to be the carbonaceous WAP.
1.4 Pressure over the Mediterranean and the Iberian Peninsula
All three changes outlined above are linked to increased sea level
pressure over the SEMIEA in the winter months. “Changes in
atmospheric circulation are important for local climate change
because they could lead to greater or smaller changes in climate in a
particular region than elsewhere. It is likely that human influence has
altered sea level pressure patterns globally.” (AR5). This paper
demonstrates this exactly, the anthropogenic WAP creates the
increase in pressure over the SEMIEA which drives the changes in the
winter climate of Europe.
Trends in sea-level pressure in Europe are shown in Figure 7 of
[11] which shows a significant increase in pressure in the SEMIEA
from 1950–2007. Comparisons of observed changes and climate model
simulations are also included and for two models the observed trend
in pressure is a factor of four larger than the modelled trend whilst
another two models show smaller trends and two no trends at all. In
the ESSENCE ensemble only tropospheric sulphate aerosols are
included in the historic data [13] and the ensemble cannot therefore
have modelled the WAP correctly as it is predominantly carbonaceous
1.5 The Anthropogenic West African Aerosol Plume
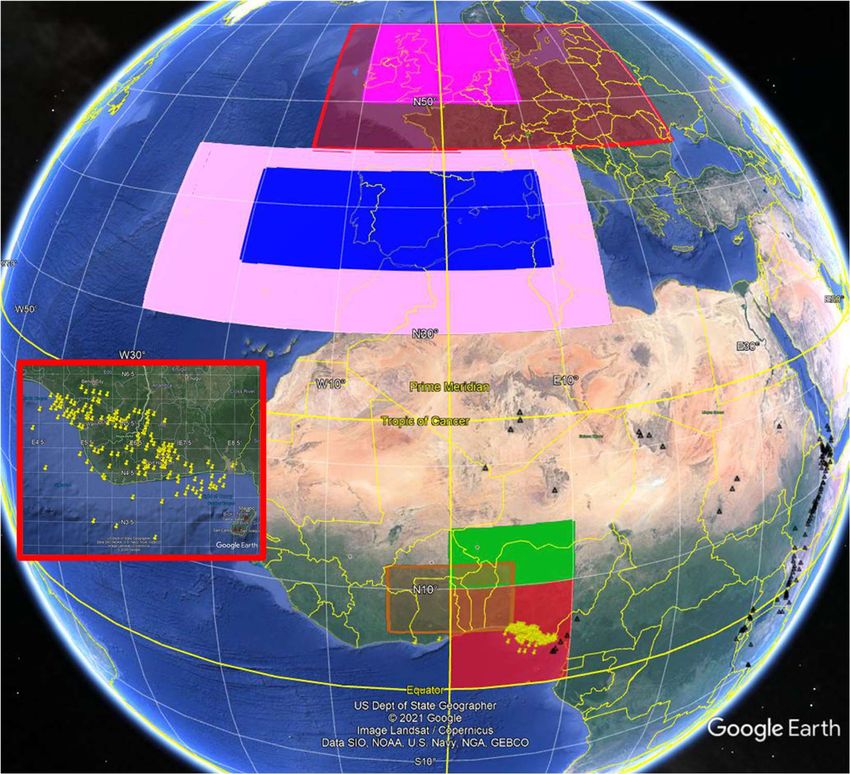
Figure 1 shows the areas used:
1. AOD (WAP Area): 0° 10°N
and 0° 10°E
2. Surface Temperature (WAP (ST)): 6° 12°N
and 5°W 5°E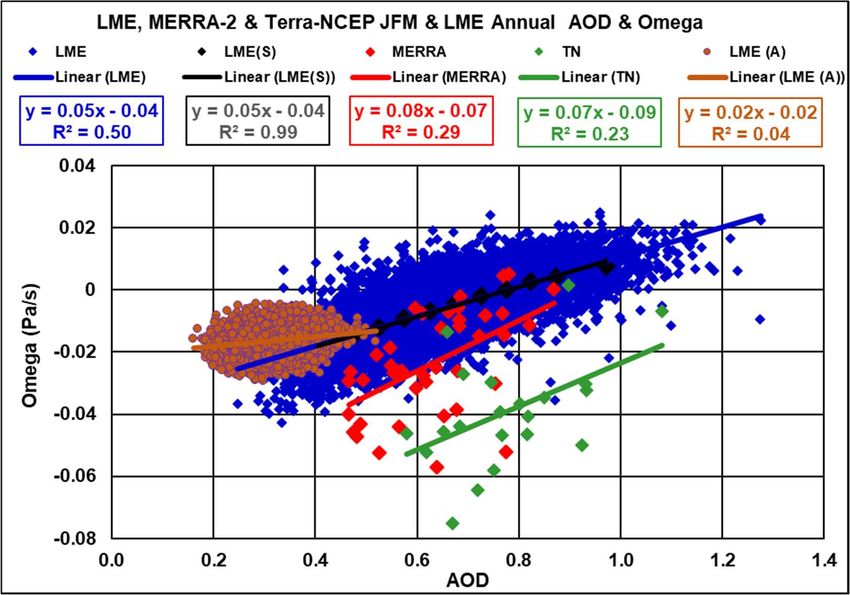
Preprints (www.preprints.org) | NOT PEER-REVIEWED | Posted: 31 August 2021                  doi:10.20944/preprints202108.0554.v1

                                              3.   Omega West Africa (W. Africa):                             10° 15°N
                                                   and 0° 10E°
                                              4.   Pressure (SEMIEA):                                30°    45°N       and
                                                   30°W 15°E
                                              5.   Rainfall Southern Europe (MIEA):                           35° 43°N
                                                   and 20°W 10°E
                                              6.   Rainfall Northern Europe (UK):                             50° 60°N
                                                   and 10°W 10°E
                                              7.   Temperature (Northern Europe):                             45° 60°N
                                                   and 15°W 30°E

                    Figure 1. Google Earth image showing: areas used; locations of Nigerian gas flares (National
                    Oceanic and Atmospheric Administration (NOAA) and the Global Gas Flaring Reduction
                    Partnership (GGFRP)) in yellow; and African volcanoes (Global Volcanism Program) in black. Inset
                    southern Nigerian gas flares.

                                                   The WAP’s location, West Africa, and season means it will
                                              perturb the European regional Hadley Circulation in winter.
                                              Appendix B describes the main aerosol sources and shows they are
                                              entirely anthropogenic.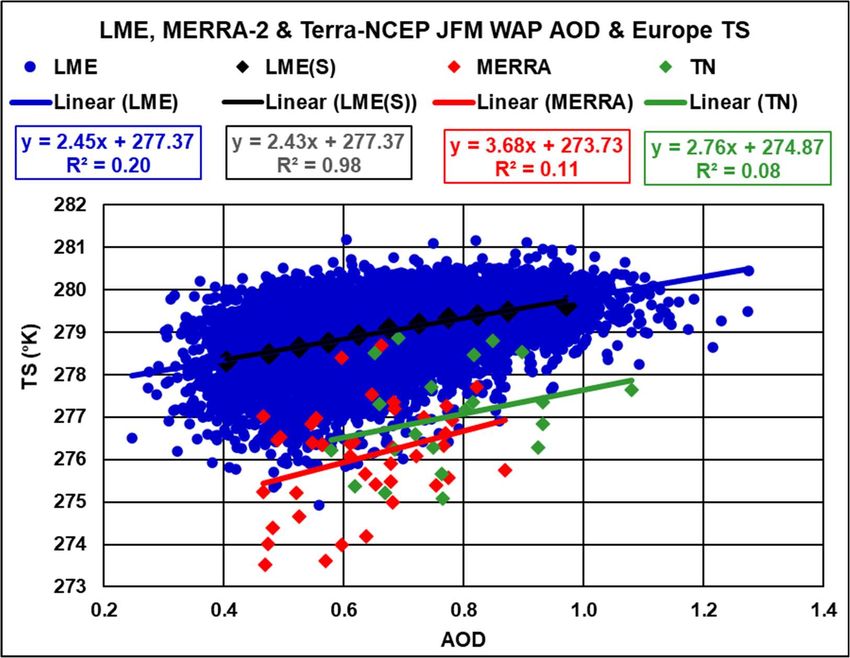
Preprints (www.preprints.org) | NOT PEER-REVIEWED | Posted: 31 August 2021 doi:10.20944/preprints202108.0554.v1
The WAP is one of eight great aerosol plumes (Appendix A)
which occur annually. It can be identified on the monthly mean 0.55
micron AOD data from MODIS [15] on the NASA Terra satellite
distributed via NASA Giovanni. The uncertainty in the AOD
measured by this satellite is “τ=±0.05 ±0.15τ over land” and the
AOD retrievals can be used in monitoring the aerosol radiative
forcing of the global climate [16] [17].
The monthly average WAP Area AOD and the annual AOD cycle
are shown in Figure 2 to demonstrate the peak aerosol emission
season is January to March (JFM), the end of the dry season. I focus on
JFM because the WAP will have its greatest effect at this time. Figure 3
shows the MERRA-2 reanalysis JFM AOD data for the WAP Area
which varies significantly.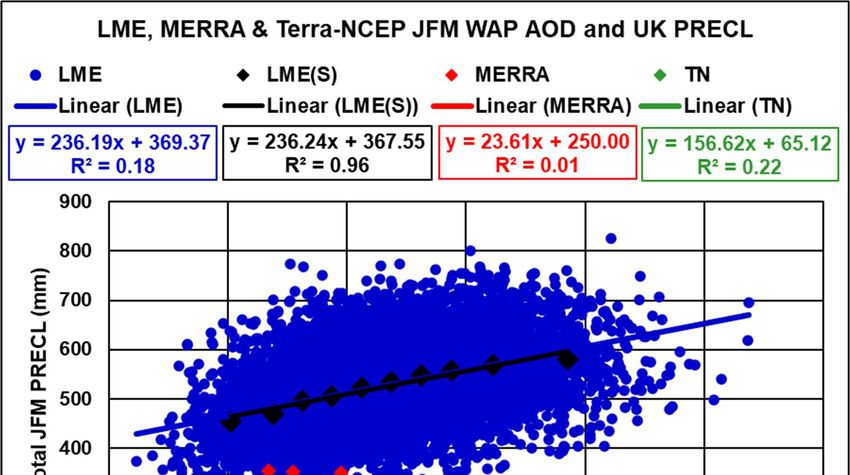
Preprints (www.preprints.org) | NOT PEER-REVIEWED | Posted: 31 August 2021               doi:10.20944/preprints202108.0554.v1

                          Figure 2. (a) Terra Monthly AOD WAP Area; (b) Average, Max and Min Annual cycle.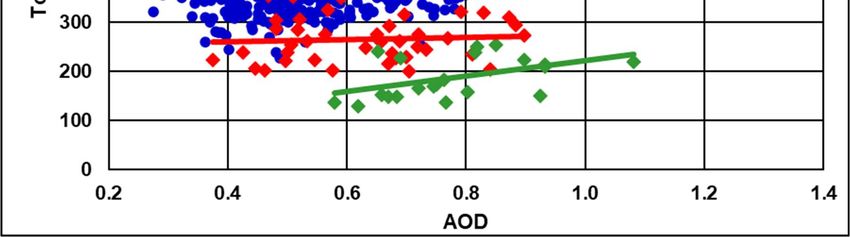
Preprints (www.preprints.org) | NOT PEER-REVIEWED | Posted: 31 August 2021           doi:10.20944/preprints202108.0554.v1

                                             Figure 3. MERRA-2 JFM AOD WAP Area.

                                                The maximum AOD for the WAP was 1.41 (Feb 2000) and the
                                           trend line of the MERRA-2 AOD in JFM in the WAP Area increased
                                           from 0.48 in 1980 to 0.77 in 2020 a 60% increase. From 1980 to 2004, a
                                           major biomass burning event year, the increase in AOD in March was
                                           from 0.37 to 1.10 a three-fold increase.
Preprints (www.preprints.org) | NOT PEER-REVIEWED | Posted: 31 August 2021 doi:10.20944/preprints202108.0554.v1
Figure 4 shows the geographic extent of the JFM 2004 extreme
apparition of the WAP and shows the plume’s origin to be in southern
Nigeria.
Figure 4. MERRA-2 JFM average AOD 2004.
The AOD retrievals from the NASA Terra and Aqua satellites
and ground-based photometers were found to correlate well, over
0.90, at Ilorin in Nigeria [18]. Figure 2 in that paper clearly shows the
seasonal variation in the AOD levels with many days showing AOD
levels over 1.00 in JFM from 2005 to 2009.
WAP History: Figure 3 shows a significant trend in the AOD of
the WAP from 1980 to 2020 and the WAP AOD would have been
significantly lower in 1950 than in 1980 as:
The population of West Africa increased from 71 million in 1950
to 188 million in 1980 (United Nations World population data for
West Africa) which implies less biomass burning from
agriculture and land clearing in 1950 and therefore a lower
aerosol burden from these sources; and
Oil production started in Nigeria in 1958 (Nigerian National
Petroleum Corporation in “History of the Nigerian Petroleum
Industry” at https://www.nnpcgroup.com/NNPC-
Business/Business-Information/Pages/Industry-History.aspx )
and there were therefore no aerosol producing gas flares in
Nigeria in 1950.
The estimated WAP AOD in 1950 (JFM) is 0.09 on the basis of pro
rata population and oil production changes and confirmed by
projecting the trend of the lower AOD levels in the MERRA-2 dataPreprints (www.preprints.org) | NOT PEER-REVIEWED | Posted: 31 August 2021 doi:10.20944/preprints202108.0554.v1
(1987, 1996) back to 1950 (0.08). This implies the effects of the extreme
WAP are very recent and that the anthropogenic WAP probably did
not exist in its present extreme state in JFM before the early 1970’s as
oil production did not reach one million barrels per day until 1970 (BP
2019).
Personal Note: I lived in southern Nigeria between 1968 and
1972 and saw no extreme levels of smoke in the atmosphere in those
years.
1.6 Surface Radiative Forcing (SF) by Aerosols
Aerosol SF is significant: 10% to 30% reduction [19]; -150 W/m2
[20]; and -286(W/ m2)/(unit AOD) [21].
Figure 5 shows the MERRA-2 surface radiation and AOD
averaged across the WAP Area longitudes with 1987, the lowest WAP
Area JFM AOD subtracted from 2004, the highest, to show the 2004
anomaly. The series correlate at -0.98 (significancePreprints (www.preprints.org) | NOT PEER-REVIEWED | Posted: 31 August 2021 doi:10.20944/preprints202108.0554.v1
north of the WAP which forces the entire circulation north and creates
the anomalous, persistent, high pressure over the SEMIEA as a direct
consequence of the WAP.
Note: The 1987 WAP JFM AOD was 0.38 which is significantly
higher than the 1950 estimate (0.09) and the SF of the WAP in 2004 cf.
1950 would be even greater.
Appendix C discusses aerosols and climate.
METHOD
Appendix D shows the data sources.
Data was detrended using PAST3 [22].
1.7 Last Millennium Ensemble
LME [23] data analysed is: atmosphere, post processed monthly
averages consisting of seven simulations (Table 1 [23]) plus “850”
which were repeated in multiple runs. Aerosol Optical Depth (AOD)
(AODVIS), surface pressure (PSL), surface temperature (TS),
precipitation (PRECL) and vertical pressure velocity (omega) data
from these simulations(run) was used: 850(003); Green House
Gas(003); Orbital(003) Land Use(003); Solar(005); Volcanic(005); Ozone
& Aerosols(002); All(013). Each simulation(run) was processed
separately to give: JFM average data for each parameter for the
required areas as a 1,156 element time series; and annual AOD and
omega data.
1.8 MERRA-2 Data
MERRA-2 data is an independent dataset used to:
1. Confirm the LME analysis;
2. Show the geographical extent of the WAP effects in Appendix E.
1.9 Terra and NCEP/NCAR Reanalysis
Terra and NCEP/NCAR [24] data provide another independent
confirmation of the WAP effects. Terra data derives from the MODIS
sensor and the NCEP/NCAR data is used in the analysis of the
anomalous high pressure over SEMIEA [11].
RESULTS
Results are presented as scatter plots showing:
1. Eight LME simulations/runs combined, a total of 8,248 data points;
2. LME(S) all LME data segmented in bins from AOD less than 0.45
in steps of 0.05 to over 0.90;
3. MERRA-2 (1980-2020);
4. Terra-NCEP/NCAR (TN) (2000-2020);
with the trend line, trend line equation and R2 for each dataset
and Table 1 showing:
1. The JFM time series correlations from the graphs;
2. Trend per unit AOD increase in the WAP from the graphs;
3. Change over the AOD range in that dataset;
4. Change from 1950 AOD to the maximum AOD level;
5. Percentage rainfall changes from 1950 AOD to the dataset
maximum.Preprints (www.preprints.org) | NOT PEER-REVIEWED | Posted: 31 August 2021 doi:10.20944/preprints202108.0554.v1
Table 1. Correlations, trend and changes from: minimum to maximum JFM AOD; and from the
estimated 1950 JFM AOD to maximum JFM AOD for the parameters shown in the LME, MERRA-2
and Terra-NCEP/NCAR datasets. Significance isPreprints (www.preprints.org) | NOT PEER-REVIEWED | Posted: 31 August 2021 doi:10.20944/preprints202108.0554.v1
The AOD range in the datasets is Terra 0.6 to 1.1, MERRA-2 0.4 to
0.9 and the LME 0.3 to 1.1. The LME and MERRA-2 AOD ranges
are similar whilst the Terra dataset shows a higher low value
than the others as the WAP was well established for the entire
dataset and was not for the LME and MERRA-2 data (Figures 2
and 3).
Appendix E shows comparison JFM images for each parameter
analysed created by subtracting the 1987 data (low WAP AOD) from
2004 (high WAP AOD) using NASA Panoply and the NCEP/NCAR
website.
1.10 The WAP Forms
The intense WAP forms in late December and disperses in April
(Figure 2). Figure A8 shows an increase in JFM AOD of over 0.6 across
half the WAP Area.
1.11 The WAP absorbs Solar Radiation and Heats the Atmosphere
Figure A9 shows the MERRA-2 air temperature comparison
averaged across the WAP Area longitudes from 20°S to 40°N. In 2004
the air temperature within the plume at 700hPa to 850hPa is ~1º K
higher which matches the estimated aerosol height from CALIPSO
data [25] on 1 January 2016 (high WAP AOD) showing elevated
aerosol levels at altitudes from 1.0 to 5.0 km.
1.12 The WAP Reduces the WAP Land Area Surface Temperature
The LME data in Table 1 (A)(1-2) shows a statistically significant
connection between the WAP AOD and surface temperature. Whilst
not showing statistical significance the MERRA-2 and Terra-
NCEP/NCAR trend data in Table 1 and Figure 6 also show reducing
surface temperature with increasing AOD. Figure A10 shows a
reduction of over 2º K.Preprints (www.preprints.org) | NOT PEER-REVIEWED | Posted: 31 August 2021 doi:10.20944/preprints202108.0554.v1
LME, MERRA-2 & Terra-NCEP JFM AOD and TS West Africa
LME LME (S) Merra TN
Linear (LME) Linear (LME (S)) Linear (Merra) Linear (TN)
y = -3.06x + 300.11 y = -3.10x + 300.14 y = -1.63x + 302.55 y = -0.45x + 302.48
R² = 0.43 R² = 0.99 R² = 0.05 R² = 0.02
304
303
Temperature (ºK)
302
301
300
299
298
297
296
295
0.2 0.4 0.6 0.8 1.0 1.2 1.4
AOD
Figure 6. LME, MERRA-2 and Terra-NCEP/NCAR JFM Surface Temperature West Africa and WAP
Area AOD.
1.13 The WAP Reduces Convection in West Africa
The LME, MERRA-2 and Terra-NCEP/NCAR data in Table 1
(B)(1-2) all show a statistically significant connection between the
WAP AOD and omega at 820 hPa in West Africa. All datasets at (B)(3-
5) and Figure 7 show positive increases in omega (reductions in
convection) as the WAP AOD increases and:
1. Both the MERRA-2 and Terra-NCEP/NCAR data show higher trends per unit AOD than the
LME;
2. The trend line in the LME data in Figure 7 shows that, on
average, when the WAP AOD rises over 0.8 omega becomes
positive implying that convection reverses at this level in the
model; and
3. Figure A11 shows a 0.03 Pa/s increase in omega
Note: rising air creates negative omega as it moves from higher
to lower pressure. Reducing convection creates a positive change in
omega and as aerosols reduce convection the correlations of omega
and AOD are positive.Preprints (www.preprints.org) | NOT PEER-REVIEWED | Posted: 31 August 2021 doi:10.20944/preprints202108.0554.v1
Figure 7. LME, MERRA-2 and Terra-NCEP/NCAR JFM Omega and WAP Area AOD and LME
Annual Data.
Figure 7 includes LME annual data which demonstrates how
averaging the effects of aerosol plumes annually when the “extreme”
plume only exists for a few months completely destroys the
significant seasonal effects of the plume. The annually averaged data
shows: R2 values an order of magnitude less than the JFM values;
omega only rising from -0.017 to -0.015; and no reversal of convection
seen in the JFM data as it is masked by the averaging. This
conclusively demonstrates that aerosols must be analysed at spatial
and temporal resolutions which can correctly model the plume. The
effects of carbonaceous aerosols on surface radiation, convection and
atmospheric circulation have been extensively described in the
literature (Appendix C). The WAP absorbs solar radiation: warming
the upper atmosphere; and cooling the surface and lower atmosphere.
This alters the vertical temperature profile of the atmosphere with
warmer air above cooler (relative to the temperatures without the
plume) stabilising the atmosphere and reducing convection. This well
understood process is confirmed in the WAP Area with the
correlation of omega and AOD in Table 1(B)(1-2) and Figure 7.
1.14 The WAP Perturbs the Hadley Circulation:
The Hadley Cells are thermally driven [26] [27] [28] and reduced
surface solar radiation therefore reduces convection in the WAP Area
which perturbs the regional Hadley Cell and this can be clearly seen
in Figure A11 where the rising limb of the northern Hadley Cell has
been altered in 2004 cf. 1987 and the region showing the greatestPreprints (www.preprints.org) | NOT PEER-REVIEWED | Posted: 31 August 2021 doi:10.20944/preprints202108.0554.v1
increase in convection is between 25° and 35° north which is north of
the WAP (Figure 4).
1.15 The Crucial Step – The WAP Increases Surface Pressure in the SEMIEA
The LME, MERRA-2 and Terra-NCEP/NCAR data in Table 1
(C)(1-2) all show a statistically significant connection between the
WAP AOD and PSL in the SEMIEA. All datasets at (C)(3-5) and
Figure 8 show increases in PSL as the WAP AOD level increases and
note that: The Terra-NCEP/NCAR data shows a higher trend than the
LME in Figure 8; and Figure A12 shows a 3 to 5 hPa increase in PSL
2004-1987 which is similar to the trend in [11].
Figure 8. LME, MERRA-2 and Terra-NCEP/NCAR JFM Surface Pressure and WAP Area AOD.
The estimated LME and Terra-NCEP/NCAR change from 1950 to
the post 2000 average high AOD in Table 1 (C )(5) is greater than the
changes shown in Figure 7 of [11] from 1950 to 2007 which the
modelling cited in the paper does not replicate.
Figure A11 shows that a major increase in omega occurs between
35ºN and 45ºN which leads to higher SEMIEA pressure.
This is the crucial step in the changes induced by the WAP and is
the only change remote from West Africa directly forced by the WAPPreprints (www.preprints.org) | NOT PEER-REVIEWED | Posted: 31 August 2021 doi:10.20944/preprints202108.0554.v1
by the perturbation of the Hadley Circulation with all other changes,
UK flooding, Iberian drought and higher European winter
temperatures being secondary effects which are driven by this
anomalous and persistent region of increased pressure.
1.16 The WAP Reduces Precipitation in the MIEA
The LME, MERRA-2 and Terra-NCEP/NCAR data in Table 1
(D)(1-2) all show a statistically significant connection between the
WAP AOD and PRECL in the MIEA. All datasets at (D)(3-6) and
Figure 9 show reductions in PRECL as the WAP AOD level increases
and note that: The Terra-NCEP/NCAR data shows a larger negative
trend per unit AOD change than the LME and the average percentage
reduction in rainfall across the four datasets in Table 1(D)(6) is 75%
which is similar to the reported reduction of 60% [6]. Figure A13
shows up to 60mm reduction in MIEA JFM PRECL.
Figure 9. LME, MERRA-2 and Terra-NCEP/NCAR JFM MIEA Precipitation and WAP Area AOD.
1.17 The WAP Advects Warm, Moist Air into Northern Europe
With high pressure established over the SEMIEA (Figure A12)
the natural wind flows are perturbed. Figure A14 shows a strong flow
from the Atlantic Ocean east of the USA travelling north east into thePreprints (www.preprints.org) | NOT PEER-REVIEWED | Posted: 31 August 2021 doi:10.20944/preprints202108.0554.v1
UK and northern Europe which constitutes an atmospheric river
carrying significant moisture from the warm ocean to the UK [5] [29]
and for an early overview [30] [31].
1.18 The WAP Increases Precipitation in the UK
The LME and Terra-NCEP/NCAR data in Table 1 (E)(1-2) show
statistically significant connections between the WAP AOD and
PRECL in the UK. All datasets at (E)(3-6) and Figure 10 show
increasing UK PRECL as the WAP AOD level increases and note that
the Terra-NCEP/NCAR data shows the largest percentage increase at
(E)(6) being more than double the LME increase. Figure A13 shows an
increase of up to 60 mm in JFM PRECL.
Figure 10. LME, MERRA-2 and Terra-NCEP/NCAR JFM UK Precipitation and WAP Area AOD.
The average increase of 165 mm in Table 1 (E)(5) from 1950 to the
high AOD is of similar, but higher, magnitude to the change in the
JFM rainfall in Dunstaffnage in western Scotland recorded by the UK
Met Office at
https://www.metoffice.gov.uk/pub/data/weather/uk/climate/stationdaPreprints (www.preprints.org) | NOT PEER-REVIEWED | Posted: 31 August 2021 doi:10.20944/preprints202108.0554.v1
ta/dunstaffnagedata.txt from 411mm (pre 1991) to 515 mm (post 1990)
at + 104mm.
Also note that atmospheric rivers from the subtropical Atlantic to
the UK only occur because low pressure systems moving eastwards
across the Atlantic meet the persistent and static SEMIEA high
pressure which causes the isobars to close up and sometimes,
depending on the latitude of the low-pressure system, create the
narrow SW to NE atmospheric river.
1.19 The WAP Increases the Temperature in Northern Europe
The LME and MERRA-2 data in Table 1 (F)(1-2) show statistically
significant connections between the WAP AOD and TS in Europe. All
datasets at (F)(3-5) and Figure 11 show increasing TS as the WAP
AOD level increases and note that in Table 1 (F)(3) the MERRA-2 and
Terra-NCEP/NCAR data shows a larger increase than the LME per
unit WAP AOD. Figure A15 shows an increase of over 4º K across
much of Europe north of the Alps.
Figure 11. LME, MERRA-2 and Terra-NCEP/NCAR JFM Northern European Temperature and
WAP Area AOD.
DISCUSSION
Correlation between events A and B does not prove causation
from A to B or vice versa. The causal relationship between the WAP
and the European climate is demonstrated here.
1.20 Multiple DatasetsPreprints (www.preprints.org) | NOT PEER-REVIEWED | Posted: 31 August 2021 doi:10.20944/preprints202108.0554.v1
Three independent datasets: the LME, with 1,156 years of data
and eight different forcing scenarios; the MERRA-2 reanalysis with 41
years of data including assimilated aerosol measurements; and Terra-
NCEP/NCAR with 21 years of measured aerosol data all show the
same trends in the parameters analysed and 20 out of 24 analyses
show statistically significant connections.
1.21 Analysis without Correlation
The results reflect actual measurements.
1.21.1 Pressure over the SEMIEA
When the LME PSL data from all simulations/runs in years when
WAP AOD is below 0.45 and above 0.90 is averaged the PSL change
from low AOD to high is 7.2 hPa which mirrors the reported trend
[11] whereas the modelling in that paper does not. The Terra-
NCEP/NCAR data shows an even higher positive trend in PSL than
the LME whilst MERRA-2 shows a lower but still significant positive
trend.
1.21.2 Precipitation in Iberia
When the LME PRECL data from all simulations/runs in years
when WAP AOD is below 0.45 and above 0.90 is averaged the
reduction from low AOD to high is 103mm (59%) which nearly
exactly matches the 60% measured Iberian rainfall reduction [6]. The
average of all four datasets in Table 1(D)(6) shows a similar reduction
from the WAP AOD in 1950 to the high at 75%.
1.21.3 Precipitation in The U.K.
When the LME PRECL data from all simulations/runs in years
when WAP AOD is below 0.45 and above 0.90 is averaged the change
from low AOD to high is 127mm or 28% which is the same order of
magnitude as the change in the recorded UK (ex Northern Ireland)
rainfall (UK Met Office at
https://www.metoffice.gov.uk/research/climate/maps-and-data/uk-
and-regional-series) from the average from 1862 to 1988 to the average
from 1989 to 2020 at 17%.
1.21.4 Warmer Temperatures in Europe.
Using the trend in the “all simulation” LME TS data, 2.45º K per
unit AOD increase, the TS change from the estimated low AOD of
0.09 in 1950 to the measured high in the Terra FM AOD data in Figure
2, 1.2 (2000), is 2.72º K which mirrors the reported trend [11] and the
CRUTEM.4.6.0.0 land temperature data [32] trend of +2.90º K
from 1950 to 2007.
1.21.5 Modelling
LME: there is no physical mechanism by which drought or SLP
in SEMIEA can create aerosols in the LME over West Africa hence the
causal direction must run from the aerosols to the PSL, PRECL and TS
and the aerosol forcings in all LME runs are fixed at 1850 values
except for the “ozone and aerosol” and “all” runs and there can
therefore be no forcing of the aerosols by any agent within these six
runs and the causal direction must flow from the aerosols.Preprints (www.preprints.org) | NOT PEER-REVIEWED | Posted: 31 August 2021 doi:10.20944/preprints202108.0554.v1
MERRA-2: assimilates measured aerosol data and therefore the
causal direction must be from the aerosols to the rainfall and SLP as it
cannot be the reverse.
Terra-NCEP/NCAR: this dataset includes measured aerosol data
and, as stated in Appendix B, the source of the WAP aerosols is
undoubtably fires and gas flares in West Africa.
1.21.6 Multiple Independent Datasets in the LME
The eight LME modelling runs exhibit very low or negative
correlations between the WAP AOD in the individual runs as shown
in the correlation matrix in Appendix F with an overall average
0.0016. Hence the datasets are independent.
All eight LME datasets show correlations at magnitude -0.62 and
0.74 or greater with the Iberian rainfall and SEMIEA SLP respectively
at significance ofPreprints (www.preprints.org) | NOT PEER-REVIEWED | Posted: 31 August 2021 doi:10.20944/preprints202108.0554.v1
1.22 CAUSAL DIRECTION
Therefore with:
1. All the datasets showing as the WAP Area AOD rises:
a. Increasing SEMEIEA pressure;
b. Increasing UK rainfall;
c. Reducing Iberian rainfall;
d. Increasing northern European temperatures.
2. The LME analysis showing the same results across multiple
independent datasets with a vanishingly small chance of error;
the inevitable conclusion is that the WAP is the primary driver in
JFM of increased pressure over the SEMIEA, and a significant driver
of increased rainfall in the UK, increased temperatures in northern
Europe and reduced rainfall in Iberia.
1.23 FUTURE RESEARCH
1.23.1 Confirming the conclusions
An LME style analysis should be undertaken in which a WAP
ramps up from the November 1950 AOD level to reach the same
January AOD as the extreme 2004 JFM WAP, continues at the same
level to March and ramps down in April to the May 1950 level. This
plume to be applied with random returns from 3 to 10 years with all
other forcing agents held constant.
This modelling should be repeated with AOD levels reduced by
10% between runs to determine the level of AOD in the WAP Area
which is required to perturb the European climate.
This will provide the information governments require to reduce
the WAP AOD to levels which will not impact the winter climate of
Europe.
1.24 Mitigating the WAP
1.24.1 Seasonal Biomass Burning
Biomass burning is the most significant source of JFM aerosols
and occurs for the reasons outlined in Appendix B.
New technologies could reduce biomass burning by converting
the biomass into useful products such as liquid fuel [33] [34] and may
quickly reduce the WAP AOD levels as the technology would create a
new income stream for those selling into a new industry and West
African governments could then ban biomass burning in the open.
1.24.2 Gas Flares
The WAP also comprises carbonaceous aerosols from oil industry
flaring of associated gas (Appendix B). The World Bank Global Gas
Flaring Reduction Partnership (GGFRP) has been working to reduce
routine flaring and reports Nigeria reduced flaring from 8.4 to 7.4
billion cubic metres between 2014 and 2018
(https://www.worldbank.org/en/programs/gasflaringreduction#7 )
However, Nigeria was the 7th largest flaring country in the World
in 2018 (GGFRP) and the industry should be required to immediately
eliminate the routine flaring of gas which creates aerosols.
1.24.3 Background AOD LevelsPreprints (www.preprints.org) | NOT PEER-REVIEWED | Posted: 31 August 2021 doi:10.20944/preprints202108.0554.v1
Background AOD levels is the average April to November level
when the monsoon prevents biomass burning.
The representative concentration pathway data from the
International Institute for Applied Systems Analysis (IIASA) at
https://www.iiasa.ac.at/web/home/research/researchPrograms/Transit
ionstoNewTechnologies/RCP.en.html shows no change in
carbonaceous aerosols from the Middle East and Africa before 1950
and then a sixfold increase by 2000 with the majority of the increase
occurring by 1970. Hence as West Africa is one of the regions where
there has been a significant increase it is obvious that the WAP Area
background AOD level in 1950 must have been significantly lower
than the 0.41 level shown in Figure 2. It is therefore possible that this
increased background level since 1950 may have also affected the
European climate in other seasons and this requires further research.
1.24.4 Other Aerosol Plumes
Eight continental scale aerosol plumes now exist in the World
each year, each in its own season [14]. Research on the apparitions of
these plumes must focus on their seasonal effects on inter alia: the
climate of Europe in summer and autumn; Australian and Sahelian
drought; Arctic Ice levels; and ENSO.
CONCLUSIONS
The LME (1.156 years of data), MERRA-2 (41 years) and Terra-
NCEP/NCAR (21 years) confirm the direct connection between the
WAP and the European winter climate in multiple independent ways
and analysis clearly shows that the relationship must be causal.
I therefore conclude:
1. The WAP is the prime trigger for and sustaining influence on changes in the winter climate of
Europe driving increased pressure over SEMIEA which then creates increased UK rainfall,
Iberian drought and increased northern European temperatures.
2. The climate modelling cited in the introduction failed to replicate
the significant observed surface pressure rise over the
Mediterranean as the models did not accurately incorporate the
carbonaceous, anthropogenic aerosols of the WAP.
3. The WAP and the other seven continental scale aerosol plumes
which now exist each year must be incorporated in climate
analysis at spatial and temporal resolutions that do not lose the
effects of the plumes due to averaging. A spatial resolution of
less than 2° of latitude and longitude and a temporal resolution
of less than 1 month should suffice.
4. As the WAP changes the climate of Europe it is obviously
possible that the other seven continental scale aerosol plumes
may have effects which are even more remote from the plume
than the WAP is from Europe and this requires investigation.
Finally I concur with [35] that emissions of carbonaceous aerosols
are directly addressable by government policy and suggest that this is
an urgent necessity to restore the winter climate of Europe to its pre-
WAP, natural state circa 1950.Preprints (www.preprints.org) | NOT PEER-REVIEWED | Posted: 31 August 2021 doi:10.20944/preprints202108.0554.v1
SUPPLEMENTARY INFORMATION
Appendix A The eight continental scale aerosol plumes
Appendix B Sources of The West African Aerosol Plume
Appendix C Aerosols and Climate
Appendix D Data Sources
Appendix E Comparison of the Effects of the 2004 and 1987
WAP
Appendix F Correlation Matrix for LME and MERRA-2 AOD
FUNDING
This research project was funded entirely by the author and his
wife, Julie and received no external funding.
DATA AVAILABILITY
Data sources which are all publicly available are listed in
Appendix D.0Preprints (www.preprints.org) | NOT PEER-REVIEWED | Posted: 31 August 2021 doi:10.20944/preprints202108.0554.v1
CONFLICTS OF INTEREST
The author declares no conflict of interest.
ACKNOWLEDGEMENTS
I acknowledge:
NASA: Analyses and visualizations used in this paper were
produced with the Giovanni online data system, developed and
maintained by the NASA GES DISC; the mission scientists and
Principal Investigators who provided the data and images used in this
paper including the MERRA-2 data; and Dr Robert Schmunk for the
Panoply data viewer;
NASA for the fire data at https://earthdata.nasa.gov/earth-
observation-data/near-real-time/firms/active-fire-data ;
NASA for the CALIPSO data obtained from the NASA Langley
Research Center Atmospheric Science Data Center at
https://eosweb.larc.nasa.gov/project/calipso/calipso_table .
The NOAA/ESRL Physical Sciences Division, Boulder Colorado
for the data and images from their Web site at
http://www.esrl.noaa.gov/psd/ .
The CESM1(CAM5) Last Millennium Ensemble Community
Project and supercomputing resources provided by
NSF/CISL/Yellowstone;
The UK Met Office at
https://www.metoffice.gov.uk/weather/learn-about/past-uk-weather-
events for the UK flood information, rainfall and temperature data;
The IPCC for the images and Assessment Reports;
Google EarthTM and the copyright holders noted on the image for
the image of the Earth;
The United Nations Department of Economic and Social Affairs
Population Division for the world population statistics at
https://www.un.org/en/development/desa/population/publications/da
tabase/index.asp;
BP for the oil production statistics at
https://www.bp.com/en/global/corporate/energy-
economics/statistical-review-of-world-energy.html
The Global Gas Flaring Reduction Partnership (World Bank and
NOAA) for the gas flare data and image at
https://www.worldbank.org/en/programs/gasflaringreduction ;
The Global Volcanism Program at the Smithsonian Institution for
the volcano eruption data. http://dx.doi.org/10.5479/si.GVP.VOTW4-
2013 ;
Global Forest Watch for the forest data
https://www.globalforestwatch.org/Preprints (www.preprints.org) | NOT PEER-REVIEWED | Posted: 31 August 2021 doi:10.20944/preprints202108.0554.v1
References
1. Chiverrell, R.C.; Sear, D.A.; Warburton, J.; Macdonald, N.; Schillereff, D.N.; Dearing, J.A.;
Croudace, I.W.; Brown, J.; Bradley, J. Using lake sediment archives to improve
understanding of flood magnitude and frequency: Recent extreme flooding in northwest
UK. Earth Surface Processes and Landforms 2019, 44, 2366-2376, doi:10.1002/esp.4650.
2. Gelaro, R.; McCarty, W.; Suárez, M.J.; Todling, R.; Molod, A.; Takacs, L.; Randles, C.A.;
Darmenov, A.; Bosilovich, M.G.; Reichle, R.; et al. The Modern-Era Retrospective Analysis
for Research and Applications, Version 2 (MERRA-2). Journal of Climate 2017, 30, 5419-5454,
doi:10.1175/jcli-d-16-0758.1.
3. Huntingford, C.; Marsh, T.; Scaife, A.A.; Kendon, E.J.; Hannaford, J.; Kay, A.L.; Lockwood,
M.; Prudhomme, C.; Reynard, N.S.; Parry, S.; et al. Potential influences on the United
Kingdom's floods of winter 2013/14. Nature Clim. Change 2014, 4, 769-777,
doi:10.1038/nclimate2314.
4. Schaller, N.; Kay, A.L.; Lamb, R.; Massey, N.R.; van Oldenborgh, G.J.; Otto, F.E.L.; Sparrow,
S.N.; Vautard, R.; Yiou, P.; Ashpole, I.; et al. Human influence on climate in the 2014
southern England winter floods and their impacts. Nature Clim. Change 2016, 6, 627-634,
doi:10.1038/nclimate2927
http://www.nature.com/nclimate/journal/v6/n6/abs/nclimate2927.html#supplementary-information.
5. Lavers, D.A.; Allan, R.P.; Wood, E.F.; Villarini, G.; Brayshaw, D.J.; Wade, A.J. Winter floods
in Britain are connected to atmospheric rivers. Geophysical Research Letters 2011, 38,
doi:10.1029/2011gl049783.
6. García-Herrera, R.; Paredes, D.; Trigo, R.M.; Trigo, I.F.; Hernández, E.; Barriopedro, D.;
Mendes, M.A. The Outstanding 2004/05 Drought in the Iberian Peninsula: Associated
Atmospheric Circulation. Journal of Hydrometeorology 2007, 8, 483-498, doi:10.1175/jhm578.1.
7. Vicente-Serrano, S.M.; López-Moreno, J.I. The influence of atmospheric circulation at
different spatial scales on winter drought variability through a semi-arid climatic gradient
in Northeast Spain. International Journal of Climatology 2006, 26, 1427-1453,
doi:10.1002/joc.1387.
8. Yiou, P.; Vautard, R.; Naveau, P.; Cassou, C. Inconsistency between atmospheric dynamics
and temperatures during the exceptional 2006/2007 fall/winter and recent warming in
Europe. Geophysical Research Letters 2007, 34, doi:10.1029/2007gl031981.
9. Cattiaux, J.; Vautard, R.; Cassou, C.; Yiou, P.; Masson-Delmotte, V.; Codron, F. Winter 2010
in Europe: A cold extreme in a warming climate. Geophysical Research Letters 2010, 37,
doi:10.1029/2010gl044613.
10. Luterbacher, J.; Liniger, M.A.; Menzel, A.; Estrella, N.; Della-Marta, P.M.; Pfister, C.;
Rutishauser, T.; Xoplaki, E. Exceptional European warmth of autumn 2006 and winter 2007:
Historical context, the underlying dynamics, and its phenological impacts. Geophysical
Research Letters 2007, 34, doi:10.1029/2007gl029951.
11. van Oldenborgh, G.J.; Drijfhout, S.; van Ulden, A.; Haarsma1, R.; Sterl, A.; Severijns, C.;
Hazeleger, W.; Dijkstra, H. Western Europe is warming much faster than expected. Climate
of the Past 2009, 5, 1 - 12.
12. Osborn, T.J. Simulating the winter North Atlantic Oscillation: the roles of internal
variability and greenhouse gas forcing. Climate Dynamics 2004, 22, doi:10.1007/s00382-004-
0405-1.
13. Sterl, A.; Severijns, C.; Dijkstra, H.; Hazeleger, W.; Jan van Oldenborgh, G.; van den Broeke,
M.; Burgers, G.; van den Hurk, B.; Jan van Leeuwen, P.; van Velthoven, P. When can wePreprints (www.preprints.org) | NOT PEER-REVIEWED | Posted: 31 August 2021 doi:10.20944/preprints202108.0554.v1
expect extremely high surface temperatures? Geophysical Research Letters 2008, 35,
doi:10.1029/2008gl034071.
14. Potts, K.A. Poster: How the Natural & Anthropogenic Aerosol Plume over S. E. Asia caused
the Millennium Drought. In Proceedings of the AMOS-ICSHMO 2018, Sydney, Australia,
2018.
15. Kaufman, Y.J.; Holben, B.N.; Tanré, D.; Slutsker, I.; Smirnov, A.; Eck, T.F. Will aerosol
measurements from Terra and Aqua Polar Orbiting satellites represent the daily aerosol
abundance and properties? Geophysical Research Letters 2000, 27, 3861-3864,
doi:10.1029/2000GL011968.
16. Remer, L.A.; Kaufman, Y.J.; Tanré, D.; Mattoo, S.; Chu, D.A.; Martins, J.V.; Li, R.R.; Ichoku,
C.; Levy, R.C.; Kleidman, R.G.; et al. The MODIS Aerosol Algorithm, Products, and
Validation. Journal of the Atmospheric Sciences 2005, 62, 947-973, doi:10.1175/JAS3385.1.
17. Remer, L.; RC, L.; S, M.; D, T.; P, G.; Y, S.; V, S.; LA, M.; Y, Z.; M, K.; et al. The Dark Target
Algorithm for Observing the Global Aerosol System: Past, Present, and Future. Remote
Sensing of Environment 2020, 12, doi:10.3390/rs12182900.
18. Oluleye, A.; Ogunjobi, K.O.; Bernard, A.; Ajayi, V.O.; A.A., A. Multiyear Analysis of
Ground-Based Sunphotometer (AERONET) Aerosol Optical Properties and its Comparison
with Satellite Observations over West Africa. Global Journal of HUMAN SOCIAL SCIENCE
Geography & Environmental GeoSciences 2012, 12.
19. Ramanathan, V. ATMOSPHERIC BROWN CLOUDS: HEALTH, CLIMATE AND
AGRICULTURE IMPACTS. Scripta Varia 2006, 106.
20. Duncan, B.N.; Bey, I.; Chin, M.; Mickley, L.J.; Fairlie, T.D.; Martin, R.V.; Matsueda, H.
Indonesian wildfires of 1997: Impact on tropospheric chemistry. Journal of Geophysical
Research: Atmospheres 2003, 108, 4458, doi:10.1029/2002JD003195.
21. Hansell, R.A.; Tsay, S.C.; Ji, Q.; Liou, K.N.; Ou, S.C. Surface aerosol radiative forcing
derived from collocated ground-based radiometric observations during PRIDE, SAFARI,
and ACE-Asia. Appl Opt 2003, 42, 5533-5544.
22. Hammer, Ø.; Harper, D.A.T.; Ryan, P.D. PAST: Paleontological statistics software package
for education and data analysis. . Palaeontologia Electronica 4(1): 9pp 2001, 9pp.
23. Otto-Bliesner, B.L.; Brady, E.C.; Fasullo, J.; Jahn, A.; Landrum, L.; Stevenson, S.;
Rosenbloom, N.; Mai, A.; Strand, G. Climate Variability and Change since 850 CE: An
Ensemble Approach with the Community Earth System Model. Bulletin of the American
Meteorological Society 2016, 97, 735-754, doi:10.1175/bams-d-14-00233.1.
24. Kalnay, E.; Kanamitsu, M.; Kistler, R.; Collins, W.; Deaven, D.; Gandin, L.; Iredell, M.; Saha,
S.; White, G.; Woollen, J.; et al. The NCEP/NCAR 40-Year Reanalysis Project. Bulletin of the
American Meteorological Society 1996, 77, 437-471, doi:10.1175/1520-
0477(1996)0772.0.CO;2.
25. Winker, D.M.; Vaughan, M.A.; Omar, A.; Hu, Y.; Powell, K.A.; Liu, Z.; Hunt, W.H.; Young,
S.A. Overview of the CALIPSO Mission and CALIOP Data Processing Algorithms. Journal
of Atmospheric and Oceanic Technology 2009, 26, 2310-2323, doi:10.1175/2009jtecha1281.1.
26. McGregor, G.R.; Nieuwolf, S. Tropical Climatology; John Wiley and Sons: 1977; p. 207.
27. Barry, R.G.; Chorley, R.J. Atmosphere Weather and Climate Routledge, Abingdon UK: 2010.
28. IPCC. IPCC Assessment Report 4 Glossary. 2007.
29. Ralph, F.M.; Dettinger, M.D. Storms, floods, and the science of atmospheric rivers. Eos,
Transactions American Geophysical Union 2011, 92, 265-266, doi:10.1029/2011eo320001.
30. Lavers, D.A.; Villarini, G. The nexus between atmospheric rivers and extreme precipitation
across Europe. Geophysical Research Letters 2013, 40, 3259-3264, doi:10.1002/grl.50636.Preprints (www.preprints.org) | NOT PEER-REVIEWED | Posted: 31 August 2021 doi:10.20944/preprints202108.0554.v1
31. Young, A.M.; Skelly, K.T.; Cordeira, J.M. High-impact hydrologic events and atmospheric
rivers in California: An investigation using the NCEI Storm Events Database. Geophysical
Research Letters 2017, 44, 3393-3401, doi:10.1002/2017GL073077.
32. Jones, P.D.; Lister, D.H.; Osborn, T.J.; Harpham, C.; Salmon, M.; Morice, C.P. Hemispheric
and large-scale land-surface air temperature variations: An extensive revision and an
update to 2010. Journal of Geophysical Research: Atmospheres 2012, 117,
doi:10.1029/2011jd017139.
33. Seifkar, N.; Lu, X.; Withers, M.; Malina, R.; Field, R.; Barrett, S.; Herzog, H. Biomass to Liquid
Fuels Pathways; 2015.
34. Graham, P.W.; Brinsmead, T.S.; Reedman2, L.J. An assessment of competition for biomass
resources within the energy and transport sectors; CSIRO: 2011.
35. Booth, B.B.; Dunstone, N.J.; Halloran, P.R.; Andrews, T.; Bellouin, N. Aerosols implicated as
a prime driver of twentieth-century North Atlantic climate variability. Nature 2012, 484,
228-232, doi:10.1038/nature10946.You can also read