Birth through Eight Strategy for Tulsa (BEST) Phase II Evaluation
←
→
Page content transcription
If your browser does not render page correctly, please read the page content below
Birth through Eight Strategy for
Tulsa (BEST) Phase II Evaluation
2020 Workforce Survey
MARCH 2021
Gabriele Fain | Hannah Dunn-Grandpre | Hans Bos |
Stephanie D’Souza | Honora Stagner | Eboni Howard |

                                           MAKING RESEARCH RELEVANT

 AMERICAN INSTITUTES FOR RESEARCH® | AIR.ORG
Birth through Eight Strategy for
Tulsa (BEST) Phase II Evaluation
2020 Workforce Survey

MARCH 2021

Gabriele Fain | Hannah Dunn-Grandpre | Hans Bos |
Stephanie D’Souza | Honora Stagner | Eboni Howard |

1400 Crystal Drive, 10th Floor
Arlington, VA 22202-3289
202.403.5000
www.air.org
Notice of Trademark: “American Institutes for Research” and “AIR” are registered trademarks. All other brand, product, or company
names are trademarks or registered trademarks of their respective owners.
Copyright © 2021 American Institutes for Research®. All rights reserved. No part of this publication may be reproduced, distributed, or
transmitted in any form or by any means, including photocopying, recording, website display, or other electronic or mechanical
methods, without the prior written permission of the American Institutes for Research. For permission requests, please use the
Contact Us form on www.air.org.
2020 BEST Workforce Survey Report

Contents
                                                                                                                                           Page

Executive Summary .......................................................................................................................... v
  Key Findings ................................................................................................................................. v
  Conclusion .................................................................................................................................. vii

Introduction .....................................................................................................................................1

Section I. Survey and Sample Approach ..........................................................................................2
  Sample .........................................................................................................................................2

Section II. Findings ...........................................................................................................................3
  Diversity, Education and Experience ...........................................................................................4
  Staff Knowledge of BEST and Services in Tulsa............................................................................6
  Referral Practices Among BEST Partners .................................................................................. 11
  Service Access ........................................................................................................................... 16
  Communication and Coordination ........................................................................................... 18
  Role of Families in BEST Partners ............................................................................................. 19
  Professional Development and the Workplace ........................................................................ 21
  Racial Equity .............................................................................................................................. 22

Section III: Strengths and Improvement Opportunities for BEST ................................................. 24

Conclusion and Acknowledgements ............................................................................................. 26

Appendix. Survey Results .............................................................................................................. 27

AMERICAN INSTITUTES FOR RESEARCH® | AIR.ORG                                                                                                      ii
2020 BEST Workforce Survey Report
Exhibits
Page
Exhibit 1. Sector, Program, and Parent Organization for Survey Respondents ..............................3
Exhibit 2. The BEST workforce is diverse, educated, and experienced. ..........................................4
Exhibit 3. Respondents reported a range of job titles, the most common being early
childhood teacher/caregiver............................................................................................................5
Exhibit 4. Most staff who had heard about BEST learned about it from their organization’s
leaders. .............................................................................................................................................6
Exhibit 5. The rate at which respondents reported having heard about BEST varied by
job role. ............................................................................................................................................6
Exhibit 6. Fewer ELC staff had heard of BEST compared with staff in other service
sectors. .............................................................................................................................................7
Exhibit 7. Awareness and knowledge of BEST partners varies. .......................................................8
Exhibit 8. Respondents’ knowledge of other BEST partners varies by sector. ................................9
Exhibit 9. Staff awareness of services available to families varied............................................... 10
Exhibit 10. About half of referral staff know if a referral was successful. .................................... 11
Exhibit 11. Most referral staff know how to refer clients to a wide range of services. ............... 12
Exhibit 12. Most staff who refer clients make warm handoffs. ................................................... 14
Exhibit 13. Referral staff use warm handoffs referrals “sometimes” or “often” across a
range of service areas. .................................................................................................................. 15
Exhibit 14. The most common challenge to making warm handoffs is a lack of
professional connections to staff at other agencies..................................................................... 15
Exhibit 15. Staff reported a wide range of services that were difficult for children and
families to access in Tulsa. ............................................................................................................ 16
Exhibit 16. Transportation, child care, and wait times are the most significant challenges
to service access............................................................................................................................ 17
Exhibit 17. Slightly fewer than half of staff communicate with other agencies; among
those who do, most are satisfied with their communications. .................................................... 18
Exhibit 18. Lack of authority to discuss clients with other organizations was the most
common challenge to cross-agency client coordination. ............................................................. 18
AMERICAN INSTITUTES FOR RESEARCH® | AIR.ORG iii2020 BEST Workforce Survey Report Exhibit 19. Most respondents stated that is completely true that opinions of families are heard regardless of race, culture, or language spoken, but fewer reported specific family engagement opportunities were available. .................................................................................. 19 Exhibit 20. A higher proportion of staff in the ELC sector stated that opportunities exist for family members to be included in services. ............................................................................ 20 Exhibit 21. Staff expressed interest in a wide range of professional development topics. ......... 21 Exhibit 22. Respondents are satisfied with their jobs (but many find them stressful). ............... 22 Exhibit 23. The majority of staff reported that clients’ race or ethnicity is a cause of challenges and/or advantages experienced by their clients. ....................................................... 23 Exhibit 24. Staff indicated that their clients’ race/ethnicity is the cause of many challenges in their lives. ................................................................................................................ 24 Exhibit A1. Percentage of respondents who refer clients to other agencies for services............ 27 Exhibit A2. Percentage of respondents who have or would be able to make a referral to the following service areas ........................................................................................................... 27 Exhibit A3. Referral practices ........................................................................................................ 28 Exhibit A4. Barriers to service access............................................................................................ 28 Exhibit A5. Coordination of services ............................................................................................. 29 Exhibit A6. Role of families in BEST partner agencies................................................................... 30 Exhibit A7. Percentage of respondents who speak to their clients about challenges related to race or ethnicity ........................................................................................................... 31 Exhibit A8. Percentage of clients citing race as a reason for the following scenarios occasionally or a great deal of the time ....................................................................................... 31 AMERICAN INSTITUTES FOR RESEARCH® | AIR.ORG iv
2020 BEST Workforce Survey Report

Executive Summary
The American Institutes for Research (AIR) is conducting the Birth through Eight Strategy for Tulsa
(BEST) Phase II Evaluation—the BEST Study. As part of the study, AIR will conduct annual
workforce surveys of frontline staff and their managers who work for BEST partners. This report
summarizes the findings from the first administration of the workforce survey in fall 2020. The
survey gathered information on staff knowledge of BEST partner services, referral practices,
service access barriers and facilitators, communication and coordination among service providers,
the role of families in BEST partner agencies, workforce issues, and staff perceptions regarding
racial equity issues.

In 2020, the workforce survey was administered to 297 frontline staff and their managers within
21 BEST partner organizations that directly deliver services to children, parents, or other adults.
The overall response rate for the survey was 67 percent, with a
sample size of 206 respondents. In addition to summarizing
data across all responses in the report, we disaggregate results        BEST WORKFORCE SAMPLE
by service sector to examine if there were differences in
responses across sectors. These sectors include early learning
                                                                        The BEST workforce
and care (ELC) programs and related supports, family support            sample is ethnically and
programs, and health-related services.                                  racially diverse and highly
                                                                       educated and experienced.
Key Findings                                                           • 39% White
                                                                       • 22% Black
1. Staff knowledge of the BEST initiative and individual BEST
                                                                       • 25% Hispanic
   partners varied. About two thirds of the respondents had            • 3% American Indian,
   heard of the BEST initiative. The vast majority of                     Alaska Native, or Native
   respondents in the family support and health sectors had               American
   heard of BEST, whereas only half of the respondents in the          • 12% other
   ELC sector knew about BEST. Among all respondents, the              • 69% hold a bachelor’s
                                                                          degree or higher
   most well-known partner was the Women, Infant and
                                                                       • 37% have more than
   Children (WIC) program, with 75 percent of respondents
                                                                          10 years of experience
   indicating that they knew a lot about them, followed                   in the field(s) of early
   closely by Emergency Infant Services.                                  childhood, education,
                                                                          and/or health and
2. BEST partners regularly refer clients to needed services.              human services.
   Almost two thirds of the respondents indicated that they            • 42% have been
   routinely make client referrals to other agencies, either              employed at their
   formally and/or informally, as part of their job. These staff          current organization for
                                                                          two years or less
   reported making referrals (or having the knowledge to do
   so) across a broad range of service sectors. More than half

AMERICAN INSTITUTES FOR RESEARCH® | AIR.ORG                                                           v
2020 BEST Workforce Survey Report of the staff who reported they make referrals, stated that they use “warm handoffs” during referrals, meaning they personally help their clients contact other service providers. Referrals are made most to health programs, followed by family support, parent education, and mental health services. 3. Staff reported that the most difficult sector for clients to access is child care for infants and toddlers, followed closely by housing assistance, legal services, and mental health services for adults. Common challenges to service access include a lack of transportation, a lack of child care, long wait times for services, client concerns about their immigration status, and clients’ lack of knowledge about available services. Staff responded to an open- ended survey question regarding ways to improve services in Tulsa; the most common response was raising awareness about existing services. 4. Many BEST partner staff in different programs communicate regularly about shared clients. More than half of the respondents reported communicating with staff in other agencies. The most cited reason for coordination problems between agencies was that staff often do not have permission to discuss clients with other organizations. 5. Engaging families in decision making and leadership roles is challenging. A large majority of respondents said it was at least somewhat challenging to involve parents and family members in efforts to improve services, mostly because of the lack of time on the part of the parents and family members. Less than half of the respondents agreed with the statement that staff regularly try to get ideas from parents on how to improve services, and less than one third of the respondents reported that (a) opportunities exist for parents to serve in leadership roles and (b) parents are included in meetings where decisions are made about improving services. When data are analyzed by service sector, it appears that there are more opportunities for family engagement in the ELC sector, as compared to the health- related services and family support sectors. 6. Staff enjoy their jobs, but many agreed that their work is stressful. Almost all respondents believed that their work makes a meaningful contribution, and the vast majority reported having the support and resources they need to do their jobs well. The majority of staff agreed or strongly agreed that it would take a lot for them to leave their jobs. At the same time, more than half of the respondents reported that their job was very stressful. Staff indicated a strong degree of interest in professional development across a range of topics. 7. Half of responding staff reported that they talk with their adult clients about challenges or advantages they may face because of their race or ethnicity. Staff also described how frequently their adult clients told them that their race/ethnicity was the reason they faced various challenges in their lives. The most common challenges (rated as a challenge occasionally or a great deal) were receiving poor- or low-quality services, followed by being AMERICAN INSTITUTES FOR RESEARCH® | AIR.ORG vi
2020 BEST Workforce Survey Report

    paid less in their jobs. More than two thirds of the staff indicated that clients reported that
    their race/ethnicity was the reason they were stopped by the police or another official.

Conclusion
The 2020 BEST workforce survey highlighted many strengths of the service system in Tulsa.
Frontline staff and their managers working in BEST agencies reflect a diverse workforce, as well as
a highly educated and experienced one. Many staff, particularly in the family support and health
service sectors, are aware of the BEST initiative. Some (but not all) of the BEST partners are well-
known among staff. In addition, the capacity for making referrals among staff is strong; referral
staff make referrals (or know how to do so) across many different service areas, and many use
warm handoffs to help ensure that their clients engage with services once referred. Staff working
in BEST partner agencies reported that they enjoy their work and believe that they are making a
meaningful contribution in their jobs. Finally, staff interest in professional development is high,
particularly in the area of implementing trauma-informed care.

The survey data also suggest areas that may inform continuous quality improvement efforts for
BEST, as follows:
•   Staff reported varying levels of awareness about other BEST-funded organizations in Tulsa.
    In addition, staff indicated that their clients are often not aware of the services that are
    available to them in the community. These findings suggest a need for increased outreach
    to staff (and families) about existing resources in Tulsa.
•   Opportunities for families to get involved in partners’ efforts to improve program services
    appears somewhat limited. Analysis of survey data by sector showed that families have
    more meaningful engagement in ELC program services than they do in the health and family
    support sectors—a finding that is not surprising given the role that family engagement plays
    in ELC pedological approaches and program structure. Strategies used in the ELC field may
    serve as a model for efforts to improve family engagement in other service areas engaged
    with the BEST initiative.
•   Warm handoffs appear to be fairly common—yet for some services more so than others
    (e.g., only about one third or fewer of referral staff use warm handoffs to connect clients to
    services related to housing or job placement). The most commonly reported challenge to
    warm hand-offs was a lack of professional connections with staff in other agencies—an
    actionable finding that can inform BEST’s efforts to create a network of coordinated
    agencies.

The survey also identified barriers to service access and issues around racial equity that
underscore the need for system-level strategies. Staff described the need to improve Tulsa’s

AMERICAN INSTITUTES FOR RESEARCH® | AIR.ORG                                                        vii
2020 BEST Workforce Survey Report transportation system; increase the capacity of services to reduce long wait times for clients; and improve the supply of affordable, high-quality infant and toddler child care. Staff responses also highlighted challenges their clients face due to their race/ethnicity, including poor or low- quality services, pay disparities, and negative experiences with the police. Respondents pointed to the need for community-wide diversity, equity, and inclusion training as well as opportunities to support public dialogue about racism in Tulsa. The workforce survey will occur annually during the BEST Study, allowing us to capture changes across time in the early childhood workforce in Tulsa, which will reflect the impact of the BEST initiative as it continues to grow and evolve. We greatly appreciate the time and attention that the survey respondents gave us. Their work is critical to the families and children of Tulsa and their input is essential for the success of our evaluation. We also want to thank the BEST partner leaders from 21 Tulsa organizations and their staff who worked with our team to compile the survey sample and the GKFF-BEST team for their overall support for the survey effort. AMERICAN INSTITUTES FOR RESEARCH® | AIR.ORG viii
2020 BEST Workforce Survey Report

Introduction
The purpose of this report is to summarize information from the first workforce survey of the
Birth through Eight Strategy for Tulsa (BEST). BEST provides coordinated supports in the earliest
years of children’s lives to help make Tulsa a good place for all children and families to live,
grow, and thrive. By convening a diverse network of community partners in Tulsa that are
public agencies, health and child care providers, education institutions, and local nonprofit
organizations, BEST aims to develop a seamless multisector continuum of high-quality programs
and services for children from birth through age 8 and their families to increase the percentage
of children who are (a) born healthy, (b) on a positive developmental trajectory by age 3,
(c) ready to enter kindergarten, and (d) achieving success by third grade.

Until now, little systematic information has been collected from the BEST partners’ workforce –
the frontline staff and their managers who provide the pivotal services that are the cornerstone
of BEST. 1 The workforce survey is part of the BEST Phase II Evaluation—the BEST Study—
conducted by the American Institutes for Research (AIR). The BEST Study is a 6-year study to
learn how and in what ways a comprehensive, continuous, and integrated system-change
approach can build greater opportunities that will improve the lives of young children and their
families in Tulsa. In measuring the impact of BEST at the child level, it also is valuable to track
BEST processes and activities at the system level and understand how the impact of BEST is
actualized in the daily lives of children and families. As such, the evaluation has three study
components:
•    A process study will provide information about how the BEST initiative engages with,
     supports, and interacts with the preconception-to-age-8 service infrastructure in Tulsa.
•    An outcome/impact study will provide information about what it is like to be born and
     grow up in Tulsa or to be a parent to a child between 0 and 8 years old from a
     representative Tulsa sample. It includes four cohorts of children: two followed from birth
     and two followed from the start of kindergarten.
•    An ethnographic study will describe the routines and experiences of a small subset of
     families participating in the outcome/impact study.

These three study components work together to answer all the BEST evaluation research
questions. The workforce survey is a component of the process study. The study team will
conduct this survey annually to capture change across time in providers’ knowledge of available
services, referrals among different BEST partners, and collaboration among partners, as well as

1Frontline staff for this survey include staff members whose main responsibilities are to deliver services to clients and the
managers or coordinators who directly oversee their work.

AMERICAN INSTITUTES FOR RESEARCH® | AIR.ORG                                                                                     1
2020 BEST Workforce Survey Report
other topics relevant to children and families in Tulsa and the services available to them. In
Section I, we describe the design and sample of the workforce survey. In Section II, we
summarize the major findings from staff report across eight main survey topics. In Section III,
we highlight the strengths and improvement opportunities for the BEST Initiative that emerged
from the survey findings. The appendix presents a set of supplemental tables that contain
numbers referenced in the text but not included in exhibits in the body of the report.
Section I. Survey and Sample Approach MAIN SURVEY TOPICS
The purpose of the workforce survey is to help provide a
a) Demographic
ground-up perspective of how staff of the BEST partners
information about
experience the implementation of BEST, with an eye to respondents
documenting changes across time on eight main topics (see b) Staff knowledge of
sidebar). The 2020 survey consisted of 161 items and took BEST partner services
about 30 minutes to complete. Most survey items capture c) Referral practices
descriptive data that we present the frequency of. The survey d) Service access barriers
and facilitators
also obtained some qualitative data through open-ended
e) Communication and
responses. Using an online survey software platform, we coordination among
launched the survey on October 27, 2020, and closed it on BEST partners
December 7, 2020. The survey was administered to f) Role of families in BEST
297 frontline staff and their managers within 21 BEST partner partner agencies
organizations.2 If acceptable to their respective organization, g) Staff workforce issues
h) Staff perceptions
respondents received a $15 gift card as a thank-you for
regarding racial equity
completing the survey. issues
Sample
The survey was sent to 297 BEST frontline staff and their managers. The overall response rate for
the survey was 67 percent (n = 206), with a range from 0 percent (one partner) to 100 percent
(seven partners) across the 21 BEST partners. Eleven of these respondents worked for more than
one agency or program. The representation of respondents across agencies reflects the size of the
agency workforces; larger partner agencies were more heavily represented than smaller ones. Most
respondents were frontline staff working directly with children and families (83 percent), and the
remaining portion (17 percent) were managers and supervisors. We also present results by survey
respondents grouped into three general service sectors: (a) ELC programs and supports, (b) family
support programs, and (c) health-related services (detailed in the next section). Exhibit 1 presents
2GKFF-BEST provided a list of their actively funded BEST partners for the purposes of this survey. Only BEST partners who
directly deliver services to children, parents, or other adults were included in the survey.
AMERICAN INSTITUTES FOR RESEARCH® | AIR.ORG 22020 BEST Workforce Survey Report
the sample size by service sector, the largest sector being ELC
(n = 119), followed by family support (n = 52) and health-related services (n = 35).
Exhibit 1. Sector, Program, and Parent Organization for Survey Respondents
Sector Program and parent organization
Centering Pregnancy, Community Health Connection
Healthy Steps, Oklahoma University School of Community Medicine
Family Connects, Parent Child Center
Take Control Initiative
Heath-related
Healthy Start, Tulsa Health Department
services
Lactation consultant, Tulsa Health Department
Doula program, Tulsa Birth Equity Initiative
Youth Services of Tulsa
Total: 35
17 percent
Women in Recovery, Family and Children’s Services
Women’s Justice Team Family and Children’s Services
Bright Beginnings, Parent Child Center
Children-First, Tulsa Health Department
Little by Little, Tulsa Health Department
Family support
WIC, Tulsa Health Department
Family Advocates, Tulsa Health Department
ParentPRO, Tulsa Health Department
Strong Tomorrows, Tulsa Public Schools
Total: 52
25.2 percent
CAP Tulsa
Tulsa Educare
Early Learning and
Reach Out and Read
Care
Reading Partners
Total: 119
57.8 percent
Source: December 2020 workforce survey.
Notes: N = 206. 11 respondents worked for multiple programs.
Section II. Findings
The survey findings are described in eight major categories: (a) staff demographic characteristics,
education, and experience; (b) staff knowledge about the BEST initiative and service providers in
AMERICAN INSTITUTES FOR RESEARCH® | AIR.ORG 32020 BEST Workforce Survey Report
Tulsa; (c) referral practices among BEST partners; (d) staff perceptions of service access in Tulsa;
(e) communication and coordination activities among partners; (f) the role of families in BEST
partners; (g) staff professional development needs and satisfaction with their jobs; and
(h) perceptions of racial equity issues.
Diversity, Education and Experience
The survey respondents reflect a BEST partner workforce that is highly educated and experienced:
more than two thirds of the respondents (69 percent) had a bachelor’s degree or higher (Exhibit 2).
Exhibit 2. The BEST workforce is diverse, educated, and experienced.
Variable Characteristic N Percentage
High school 10 5.2 5.2
Vocational, some college, or associate degree 50 25.9 25.9
Education Bachelor’s degree 79 40.9 40.9
Some graduate school 15 7.8 7.8
Graduate degree 39 20.2
20.2
Less than 1 year 9 4.7 4.7
Total years of 1–2 years 28 14.5
14.5
experience in 3–5 years 34 17.6
17.6
relevant fieldsa 6–10 years 50 25.9 25.9
More than 10 years 72 37.3 37.3
Less than 1 year 29 14.8
14.8
1–2 years 54 27.6 27.6
Time at current
3–6 years 66 33.7 33.7
organization
7–10 years 22 11.2
11.2
More than 10 years 25 12.8
12.8
American Indian or Alaska Native, Non-Hispanic 5 2.6
Black, African American, African, Non-Hispanic 42 22
Race/ethnicity Hispanic 48 25.1
White, Non-Hispanic 74 38.7
Other, Non-Hispanicb 22 11.5
English only 128 64.6
Language 26.8
English and Spanish 53
spoken 8.6
English and other language 17
Source: AIR calculations from the December 2020 workforce survey.
Note: N = 206.
a We asked respondents to indicate their total years of professional experience in the field(s) of early childhood,
education, and/or health and human services.
b This category consists of participants who identified as multiracial, Asian, and other.
More than one third of the respondents (37 percent) had more than 10 years of experience in the
fields of early childhood, education, and/or health and human services, with another quarter of
the sample having between 6 and 10 years of experience (26 percent). Notably, respondents’ job
AMERICAN INSTITUTES FOR RESEARCH® | AIR.ORG 42020 BEST Workforce Survey Report
tenure at their current BEST partner organization was relatively short. Slightly less than half of the
sample (42 percent) had been employed at their current organization for 2 years or less.
The BEST partner workforce also is ethnically and racially diverse (Exhibit 2). Almost two thirds
of the respondents (61 percent) identified themselves as being non-Hispanic Black or African-
American, Hispanic, American Indian, Alaska Native, or Native American, multiracial, or another
race or ethnicity. One third of the sample (35 percent) reported speaking a language other than
English. Compared to the population of Tulsa as a whole, the BEST partner workforce is more
diverse; 54 percent of Tulsans identify as White, 15 percent as Black, 17 percent Hispanic, and
14 percent two or more races or other.3
Exhibit 3 shows the number and percentage of staff in the survey sample, by their job role.
Early childhood teachers/caregivers made up 34 percent of the sample, followed by case
managers/social workers (11 percent), and WIC staff (7 percent).
Exhibit 3. Respondents reported a range of job titles, the most common being early childhood
teacher/caregiver.
Job title N Percentage
Case manager/social worker 18 10.5%
ConnectFirst Family Advocate 6 3.5%
Other family advocate 10 5.8%
Early childhood teacher/caregivers 22a 12.8%
Early childhood assistant teacher/caregiver 14 8.1%
Elementary staff 8 4.7%
Doula 3 1.7%
Front office staff 1 0.6%
Healthy Steps specialist 6 3.5%
Home visitor 4 2.3%
Lactation consultant 1 0.6%
Mental health professional 8 4.7%
Nurse/nurse educator 10 5.8%
Parent educator 4 2.3%
Special education/early intervention staff 1 0.6%
WIC staff 12 7.0%
Youth counselor/educator 6 3.5%
Other 37 21.5%
Source: AIR calculations from the December 2020 workforce survey.
3 U.S. Census Bureau. (2019). Tulsa, OK profile. https://censusreporter.org/profiles/16000US4075000-tulsa-ok/
AMERICAN INSTITUTES FOR RESEARCH® | AIR.ORG 52020 BEST Workforce Survey Report
Notes: N = 172. Respondents in this job category who did not clarify if they were a teacher/caregiver, or an
assistant teacher/caregiver, were categorized as teachers/caregivers (n = 2) for the purposes of this survey.
Staff Knowledge of BEST and Services in Tulsa
Among respondents, 63 percent reported that they had heard of the BEST initiative (Exhibit 4).
The most common way that respondents learned about BEST is from leadership at their own
organization (71 percent), followed by a BEST professional meeting or event (33 percent).
Exhibit 4. Most staff who had heard about BEST learned about it from their organization’s leaders.
Response %
Had heard about the BEST initiative 63.1%
Among those who had heard about BEST, how did they learn? (Select all that apply)
From leadership at my organization 70.8%
At a professional meeting or event (meeting about BEST, at a BEST convening) 33.1%
From a coworker 11.5%
At a community meeting (meeting with members of the community) 8.5%
BEST website 6.9%
Other 5.4%
Written information (description of BEST, flyer, brochure) 4.6%
Source: AIR calculations from the December 2020 workforce survey.
Note: N = 183.
Exhibit 5 shows that the proportion of staff who had heard about the BEST initiative varied by
their role. Nurses, case managers/social workers, WIC staff, and family advocates were most
familiar with BEST, compared with teachers/caregivers and other staff.
Exhibit 5. The rate at which respondents reported having heard about BEST varied by job role.
Nurse 100.0%
Case manager/social worker 83.3%
WIC staff 83.3%
Family advocates 68.8%
All respondents 63.1%
Teacher/caregiver 54.6%
Other 52.1%
Assistant teacher/caregiver 35.0%
Source: AIR calculations from December 2020 workforce survey.
AMERICAN INSTITUTES FOR RESEARCH® | AIR.ORG 62020 BEST Workforce Survey Report
Notes: N = 171. Percentages of survey respondents by job role who responded “Yes, I’ve heard of the BEST
initiative.” “Other” includes attorney/legal professional, doulas, front office staff, Healthy Steps specialists, home
visitors, lactation consultant, mental health professionals, parent educators, physicians, special education/early
intervention staff, and youth counselors/educators.
Whether staff had heard of the BEST initiative also varied across programs when organized into
the three service sectors (Exhibit 6). A greater percentage of staff in the family support and
health/prenatal sectors reported having heard of BEST (88 and 91 percent, respectively) than
those in the ELC sector, where only 51 percent of the respondents had heard of BEST.
Exhibit 6. Fewer ELC staff had heard of BEST compared with staff in other service sectors.
Health 91.2%
Family Support 88.2%
All respondents 63.1%
Early Learning and Care 51.4%
Source: AIR calculations from the December 2020 workforce survey
Notes: N = 206. Percentages of survey respondents who responded “Yes, I’ve heard of the BEST initiative.”
See Exhibit 1 for a description of BEST partners by sector.
In addition to indicating whether they knew about the BEST initiative as a whole, we asked staff
about their awareness and knowledge of other BEST partners by selecting one of the following
options: (a) “never heard of these services”; (b) “I’ve heard of these services but don’t know
much else”; and (c) “I’ve heard of these services and know a lot about them.” Exhibit 7 shows
the percentage of staff who indicated that they heard of BEST partners and knew a lot about
them. Among all respondents, the most frequently selected partner was the WIC program, with
75 percent of the respondents indicating that they heard of them and knew a lot about them,
followed closely by Emergency Infant Services (71 percent) and CAP Tulsa (66 percent). The
least well-known BEST partners were the Jail Visitation Program (only 15 percent of the
respondents heard and knew a lot about them), followed by Little by Little (11 percent) and
Centering Pregnancy (9 percent).
AMERICAN INSTITUTES FOR RESEARCH® | AIR.ORG 72020 BEST Workforce Survey Report
Exhibit 7. Awareness and knowledge of BEST partners varies.
WIC 74.1%
Emergency Infant Services 70.6%
CAP Tulsa 66.1%
Educare 60.1%
Youth Services of Tulsa 58.5%
Women in Recovery 49.7%
Take Control Initiative 45.2%
Healthy Start 44.5%
Lactation consultant 43.3%
Children First Home Visiting 39.1%
Reading partners 38.6%
ECE at Tulsa Public Schools 38.2%
ConnectFirst 34.0%
parentPRO 31.5%
Bright Beginnings 29.5%
Strong Tomorrows 28.1%
Family Connects 27.3%
HealthySteps 25.1%
Reach Out and Read 24.8%
Women’s Justice Team 19.9%
Still She Rises 19.1%
Community-based Doula program 16.3%
Jail Visitation Program 15.1%
Little by Little 10.9%
Centering Pregnancy 8.4%
Source: AIR calculations from December 2020 workforce survey.
Notes: N = 206. Percentages shown indicate the proportion of survey respondents who responded “Yes, I’ve heard
of these services and know a lot about them.”
Exhibit 8 reorganizes these results to examine how staff knowledge of specific BEST partner
agencies varied within the three service sectors. Among programs within the ELC sector, 66
percent of respondents indicated that they heard of and knew a lot about CAP Tulsa, followed
by 60 percent of respondents who reported this same level of knowledge about Educare. Other
BEST partners in the ELC sector, such as Reach Out and Read and Strong Tomorrows, were less
familiar to the respondents.
Among programs within the family support sector, most respondents heard of and knew a lot
about WIC (74 percent). Emergency Infant Services, Women in Recovery, and Children-First
were the next most frequently selected programs, with 71, 50 and 39 percent, respectively, of
the respondents noting that they heard and knew a lot about these programs. In this sector,
AMERICAN INSTITUTES FOR RESEARCH® | AIR.ORG 82020 BEST Workforce Survey Report
the programs with the fewest respondents who heard of and knew a lot about were the Jail
Visitation Program (15 percent) and Little by Little (11 percent).
Among health sector programs, most respondents (59 percent) knew a lot about Youth Services
of Tulsa. About half of the respondents (45 percent) knew a lot about the Take Control Initiative
and Healthy Start (45 percent), followed by lactation consultants (43 percent). Most other
health services were not as widely known (ranging from 8 percent for Centering Pregnancy to
27 percent for Family Connects).
Exhibit 8. Respondents’ knowledge of other BEST partners varies by sector.
CAP Tulsa 66.1%
Educare 60.1%
Reading partners 38.6% Early Learning
ECE at Tulsa Public Schools 38.2% and Care
Reach Out and Read 24.8%
WIC 74.1%
Emergency Infant Services 70.6%
Women in Recovery 49.7%
Children First Home Visiting 39.1%
ConnectFirst 34.0%
parentPRO 31.5%
Bright Beginnings 29.5%
Strong Tomorrows 28.1%
Family
Women’s Justice Team 19.9% Support
Still She Rises 19.1%
Jail Visitation Program 15.1%
Little by Little 10.9%
Youth Services of Tulsa 58.5%
Take Control Initiative 45.2%
Healthy Start 44.5%
Lactation consultant 43.3%
Family Connects 27.3%
HealthySteps 25.1% Health
Community-based Doula program 16.3%
Centering Pregnancy 8.4%
Source: AIR calculations from December 2020 workforce survey.
Notes: N = 206. Percentages shown indicate the proportion of survey respondents who responded “Yes, I’ve heard
of these services and know a lot about them.”
AMERICAN INSTITUTES FOR RESEARCH® | AIR.ORG 92020 BEST Workforce Survey Report
In addition to their knowledge of other BEST partners, respondents reported on their
knowledge of other services available in Tulsa, such as SoonerCare; the Supplemental Nutrition
Assistance Program (SNAP); and other housing, nutrition, and family support services.
Exhibit 9 shows that the two most well-known programs among respondents were SNAP and
SoonerCare, with 82 and 81 percent, respectively, of the respondents selecting “I’ve heard
about these services, and know a lot about them.” The majority of respondents also reported
having heard of and knowing a lot about Family and Children’s Services and the 211
nonemergency telephone line for connecting to community services. The programs least known
to partner staff were the Maternal Child Health Outreach program (16 percent), Tulsa County
Pharmacy Services (22 percent), and the Tulsa County Food Assistance Program (34 percent).
Exhibit 9. Staff awareness of services available to families varied.
Food stamps/SNAP 81.9%
Sooner Care 81.3%
Family and Children's Services 74.4%
211 70.0%
COPES 69.3%
Domestic Violence Intervention Services 66.7%
Tulsa County Emergency Shelter 40.7%
Tulsa County Medical Clinics 36.0%
Tulsa County Food Assistance Program 34.1%
Tulsa County Pharmacy Services 22.2%
Maternal Child Health Outreach Program 16.3%
Source: AIR calculations from December 2020 workforce survey.
Notes: N = 206. Family and Children’s Services (FCSOK) refers to all other child, youth, adult, and family mental
health services provided by FCSOK.
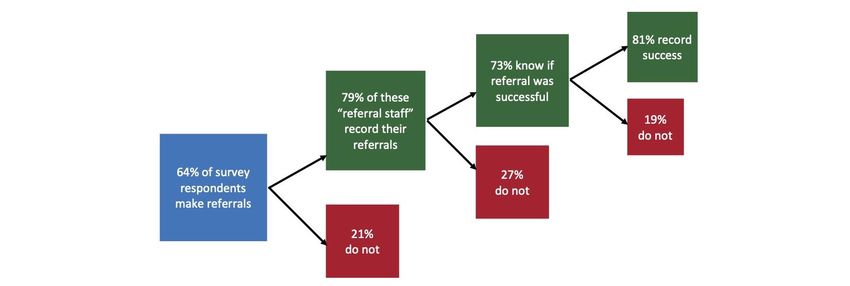
AMERICAN INSTITUTES FOR RESEARCH® | AIR.ORG 102020 BEST Workforce Survey Report Referral Practices Among BEST Partners The workforce survey sought to gather information about the For this sub-section of the extent to which staff referred their clients to community report (Referral Practices services outside their own programs or agencies. Sixty-four Among BEST Partners), percent of all survey respondents (n = 131) indicated that they we use the phrase routinely make such outside referrals, either formally and/or “referral staff.” This informally.4 This group of staff are described as “referral staff” refers to the 64 percent for the purposes of this report. Referral staff responded to a (n = 131) of all staff who series of detailed questions concerning whether and how they reported making external tracked information about the referrals they make, their referrals for clients as knowledge of and ability to make referrals for specific needs, part of their job. and challenges they encountered related to referrals. Exhibit 10 illustrates the referral pathway process, starting with all referral staff (the 64 percent, n = 131, of all staff who indicated they make referrals to other programs outside their own agency). As we follow the process of referrals, we learned that most referrals are recorded in a client management system (79 percent of 131 referral staff reported doing so), but staff do not always know if the referral was successful, and if the referral was successful, it is not always recorded as a success. As Exhibit 10 illustrates, many client referrals either happen informally (without being recorded) or staff do not know the outcome of the referral or record the outcome of the referral, which may limit their ability to evaluate or follow-up on these referrals. Exhibit 10. About half of referral staff know if a referral was successful. Source: AIR calculations from December 2020 workforce survey. Note: Sixty-four percent of the sample make referrals (n=131). To calculate the other percentages, we ignored respondents who answered: “I do not know” and we restricted the sample to those answering “yes” in the previous step. 4 See Exhibit A1 in the appendix for more details about referral practices. AMERICAN INSTITUTES FOR RESEARCH® | AIR.ORG 11
2020 BEST Workforce Survey Report

The survey data indicate that the ability of staff to make referrals is high. As noted earlier,
64 percent of survey respondents (n = 131) make referrals as part of their job. We asked this
group of referral staff to indicate if they had made a referral to each of the service sectors listed
in Exhibit 11. If they had not made a referral to a service sector, they indicated if they would
know how to do so, if there was a need.

Exhibit 11 shows the percentage of referral staff (n=131) who reported that they have made a
referral, or know how to do so, across various service sectors. The sectors that received the
most referrals are health services (80 percent of referral staff indicated they had made a
referral in this area), child care (74 percent), and mental health services (73 percent). A smaller
number of referral staff (47 percent) reported that they had referred a client to home visiting.
Home visiting referral rates may be lower compared with other sectors because these services
focus on a narrower group of clients (expectant parents and parents of infants and toddlers)
than the other services listed in Exhibit 11.

Exhibit 11. Most referral staff know how to refer clients to a wide range of services.

             Health                                  79.8%                                       15.9%

         Child care                                74.3%                                 12.9%

     Mental health                              72.6%                                   14.7%

  Parent education                           68.5%                                 13.0%

 Housing assistance                          68.1%                                    18.5%

     Family support                          67.8%                                     20.0%

         Preschool                          66.0%                                  18.0%

          Nutrition                         65.8%                                  18.4%

  Domestic violence                        63.6%                                      25.6%

      Legal support                        61.9%                              14.1%

        Job training                    59.7%                                 18.4%

     Home visiting                 47.3%                            19.8%

                              Have made a referral           Could make referral

Source: AIR calculations from December 2020 workforce survey.
Note: N = 131.

We examined if referral practices varied across sectors to determine if staff working in the ELC,
family support, and health sectors refer clients (or have the knowledge to do so) to services at
different rates. Referral practices do not vary widely by service sector. For example, a large

AMERICAN INSTITUTES FOR RESEARCH® | AIR.ORG                                                                          12
2020 BEST Workforce Survey Report percentage of staff across all sectors refers clients (or knows how to do so) to nutrition services (85 percent of ELC staff, 85 percent of family support staff, and 83 percent of health staff).5 In the survey, we also asked respondents about what staff do when they refer clients (i.e., their referral practices), as summarized in Exhibit 12. To create this figure, we first asked respondents to indicate all referral methods they use (see exhibit A3 in the appendix for details about the methods). We then sorted the answers by the level of staff involvement in making the referral [ranging from (a) making a personal “warm handoff”6 to (b) referring clients to family advocates to (c) giving clients a list with contact information for other programs and agencies and to (d) advising clients to call 211]. We then grouped respondents by the highest level of involvement they reported using. So, for example, if a respondent indicated making both warm handoffs and distributing provider lists, we classified this respondent as someone who provides warm handoffs. Using this approach, we found that more than half of the referral staff (53 percent) reported they personally provide a warm handoff for clients to connect them with service providers (Exhibit 12). Among referral staff who do not make such warm handoffs themselves, approximately one in five refer clients to ConnectFirst family advocates or to family advocates within their own organizations who can make those warm handoffs for them. Of the referral staff who did not report making warm handoffs themselves and do not connect their clients to family advocates, the majority reported providing their clients with a list of services/resources to contact on their own (30 percent of the total). Only 4 percent of the staff who refer clients reported they tell clients to call 211 and do nothing else to facilitate a referral. 5See Exhibit A2 in the appendix for more details about referral practices by sector. 6The survey defined a warm hand-off as when a service provider personally helps a client connect with another service provider. AMERICAN INSTITUTES FOR RESEARCH® | AIR.ORG 13
2020 BEST Workforce Survey Report

Exhibit 12. Most staff who refer clients make warm handoffs.
                                                                    Other
                                 Suggest client call 211            0.8%
                                         3.9%

                                          Provide a list
                                          of resources              Help client
                                              31.3%               contact provider
                                                                       53.1%

                       Refer to family
                       advocate 10.9%

Source: AIR calculations from December 2020 workforce survey.
Notes: N = 131. Respondents could indicate multiple options, and we credited them with the most intensive
referral option they selected (i.e., Help client contact provider > referral to family advocate > provide a list of
resources > call 211). See exhibit A3 in the appendix for all the data underlying this figure.

In addition to this general breakdown of referral practices, the workforce survey also included
more detailed questions about how often respondents are able to make warm handoffs. Exhibit
13 shows the percentage of referral staff who make such warm handoffs to different service
sectors sometimes or often. Warm hand offs are made most commonly to health programs
(60 percent of referral staff reported making such direct referrals), followed by family support,
parent education, and mental health services (each reported by about 50 percent of referral
staff). Approximately one third of referral staff (ranging from 31 to 37 percent) reported making
warm handoffs to the rest of the service sectors listed in Exhibit 14, with the lowest rate for job
training and placement programs (28 percent).

AMERICAN INSTITUTES FOR RESEARCH® | AIR.ORG                                                                           14
2020 BEST Workforce Survey Report
Exhibit 13. Referral staff use warm handoffs referrals “sometimes” or “often” across a range
of service areas.
Health services 59.4%
Family support 50.0%
Parent education 50.0%
Mental health services 48.5%
Home visiting 37.3%
Early childhood education 36.8%
Domestic violence assistance 36.7%
Nutrition assistance 34.9%
Child care 34.7%
Legal services 32.8%
Housing assistance 30.5%
Job training and placement 28.3%
Source: AIR calculations from December 2020 workforce survey. Warm handoffs are defined as when a service
provider personally helps a client connect with another service provider, as part of the referral process.
Note: N = 131.
Referral staff also provided feedback on challenges to making warm handoff referrals to other
agencies, as shown in Exhibit 14, the most common (cited by 34 percent of referral staff) being
a lack of professional connections to service providers. Fifteen percent of the referral staff who
make warm handoffs reported that they were challenging because such referrals were not part
of their own organization’s goals/procedures. Lack of time was also an issue (9 percent of the
referral staff pointed to their own limited time, and 11 percent pointed to the limited
availability of staff in other agencies).
Exhibit 14. The most common challenge to making warm handoffs is a lack of professional
connections to staff at other agencies.
Item Percentage
In general, what are the challenges in making warm handoff referrals to other
agencies, if any? (Check all that apply)
I don’t have professional connections at other service providers (e.g., I know the
33.5%
referral phone number but not the person who answers the phone)
Warm handoffs are not part of my organization’s goals/procedures for referrals 14.8%
Other service providers I refer to don’t have enough time 11.4%
I don’t have enough time 9.1%
Warm handoffs are not part of the goals/procedures of organizations I refer clients to 7.4%
Other 8.0%
I experience no challenges making warm handoff referrals 15.9%
Source: AIR calculations from December 2020 workforce survey.
AMERICAN INSTITUTES FOR RESEARCH® | AIR.ORG 152020 BEST Workforce Survey Report
Note: N = 131.
Service Access
We asked survey respondents to indicate which service sector was the hardest for children or
adults to access in Tulsa. As shown in Exhibit 15, 27 percent of staff reported that they did not
know which service sector was the hardest for children. The rest of the responses were spread
relatively evenly across service sectors. The most difficult sector to access, according to staff, is
child care for infants and toddlers (14 percent), followed by housing assistance (13 percent),
legal services (11 percent), and mental health services for adults (11 percent).
Exhibit 15. Staff reported a wide range of services that were difficult for children and families
to access in Tulsa.
I don't know 26.9%
Child care (infants/toddlers) 14.4%
Housing assistance 12.9%
Legal services 11.4%
Mental health services for adults 11.0%
Other (see note) 10.4%
Health services 4.5%
Job training and placement 4.5%
Mental health services for children 4.0%
Source: AIR calculations from December 2020 workforce survey.
Notes: N = 206. Other includes early childhood education (programs for preschool-aged children), parent
education, family support, and nutrition assistance.
After identifying the types of service areas that were the most difficult for children and families
to access in Tulsa, respondents indicated why they thought that was the case (n = 150). As
shown in Exhibit 16, the most mentioned barrier was transportation (identified by 61 percent of
the respondents, n = 85), followed by a long wait time for services (56 percent, n = 81), finding
affordable child care so that parents can participate in services (51 percent, n = 71), client
confusion about applying for services (49 percent, n = 69), and clients being unaware of
available services (49 percent, n = 68).
AMERICAN INSTITUTES FOR RESEARCH® | AIR.ORG 162020 BEST Workforce Survey Report
Exhibit 16. Transportation, child care, and wait times are the most significant challenges to
service access.
Transportation barriers 60.7%
Long wait time 56.3%
Finding affordable childcare 50.7%
Applying for new services is confusing 49.3%
Unaware of services available 48.6%
Immigration status 45.4%
Eligiility requirements 39.4%
Unaware of helpful services 36.2%
Service location 32.6%
Langauge 27.7%
Other 24.3%
Racist/discriminatory practices 15.8%
Source: AIR calculations from December 2020 workforce survey.
Note: N = 150.
HOW TO IMPROVE SERVICES
Barriers to access varied somewhat by the type of
IN TULSA?
service), although transportation issues were a near
constant.7 Respondents who indicated that child care was Survey respondents (n = 132)
the least accessible service (n = 29), pointed to a lack of responded to an open-ended
transportation (100 percent, n = 29) and long wait times question about
recommendations to improve
for services (76 percent, n = 22) as the largest barriers.
services in Tulsa. The most
Staff who found legal services to be the least accessible common responses were as
(n = 23) reported that client concerns about their follows:
immigration status (70 percent, n = 16) and clients’ lack • Increase awareness of
of knowledge about available services (68 percent, community resources.
• Improve outreach to
n = 15) were the greatest barriers. Staff who said there
underserved communities
were barriers to adult mental health (n = 22) described • Develop marketing
transportation, ability to find childcare so that parents campaigns in multiple
can participate, and a lack of knowledge among clients languages
about available services as challenges (55 percent for • Improve service providers’
knowledge of available
each, n = 12). Lastly, for staff who selected housing as the services
biggest challenge (n = 26), long wait times (69 percent, • Improve transportation.
n = 18) and transportation (65 percent, n = 17) were the • Increase availability of
most significant barriers to access. affordable childcare,
housing, mental health, and
services to support basic
7 Exhibit A3 in the appendix for more details about the types of barriers. needs
AMERICAN INSTITUTES FOR RESEARCH® | AIR.ORG 172020 BEST Workforce Survey Report
Communication and Coordination
We also asked survey respondents to comment on their communication and coordination
efforts with other BEST partners. As shown in Exhibit 17, 57 percent of all staff responded that
they communicate with staff in other agencies. Thirty-eight percent of the staff were satisfied
with those communications, and another 19 percent were not satisfied.
Exhibit 17. Slightly fewer than half of staff communicate with other agencies; among those
who do, most are satisfied with their communications.
I communicate,
but am not
satisfied I do not
18.7 communicate
with other
agencies
43.4
I communicate and
am satisfied
37.9
Source: AIR calculations from December 2020 workforce survey.
Note: N = 206.
Staff reported on challenges they experience when coordinating services for clients with other
agencies (Exhibit 18). The most common challenge (cited by 43 percent of the survey
respondents) was that they did not have permission or authority to discuss clients with other
organizations, followed by a lack of time to coordinate services (21 percent).
Exhibit 18. Lack of authority to discuss clients with other organizations was the most common
challenge to cross-agency client coordination.
I do not have permission or authority to discuss clients with
42.5%
other organizations
I lack the time to coordinate services for clients with other
21.3%
organizations
Clients do not want me involved with the services they
12.6%
receive from other organizations
I do not think service coordination would help my clients 8.7%
Other 15.0%
Source: AIR calculations from December 2020 workforce survey.
Note: N = 206.
AMERICAN INSTITUTES FOR RESEARCH® | AIR.ORG 18You can also read