BIS Working Papers No 605
←
→
Page content transcription
If your browser does not render page correctly, please read the page content below
BIS Working Papers
No 605
Wage and price setting:
new evidence from
Uruguayan firms
by Fernando Borraz, Gerardo Licandro and Daniela Sola

Monetary and Economic Department

January 2017

A paper produced for the BIS Consultative Council for
the Americas 7th Research Conference “Inflation
dynamics: the role of labour markets, productivity and
globalization”, 19-20 May 2016, hosted by the Central
Reserve Bank of Peru.

JEL classification: E31, D40, J30, L16

Keywords: price setting, labor market, survey evidence,
Uruguay
BIS Working Papers are written by members of the Monetary and Economic
Department of the Bank for International Settlements, and from time to time by
other economists, and are published by the Bank. The papers are on subjects of
topical interest and are technical in character. The views expressed in them are
those of their authors and not necessarily the views of the BIS.

This publication is available on the BIS website (www.bis.org).

©   Bank for International Settlements 2017. All rights reserved. Brief excerpts may be
    reproduced or translated provided the source is stated.

ISSN 1020-0959 (print)
ISSN 1682-7678 (online)
Wage and Price Setting: New Evidence from
                     Uruguayan Firms*

       Fernando Borraz**, Gerardo Licandro*** and Daniela Sola****

                                       Abstract

This paper presents new evidence on wage and price setting based on a
survey of more than 300 Uruguayan firms in 2013. Most of the firms set
prices considering costs and adding a profit margin; therefore, they have
some degree of market power. The evidence indicates that price increases
appear quite flexible in Uruguay (prices are downward rigid). Most of the
firms adjust their prices without following a regular frequency which
suggests that price changes in Uruguay are state-dependent, although wage
changes are concentrated in January and July. Interestingly, the cost of
credit is seen by companies as an irrelevant factor in explaining price
increases. We also find that cost reduction is the principal strategy to
a negative demand shock. Finally, the adjustment of prices to changes in
wages is relatively fast.

Keywords: price setting, labor market, survey evidence, Uruguay

JEL Classification: E31, D40, J30, L16

*
 The opinions expressed in this document are the sole responsibility of
the authors and do not compromise nor represent the position of the
Banco Central del Uruguay. We are grateful to Charles Engel, Anna Orlik,
Santiago García Couto, Leandro Zipitría, seminar participants at the
Seventh BIS CCA Research Conference, Universidad ORT, Banco Central del
Uruguay, dECON and the 2013 Annual Meeting of the Central Bank
Researchers Network in Mexico City for their very constructive comments
and suggestions. All errors are ours.

**
  Corresponding author. Banco Central del Uruguay. Diagonal Fabini 777. Montevideo-Uruguay,
CP:11100. Email: fborraz@bcu.gub.uy.
***
      Banco Central del Uruguay.
****
       Universidad de Montevideo.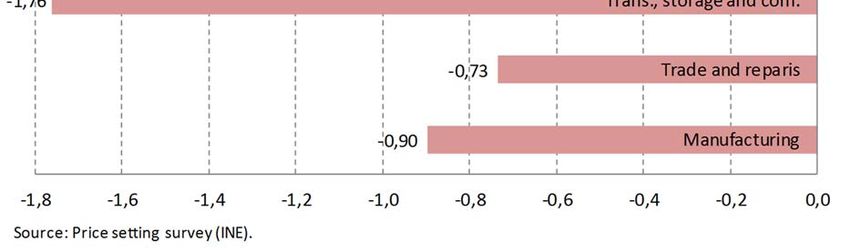
1. Introduction

In recent years there has been a large increase in the empirical literature
on price behavior. Following the work of Calvo (1983), Taylor (1980),
Fuerer and Moore (1995), among others, understanding the microstructure of
price setting allows us to better understand the way to fight price rigidity
and conduct a more efficient monetary and macroeconomic policy. As new and
detailed data sets become available, we observe a number of important
studies on the microeconomic fundamentals of price setting by firms -
mainly retailers - and their impact on inflation. This analysis allows a
better understanding of the behavior, dispersion, and volatility of prices.

However, there are few studies that analyze price setting from surveys that
directly    ask       companies      regarding       price      formation,   and     most   of    the
literature       is    concentrated       in    developed         countries.    In    Uruguay     in
particular, despite recent progress for the retail sector (Borraz and
Zipitría (2012)) and in wage formation (Fernández et. al. (2008)), there
is no direct evidence on company’s price formation strategies. In this
study we use a novel data set of a survey of 307 large Uruguayan firms on
price setting.

The purpose of this study is to present stylized facts about price setting
in Uruguay based on a survey of firms. This new evidence must be viewed as
a complement to the new literature on the topic in Latin America. However,
the principal objective of this study is to raise a number of unknown
questions    about      price       formation    for      future    research.     Therefore,      the
objective is to generate questions as well as answers that would be useful
for   monetary        policy    design    and        to   set    the   future   agenda      on    the
microeconomics of price setting. This study can be viewed as a first step
to generate a new approach to analyze monetary policy options in a small
open economy.

Our findings are as follows: i) prices in Uruguay seem to be more rigid
than in previous studies, ii) the frequency of price change is state
dependent, iii) the response of prices to wages is fast, iv) firms do not
have a clear view on how to respond to unanticipated demand shocks; (more
research    is    needed       to    understand       better     the   response      of   firms   to
unanticipated demand shocks), v) firms seem to pay more attention to wages
than their weight on the cost structure would justify, a puzzling behavior
that might be related to the way wage negotiations are conducted, vi) there
is a high degree of inertia in the manufacturing industry sector .

                                                 2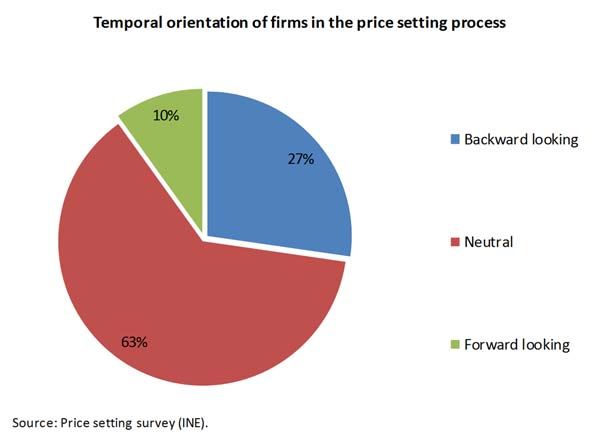
The rest of the paper proceeds as follows: Section 2 presents a brief
review of related literature, section 3 makes a brief description of the
data, section 4 presents the basic results of the survey and section 5
concludes.

     2. Related Literature

As mentioned above, the price setting literature based on company surveys
is scarce and most of it is concentrated on developed countries. Using
surveys to analyze price-setting behavior of firms was initiated by Blinder
(1991, 1994) in the US. In his pioneer work Blinder interviewed two hundred
firms directly regarding their price setting behavior to analyze the
validity of theories of sticky prices. He found that prices are sticky
with an average duration of three months following a shocks. The only
theory that was supported by firms’ responses was coordination failure.

In the case of Germany, Stahl (2005) finds that most of the manufacturing
firms have market power to set producer prices. Additionally, indexation
is minor. Babecký, Dybczak and Galuščák (2008) finds that in the Czech
Republic firms’ prices are less rigid than wages with a weak pass through
of wages to prices. They also find that in response to an unanticipated
demand shock, firms reduce temporary employment and non-labor costs.

For   fifteen   European   countries,    Druant   et.   al.   (2009)     find   a   close
relationship between wages and prices and between wages and the frequency
of price changes.

In the case of Canada, Amirault, Kwan and Wilkinson (2006), firms show a
wide variation in the frequency with which they adjust prices.              Almost 33%
of Canadian firms declare price adjustments once a year or less while a
similar portion adjust prices more than twelve times per year. Similar
studies   for   Swedish    firms   (Apel,    Firberg    and   Hallsten    (2001))     and
Portuguese firms (Martins (2006)) show that firms adjust their prices only
once a year. Canadian firms consider wage cost as a very important factor
to                                 increase                                     prices.

Greenslade and Miles Parker (2012) analyzed the case of the United Kingdom
asking companies directly how their prices behave. As with the studies
mentioned before, the median number of price changes was once per year. UK
firms were asked how prices were determined for their main product and the
explanations    that   most   of   the   firms   considered    most    important     were
competitors prices (68% of firms) and mark-up over costs (58% of firms).

                                         3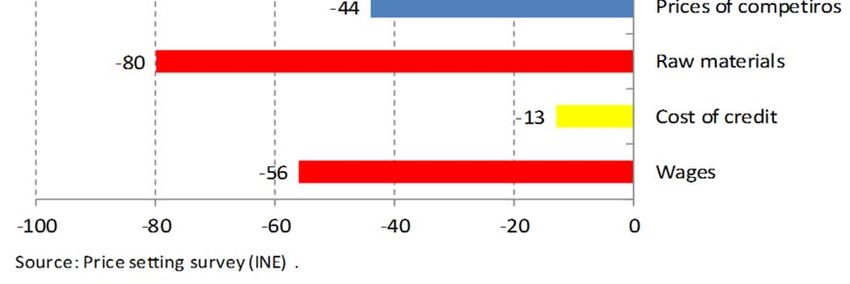
Another interesting result was that, in particular, labor costs and raw
materials were the most important cause of price rises, whilst lower demand
and    competitors’     prices         were   the     main   factors    resulting      in     price
reductions.

The study made by Apel, Friberg and Hallsten for Swedish firms also finds
that the median firm adjusts the price once a year. Another finding is
that    state-dependent         and     time-dependent         price   setting   are        equally
important. For Portuguese firms (Martins (2006)) it was found that more
than 30 % of total price changes are price decreases. Another important
finding is that the degree of price stickiness seems to be higher in the
service sector than in manufacturing.

In Latin America there are two studies based on firms’ responses. The first
one is Irregui et. al. (2011) analyze the link between wages and prices in
Colombia using a survey of firms. They find that firms adjust their wages
principally in the first quarter. They also find a stronger pass through
of wages to prices in labor intense sectors or sectors with high labor
productivity. The empirical evidence also suggests time-dependent price
changes are less common than time-dependent wage adjustments in Colombia.

Based on a survey of 7,002 Brazilian firms, Da Silva, Petrassi and Santos
(2016) find that prices are sticky, the cost of reviewing prices, state-
dependent price setting and markup pricing.

        3. Data

Our    study   is    based    on   a    survey   that    was    conducted   by   the    National
Statistical Office of Uruguay (Instituto Nacional de Estadística, INE) in
agreement with the Central Bank of Uruguay (Banco Central del Uruguay, BCU)
in February 2013 on the basis of a sample covering all economic sectors
with           the           exception           of          the        public              sector.
The firms were selected using stratified random sampling. The stratification
was made according to the number of employees (from 50 to 99; 100 to 199;
200 or more) and the economic sector of the firm. Therefore, only firms
with 50 or more employees are in the sample. The survey was sent to 630
firms by traditional mail. A reminder was sent to those firms that had not
responded. At the end, 363 valid questionnaires were received (a response
rate of 58%). If a firm did not respond, it was not substituted in order
to avoid skewing of results. Instead the weights were reestablished.

                                                 4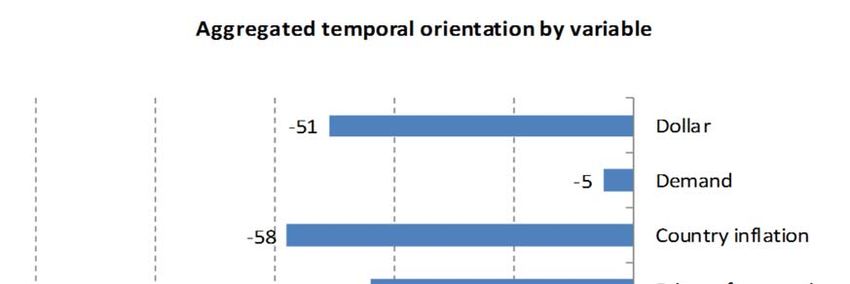
In order to have more information about the firms we merge this survey
with the yearly Economic Activity Survey, EAS (Encuesta de Actividad
Económica) conducted by INE. The EAS contains information about sales,
investments, and labor force and cost structure for Uruguayan firms. The
survey is conducted among all private and state-owned firms which operate
in Uruguay with 5 or more employees. As a result of the merger of the two
samples    we    end   up   with   a    sample    of   307   firms.   Figure    1   shows   the
distribution of firms by sector of activity.

  4. Empirical Results

This section presents the main results of the analysis of the survey on
price setting practices in Uruguayan firms. We present the data without
the weights both because of a very uneven non-response rate among sectors
and because their use does not change the results.

4.1   Price setting behavior

4.1.1 Market microstructure and price setting.

We asked firms what their strategy was for setting prices. Figure 2a shows
that the majority of firms, regardless of sector, set their price with a
mark-up over costs, which would indicate the prevalence of imperfect
competition. This is a result that is usually found in the literature (Da
Siva, Pretrassi and Santos (2016), Irregui et. al. (2011) and Stahl
(2005)).    Also, the only economic sector that does not set their price
with a profit margin is the transport sector, which has their prices
regulated by the Government (Figure 2b).                The price setting based on cost
and a mark-up is highest in the trade and other business sectors. As
expected,       manufacturing      is   the   sector    with   the    highest   exposure    to
international competition.

In Figure 2c we analyze price setting within manufacturing. Cost and mark
up price setting is predominant in heavy industry.                    This sector also has
the lowest exposure to international competition. This result reflects the
high participation of heavily protected industries. Other manufacturing
sub sectors tend to find the international price more important as a
reference for price setting, probably as a result of lower redundant
protection. If we consider domestic and international competition, the sub
sectors that show a higher exposure to it are food and wood, both basic
export commodities in the case of Uruguay (60% and 67% of firms respond to
competition). Since the main export of goods from Uruguay are those
produced by the food sector, the lower response to competition the sector

                                              5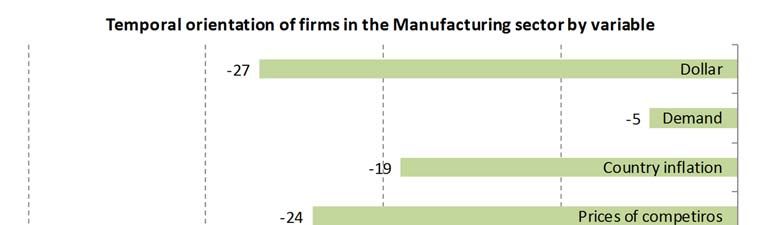
shows compared to wood, which is puzzling in principle and deserves further
research, might be related to market segmentation in some strategically
important food components.1 Overall, the high percentage of firms that
follow non competitive practices might be related to the trade protection
structure.

4.1.2. Frequency of price adjustment

Analyzing the frequency of price changes, Figure 3 indicates that 40% of
firms do not have a regular frequency and in 30% the adjustments are
semiannual. This result, based on a survey of producer and consumer firms,
suggests that prices are more rigid than in the findings of Borraz and
Zipitría (2012). They find that the median duration of prices in food,
beverages and personal products in the retail sector is approximately two
and a half months. The large proportion of firms claiming not to have a
regular frequency of price adjustment might indicate that price adjustment
opportunities arise in a random way, as in Calvo (1983). This result comes
in stark contrast to the relatively large importance given to wages in the
price formation process, particularly when wages, since Uruguay returned
to centralized wage negotiations, are adjusted mostly twice a year in
January and July. It would be important to compare the wage adjustment in
the sectors and the claimed frequency of price setting.                        As mention before,
Swedish (Mikael Apel et. al. - 2001), Spanish (Luis J. Álvarez et. al. -
2004), United Kingdom (Miles Parker et. al 2012) and Portuguese (Fernando
Martins -2006) firms adjust their prices only once a year which shows a
difference in the frequency with which Uruguayan firms adjust their prices.

Our results suggest more frequent price adjustment than in Blinder’s survey
(1994) in the US. However, at the time of the survey, inflation was 8.9%
annually in Uruguay, but at the time of Blinder’s paper was 3% annually in
the US. Because the pressure to change prices is lower in a low inflation
environment, the difference in the inflation levels between US and Uruguay
can explain the discrepancy in the results.

Table 1 analyzes the correlation between the frequency of price change and
employment (in thousands) and sector of activity. The dependent variable
is a discrete one with values from 1 (weekly prices changes) to 7 (no
regular pattern). Surprisingly, the results show a negative correlation
between price rigidity and employment. However, this correlation becomes

1 The Uruguayan government has special regimes for some food commodities that have an important share
of the consumption basket of the population.

                                                 6
positive at the employment level of four thousand.      Additionally, once we
control for employment, we do not find a significant correlation between
the frequency of price changes and the sector of activity.         This evidence
seems to suggest that the frequency of price change in Uruguay is state
dependent. This is consistent with Borraz and Zipitría (2012) who find that
the empirical evidence seems to point to state-dependent models as the main
explanation for the inflation phenomenon in Uruguay

Firms stated conduct in terms of seasonality of price adjustment is barely
consistent with the marked seasonality of inflation observed in the data.
In this sample most firms do not declare to have a clear pattern of seasonal
price adjustment.

Only 29% of firms (see Figure 4), mostly transport and real estate sectors,
declare that they change their price in a particularly month. The other
firms do not concentrate their price changes at a specific time of the
year. The percentage of firms that do not change prices in a particular
month ranges from 50% for transport and communications and others business
to 97% for the trade sector. For the manufacturing industry the response
is 82%. Not surprisingly, the most important months for price adjustment
are January and July, which coincide with the dates of adjustments of most
of the sectors in the Wages Councils (Figure 5).

4.2   Factors Affecting Pricing

Figure 6 indicates that wages and raw material prices are the most relevant
factors for firms increasing their prices. In all the different economic
sectors salary was ranked as a very important factor to determine a change
in the main product price. The study of Canadian firms also ranks wage
costs as a very important factor in determining a change in price, whereas
the   study   of    Swedish   firms       ranks   it   as   less      important.
The economic sectors that consider the price of raw materials more relevant
are manufacturing industry and the trade sector.

Since raw materials include a large proportion of commodities, it is also
puzzling that the exchange rate plays a lesser role than wages. Ex ante,
in a small open economy like Uruguay in which most raw materials are
tradables, it would be reasonable to think that firms would find equally
important changes in the value of raw materials and the dollar. Other
factor that would support a large role for the dollar lies in a past of
high inflation in which indexation, particularly to the dollar was a
regular practice. The lack of importance of the dollar in price formation

                                      7
could then be the result of lower indexation due to inflation stabilization
and a floating exchange rate. This stylized fact is consistent with the
fall in persistence in inflation documented in Ganón (2012) among others.
Another interesting finding obtained from the survey is that finance costs
do not affect prices in any economic sector. This might reflect the fact
that Uruguayan firms show relatively low levels of banking credit (see BCU
(2013)). Other factors that do not have an important influence in the price
of any economic sector are the price of competitors, the price of the
dollar and demand. Considering that firms set their price with a mark-up
we believe it is reasonable that they do not take into account the price
of their competitors.
Inflation is a factor that is considered very important for transport and
real estate firms at the time of changing prices. On the other hand,
manufacturing industry and the trade sector do not consider it significant.
A striking fact is the high importance given by employers to wages to
determine price increases. The high importance of wages in price formation
contrasts with the relatively low participation of wages in the cost
structure. As can be seen in Table 2 the weight of wages on total cost
averages less than 20 % while raw materials are close to 60%. One can think
that this is a strategic behavior by firms because of the existence of
Wage Councils that mandate wage negotiations between the employers,
employees and the government. Therefore, it is possible that firms
overweight the importance of wages to increase prices. In order to check
this, we compare the firm’s response with the true structure of costs from
INE for the manufacturing sector. If that is the case, this large importance
of wages would be an indication of the role of aggregate demand in price
formation. As wages are adjusted at the same time, firms know that the
dates of wage increases (January and July) are points in which aggregate
demand would jump in response to the increase in household income. The
contingency analysis indicates that the correlation between the perceived
importance of wages and the share of wages in total cost is positive and
significant but it is far away from perfect.2
Additionally, because price setting is costly and price are changed
frequently when inflation is 8.9% (inflation in Uruguay when the survey
was taken), it probably makes sense to adjust prices based on less than
full information. Therefore, wage may play an important role because they
2 Results available upon request.
8may provide information about costs, demand inflation and the state of the
economy.
4.3 Forward and Backward Looking Behavior
One very important question regarding price formation is the relative role
of backward and forward looking factors. Most short term macro models are
based on the existence of a Phillips curve that takes into account both
past and expected fundamentals. To shed some light into how the usual logic
of monetary models fits the behavior of Uruguayan firms we compare the
importance they give to the same fundamentals in past and expected terms.
Surprisingly enough, firms assign the same importance to past and future
values of fundamentals as can be seen in Figure 7. This result is of
paramount importance for the prospects of inflation targeting, since they
suggest that if the Central Bank generates credibility in the conduct of
monetary policy, the cost of stabilizing inflation expectation would go
down significantly.
To analyze the time orientation of firms regarding different fundamental
values in the margin, we construct a very simple statistic of Time
Orientation
Where z indicates the fundamental value to be valued (wages, credit, etc.),
the superscript indicates time orientation (f-future, p-past), i, indicates
firm, and j sector.
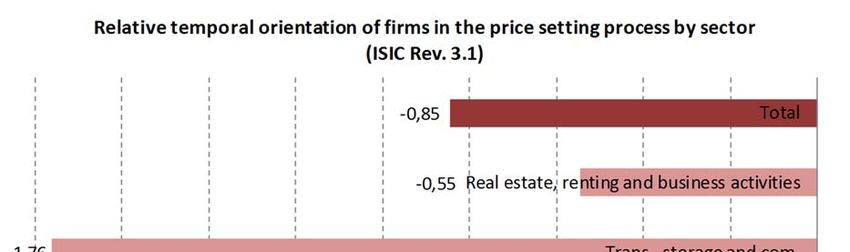
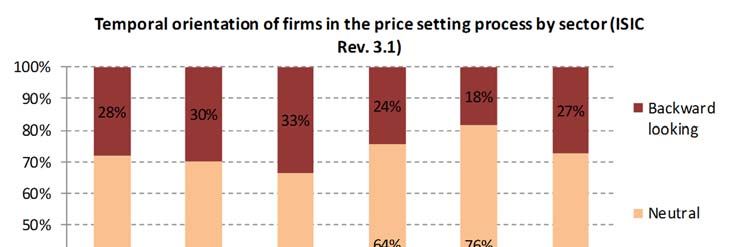
Looking at Figure 8a we can see that while firms are largely neutral in
the aggregate, they do not always give the same importance in every
fundamental, showing in the margin a slight backward looking orientation.
9When we open the time orientation statistic by fundamental, we observe that
the most important fundamentals in price setting, namely raw materials and
wages, are the ones that favor marginally past behavior the most (Figures
8a). When we look at which sectors are forward or backward looking in the
margin (Figure 8b), we observe even when we consider firms as units, the
neutrality result holds true in the aggregate. Figures 9a and 9b reports
the following version of the time orientation indicator
We compute this statistic for every firm, and the figure shows the
composition of firms in terms of the sign of their time orientation. Notice
that in order to classify a firm as forward or backward looking we only
need for the firm to give a different valuation of importance in the case
of one fundamental. Since we have already documented the neutrality of
firms in the aggregate, this is only a marginal indication of time
orientation. With this in mind, we see that most firms are neutral in the
margin as well, with the lowest and highest levels of neutrality reported
in the Trade & repairs and Other business sectors, respectively. In all
sectors there are more backward looking firms than forward looking ones,
with the highest incidence of backward looking orientation in the
Transport, storage and communication sector with 33%, and the lowest in
the Other business sector with 18%. The highest presence of forward looking
firms occurs in Trade and Repairs, and the lowest in the Other business
sectors.
Since manufacturing is the sector in which we have more data, we can see
the time orientation of the sector in terms of each fundamental. Figure 9b
shows that the marginal time orientation of manufacturing firms is backward
looking as well.
4.4 Prices and Wages
We study the speed of price adjustment after an increase in salaries in
Figure 10. Firms were asked to report the average time between the increase
of salaries and the corresponding price reaction. Almost 60% of the firms
declared adjustment of their prices very quickly (less than one month to
three months). Approximately 22% of firms declared no increase in prices
and absorbed the costs of the salaries. This result casts doubt regarding
some of the responses. These types of answer turn on an alert signal for
10the analysis of surveys of firms. The design of the surveys should capture
these contradictions in the answers.
The fact that we previously find that firms do not have a regular schedule
to setting their prices is not contradictory with this fast pass trough of
wages to prices. Maybe is a matter of how the firms’ managers interpreted
the survey. The firms do not have a calendar date for changing prices,
but, they can anticipate that the prices will need to be changed after
wage negotiations. Therefore, prices are not really reset that often, but
firms do respond quickly because they can anticipate wage changes.
4.5 Firms reaction to an unexpected demand shock
The majority of firms, when faced with a decrease in demand, tend to
reduce their costs (Figure 11). Another reaction is to disseminate the
mark-up they generate, although when they have a decrease in demand they
do not decrease their prices or their production. Alike Blinder (1994),
we find that firms response is not symmetric to demand or supply shocks
or to negative or positive shocks.
Table 3 presents the contingency analysis of the correlation between the
different strategies of firms to a demand shock. Suspiciously there is a
highly significant positive correlation between two opposite strategies
like price increases and prices reductions. This can be explained by the
fact that both strategies are not relevant at all for the firms under a
negative demand shock. This result suggests a certain amount of price
rigidity.
We find that the optimal response of the firm to a negative demand shock
is not just one but a mix of strategies such as reduction of costs and
margins and to some extent production.
5. Conclusions
This study provides new insights into price setting in a small economy
like Uruguay based on a survey of firms. The results indicate that prices
are more rigid than previously thought and indicate a relative low degree
of competition in the markets.
11Firms stated conduct in terms of seasonality of price adjustment is barely
consistent with the marked seasonality of inflation observed in the data.
In this sample most firms do not declare to have a clear pattern of seasonal
price adjustment.
Another puzzle we find in the data is the large importance they give to
wages in price adjustment, which stands in stark contrast with the
relatively low participation of wages in costs. This could be an indication
that firms anticipate aggregate demand pressures through the behavior of
wages. Also, wages may play a larger role because they may provide
information about the state of the economy.
There is also a blunt contrast between the high importance given to raw
materials and the dollar in price formation. This could then be the result
of lower indexation due to inflation stabilization and a floating exchange
rate. This stylized fact is consistent with the fall in persistence in
inflation documented in Ganón (2012) among others.
Another encouraging find for monetary policy management is that firms seem
to give the same importance to the past and expected behavior of
fundamentals in price formation. The higher the role of expected factors,
the more active the expectations channel of monetary policy is.
Finally, the firms’ main response to a negative demand shock seems to be
to lower costs (raise productivity).
126. References
Apel, M. , Firberg, R. and Hallsten, K. (2005) “Microfoundations of
Macroeconomic Price Adjustment: Survey Evidence from Swedish Firms” Journal
of Money, Credit and Banking, Vol. 37:2 pp. 313-338
Amirault, D., Kwan, C. and Wilkinson, G. (2006). “Survey of Price-Setting
Behaviour of Canadian Companies,” Bank of Canada WP 035.
Babecký, J., Dybczak, K., Galuščák, K., (2008). “Survey on Wage and Price
Formation of Czech Firms,” Czech National Bank, Working Paper Series,12,
December.
Borraz, F., and Zipitría, L. (2012). “Retail Price Setting in Uruguay,”
Economia, 12(2), 77–109.
Blinder, A. (1991). “Why are Prices Sticky? Preliminary Results from an
Interview study,” American Economic Review, 81(2), 89-100.
Blinder, A. (1994). “On Sticky Prices: Academic Theories Meet the Real
World” in Monetary Policy, Edited by Gregory Mankiw, The University of
Chicago Press, 117-154.
Calvo, G. A. (1983). “Staggered Prices in a Utility-Maximizing
Framework,” Journal of Monetary Economics 12 (3): 383–98.
Da Silva, A., Petrassi, B. and Santos, R. (2016). “Price-Setting Behavior
in Brazil: Survey Evidence,” Banco Central de Brasil, Working Paper 422.
Druant, M., Fabiani, S., Kezdi, G., Lamo, A., Martins, F., Sabbatini, R.,
(2009). “How are Firms’ Wages and Prices Linked: Survey Evidence in
Europe,” Working Paper 174, National Bank of Belgium.
Fernández, A., Lanilotta, B., Mazzuchi, G. and Perera, J.M. (2008). “La
Negociación Colectiva en Uruguay” Análisis y Alternativas,” Centro de
Investigaciones Económicas and Programa de Modernización de las Relaciones
Laborales, Universidad Católica del Uruguay.
Ganon, Elena. (2012). “Persistencia de la inflación en Uruguay” Banco
Central del Uruguay, Working Paper 13.
13Greenslade, J. and Parker, M. (2012). “New Insights Into Price-Setting
Behaviour In The UK: Introduction And Survey Results”
Irregui, A.M, Melo, L. and Ramiréz, M. (2011). “Wage Adjustment Practices
and the Link between Price and Wages: Survey Evidence from Colombian
Firms,” Borradores de Economía Nr. 660, Banco de la República, Colombia.
Fuhrer, J. and Moore, G. (1995). “Inflation Persistence,” The Quarterly
Journal of Economics 110 (1): 127-159.
Marques, C.R., Martins, F., Portugal, P., (2010). “Price and Wage Formation
in Portugal,” European Central Bank, Working Paper Series 1225.
Martins, F. (2005). “The Price Setting Behaviour of Portuguese Firms
Evidence from Survey Data, ” European Central Bank, Working Paper Series
562.
Stahl, H. (2005). “Price Setting in German Manufacturing: New Evidence from
New Survey Data,” Discussion Paper Series 1: Economic Studies No 43.
Deutsche Bundesbank.
Silverman, B. W. (1986). Density Estimation for Statistics and Data
Analysis. Chapman & Hall.
Taylor, J. B. (1980). “Staggered Wage and Price Setting in
Macroeconomics.” Journal of Political Economy 88 (1): 1–23.
14Figures
Figure 1. Sample Distribution by Sector (in %)
50
45
40
35
30
25
20
15
10
5
0
n
es
er
s
s
lth
ts
n
n
l
ai
ie
rie
io
io
io
an
at
iti
t
a
s tr
at
ct
re
at
ar
w
he
iv
ur
ic
tru
uc
du
qu
d
t
nd
sta
un
ac
d
an
Ed
in
ns
an
d
a
re
m
ss
an
Co
le
g
as
s
m
e
nd
rin
sa
ce
,g
sin
es
co
le
sa
vi
tu
in
ty
bu
ho
d
er
ac
el
m
ci
an
s
W
uf
ot
d
tri
of
al
an
ge
H
an
ec
ci
n
ra
e,
M
El
So
tio
sto
t
sta
ta
oi
n,
al
pl
t io
Re
Ex
ta
or
sp
an
Tr
Figure 2a. Pricing of the Firm's Main Product (in %)
60
50
40
30
20
10
0
Regulated Headquarters Main Buyer Following competitors Cost and Profit Margin International Price
15Figure 2b. Pricing of Firm's Main Product by Sector (in %)
80
70
60
50
40
30
20
10
0
Regulated Headquarters Main Buyer Following competitors Cost and Profit Margin International Price
Manufacturing Trade Trans. and Commu. Other Business
Figure 2c. Price Setting in the Manufacturing Industry by Subsector (in %)
80
70
60
50
40
30
20
10
0
Regulated Headquarters Main Buyer Following competitors Cost and Profit Margin International Price
Food Textil Wood Equipment
16Figure 3. Frequency of Price Adjustmetn (in %)
45
40
35
30
25
20
15
10
5
0
Daily Weekly Monthly Quarterly Half-year Yearly No Regular
Frequency
Figure 4. Are Price Changes Concentrated in a Particular Month?
29%
71%
No Yes
17Figure 5. Price Changes by Month (in %)
80
70
60
50
40
30
20
10
0
January February March April May June July August September October November December No Regular
Frequency
Figure 6. Factors Determining Price Increases (Median Response)
1=Not Relevant, 5=Very Relevant
4
3
2
1
0
Wages Credit Inputs Competitors Price Inflation Demand Exchange Rate
18Figure 7.
Figure 8a.
19Figure 8b.
Figure 9a.
20Figure 9b.
Figure 10. Months to Adjust Prices when Wages Change
(In %)
30
25
20
15
10
5
0
Less than 1 Between 1 and 3 Between 3 and 6 More than 6 There is No Change in Prices
21Figure 11. Firms Reaction to an Unexpected Sales Fall
1=Not Relevant, 5=Very Relevant
4
3
2
1
0
Raise Prices Cut Prices Lower Margins Reduce Production Reduce Costs
Tables
Table 1. Multinomial Logit Model
Frequency of Price Change. Marginal Effects
Exploratory Variables Coeff. / S.E.
Employment -0.0012**
(0.0005)
Employment2 0.0003*
(0.0002)
Manufacturing 0.0318
(0.0442)
Trade 0.0246
(0.0363)
Other Business -0.0001
(0.0001)
Education -0.0000
(0.0001)
Minning -0.0001
(0.0001)
Health 0.0006
(0.0006)
Observations 307
Robust Standard Errors in Parentheses
** pTable 2. Cost Structure by CIIU Classification (in %)
Sector CIIU Raw Excedent Wages Others
Beef 1511 82.3 1.7 5.9 10.1
Dairy 1520 60.3 4.3 17.1 18.3
Tanneries 1911 72.4 1.8 7.5 18.2
Ricemills 1534 67.9 2.2 7.3 22.7
Textiles 1711-13 66.6 2.9 16.2 14.3
Rubber and Plastic 2519-20 62.4 3.6 17.6 16.4
Fish 1512 60.2 3.0 21.3 15.6
Malt 1553 55.8 2.8 18.8 22.6
Basic Metal 2700 42.6 6.4 19.3 31.7
Automotive 3400 66.3 2.3 16.0 15.4
Wood 2010-2021 55.8 3.7 31.7 8.8
Basic Chemical 2411-12 70.8 2.0 14.1 13.1
Pesticides 2421 67.0 2.0 13.4 17.6
Pharmaceutical 2423 54.9 0.5 26.1 18.5
Cleaning 2424 55.3 0.5 15.8 28.4
Paints and other Plastics 2422 68.7 0.6 12.4 18.3
Clothing 1810 61.2 3.0 13.7 22.1
Tobacco 1600 44.7 0.9 21.3 33.1
Medical Instruments 3300 41.8 1.8 19.0 37.5
Other Textiles 1720-30 57.4 3.5 19.7 19.4
Glass 2610 42.6 7.9 27.8 21.8
Fruits and Vegetables 1513 43.4 4.0 14.1 38.5
Electrical Appliances 3100 50.8 1.5 39.4 8.3
Furniture 3610 59.7 2.8 18.7 18.8
Source: 2010 Annual Economic Activity Survey, INE.
Table 3: Firms Reaction to Unexpected Sale Shock
Pearson chi2(25) : Contingency tables
Raise Prices Cut Prices Lower Margins Reduce Production Reduce Costs
Raise Prices 1.50E+03 382,943 337,789 360,909 319,444
Cut Prices 382,943 1.50E+03 468,933 380,467 340,909
Lower Margins 337,789 468,933 1.50E+03 348,577 333,218
Reduce Production 360,909 380,467 348,577 1.50E+03 337,997
Reduce Costs 319,444 340,909 333,218 337,997 1.50E+03
Pr = 0.000
23Survey Questionnaire
1) How do you set the price of the main product?
a. The price is regulated
b. The price is set in the central office abroad
c. The Price is set by the main buyer
d. The Price is set following competitors
e. The price is set according to costs and a profit margin
f. The price is set following the international price
2) Under normal conditions: ¿How often does your company change the price
of the main product’
a. Daily
b. Weekly
c. Monthly
d. Quarterly
e. Every six months
f. Yearly
g. There is no regular frequency
3) Under normal conditions: Are price changes concentrated in a
particular month?
a. No
b. Si. Write month/s
4) What is the relevance of the following factors to explain price
increases? Grade from 1 (not relevant) to 5 (very relevant)
a. Wage increases
b. Cost of credit increases
c. Input price increases
d. Competitors’ price increase
e. Inflation increases
24f. Demand increases
h. US dollar exchange rate increases
5) What is the relevance of the following factors to explain price
increases? Grade from 1 (not relevant) to 5 (very relevant)
a. Expected wage increases
b. Expected cost of credit increases
c. Expected input price increases
d. Expected competitors’ price increase
e. Expected inflation increases
f. Expected demand increases
h. Expected US dollar exchange rate increases
6) How long does it take to adjust prices after a wage change?
a. Less than a month
b. Between one and three months
c. Between three and six months
d. More than six months
e. The firm does not raise prices and absorbs the increase in wages
7) What is your firm response to an unexpected drop in sales? Grade from
1 (not relevant) to 5 (very relevant)
1. Increase prices
2. Reduce prices
2. Reduce margin
3. Reduce production
4. Reduce costs
25Previous volumes in this series
No Title Author
604 Endogenous wage indexation and aggregate Julio A. Carrillo, Gert Peersman and
January 2017 shocks Joris Wauters
603 Multiplex interbank networks and systemic Iñaki Aldasoro, Iván Alves
January 2017 importance – An application to European
data
602 The globalisation of inflation: the growing Raphael Auer, Claudio Borio and
January 2017 importance of global value chains Andrew Filardo
601 Asymmetric information and the Ugo Albertazzi, Margherita Bottero,
January 2017 securitization of SME loans Leonardo Gambacorta and Steven
Ongena
600 The currency dimension of the bank lending Előd Takáts and Judit Temesvary
December 2016 channel in international monetary
transmission
599 Banking Industry Dynamics and Size- Tirupam Goel
December 2016 Dependent Capital Regulation
598 Did the founding of the Federal Reserve Mark Carlson and David C
December 2016 affect the vulnerability of the interbank Wheelock
system to contagion risk?
597 Bank Networks: Contagion, Systemic Risk and Iñaki Aldasoro, Domenico Delli
December 2016 Prudential Policy Gatti, Ester Faia
596 Macroeconomics of bank capital and liquidity Frédéric Boissay and Fabrice
December 2016 regulations Collard
595 Bank lending and loan quality: the case of Pallavi Chavan and Leonardo
December 2016 India Gambacorta
594 A quantitative case for leaning against the Andrew Filardo and Phurichai
December 2016 wind Rungcharoenkitkul
593 The countercyclical capital buffer and the Raphael Auer and Steven Ongena
December 2016 composition of bank lending
592 The dollar, bank leverage and the deviation Stefan Avdjiev, Wenxin Du,
November 2016 from covered interest parity Catherine Koch and Hyun Song
Shin
591 Adding it all up: the macroeconomic impact Ingo Fender and Ulf Lewrick
November 2016 of Basel III and outstanding reform issues
590 The failure of covered interest parity: FX Vladyslav Sushko, Claudio Borio,
October 2016 hedging demand and costly balance sheets Robert McCauley and Patrick
McGuire
589 International prudential policy spillovers: a Stefan Avdjiev, Cathérine Koch,
October 2016 global perspective Patrick McGuire and Goetz von
Peter
All volumes are available on our website www.bis.org.You can also read