BLACK CARBON HEALTH EFFECTS OF - 100 50 0,5
←
→
Page content transcription
If your browser does not render page correctly, please read the page content below

%
     100

     50

      0

           0,5   2,5   3,5

HEALTH EFFECTS OF
BLACK CARBON
Health effects of
         black carbon

                           By:
Nicole AH Janssen, Miriam E Gerlofs-Nijland, Timo Lanki,
   Raimo O Salonen, Flemming Cassee, Gerard Hoek,
   Paul Fischer, Bert Brunekreef, Michal Krzyzanowski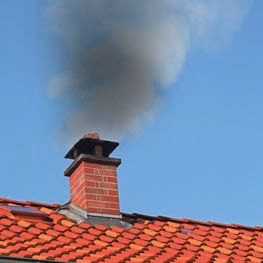
The WHO European Centre for Environment and Health, Bonn, WHO Regional Office for Europe,
                                          coordinated the development of this publication.

                                                         ABSTRACT
           This report presents the results of a systematic review of evidence of the health effects of black carbon
           (BC). Short-term epidemiological studies provide sufficient evidence of an association of daily variations in
           BC concentrations with short-term changes in health (all-cause and cardiovascular mortality, and
           cardiopulmonary hospital admissions). Cohort studies provide sufficient evidence of associations of all-
           cause and cardiopulmonary mortality with long-term average BC exposure. Studies of short-term health
           effects suggest that BC is a better indicator of harmful particulate substances from combustion sources
           (especially traffic) than undifferentiated particulate matter (PM) mass, but the evidence for the relative
           strength of association from long-term studies is inconclusive. The review of the results of all available
           toxicological studies suggested that BC may not be a major directly toxic component of fine PM, but it may
           operate as a universal carrier of a wide variety of chemicals of varying toxicity to the lungs, the body’s
           major defence cells and possibly the systemic blood circulation. A reduction in exposure to PM 2.5 containing
           BC and other combustion-related PM material for which BC is an indirect indicator should lead to a
           reduction in the health effects associated with PM.

                                                Keywords

                                                AIR POLLUTION – adverse effects
                                                SOOT – toxicity
                                                INHALATION EXPOSURE – adverse effects
                                                PARTICULATE MATTER – analysis
                                                RISK ASSESSMENT

ISBN: 978 92 890 0265 3

Address requests about publications of the WHO Regional Office for Europe to:
               Publications
               WHO Regional Office for Europe
               Scherfigsvej 8
               DK–2100 Copenhagen Ø, Denmark
Alternatively, complete an online request form for documentation, health information, or for permission to quote or translate, on the
Regional Office web site (http://www.euro.who.int/pubrequest).
© World Health Organization 2012
All rights reserved. The Regional Office for Europe of the World Health Organization welcomes requests for permission to
reproduce or translate its publications, in part or in full.
The designations employed and the presentation of the material in this publication do not imply the expression of any opinion
whatsoever on the part of the World Health Organization concerning the legal status of any country, territory, city or area or
of its authorities, or concerning the delimitation of its frontiers or boundaries. Dotted lines on maps represent approximate
border lines for which there may not yet be full agreement.
The mention of specific companies or of certain manufacturers’ products does not imply that they are endorsed or
recommended by the World Health Organization in preference to others of a similar nature that are not mentioned. Errors and
omissions excepted, the names of proprietary products are distinguished by initial capital letters.
All reasonable precautions have been taken by the World Health Organization to verify the information contained in this
publication. However, the published material is being distributed without warranty of any kind, either express or implied. The
responsibility for the interpretation and use of the material lies with the reader. In no event shall the World Health Organization
be liable for damages arising from its use. The views expressed by authors, editors, or expert groups do not necessarily
represent the decisions or the stated policy of the World Health Organization.

Edited by: Rosemary Bohr. Cover design: Dagmar Bengs.
Pictures: axepe, Imaginis, Ingo Bartussek, Jeanette Dietl, Kalle Kolodziej, mozZz, think4photop (Fotolia.com).
Printed by: WarlichDruck RheinAhr GmbH.
CONTENTS

                                                                                                                                Page
Acknowledgements............................................................................................................ iv

Abbreviations ..................................................................................................................... v

Executive summary ........................................................................................................... vii

Introduction ....................................................................................................................... 1
        References ................................................................................................................ 3

1.      Metrics used to estimate the exposure to BC in health studies:
         strengths and weaknesses ........................................................................................ 4
        Introduction .............................................................................................................. 4
        Measurement methods of the dark component of PM .................................................... 5
        Comparison of the optical measurement methods with each other
         and with more sophisticated methods ........................................................................ 6
        Conclusions ............................................................................................................. 10
        References .............................................................................................................. 11
2.      Assessment of exposure to BC in epidemiological studies ............................................ 13
        Short-term exposures ............................................................................................... 13
        Long-term exposures ............................................................................................... 16
        Conclusions ............................................................................................................. 19
        References .............................................................................................................. 20
3.      Effects of BC exposure observed in epidemiological studies ......................................... 23
        Results .................................................................................................................... 24
        Discussion ............................................................................................................... 30
        References .............................................................................................................. 33
4.      Evidence from toxicology, including human clinical studies .......................................... 37
        Introduction ............................................................................................................ 37
        Adverse health effects of BC in the controlled human exposure experiments ................. 41
        Mechanisms of toxicity ............................................................................................. 45
        Conclusions ............................................................................................................. 46
        References .............................................................................................................. 46
Annex 1. Literature search criteria ..................................................................................... 51

Annex 2. Contributors to the report.................................................................................... 55

Annex 3. Supplementary material to the review of epidemiological studies ............................ 57
Health effects of black carbon page iv Acknowledgements This report was prepared by the Joint World Health Organization (WHO)/Convention Task Force on Health Aspects of Air Pollution according to the Memorandum of Understanding between the United Nations Economic Commission for Europe and the WHO Regional Office for Europe. The Regional Office thanks the Swiss Federal Office for the Environment for its financial support of the work of the Task Force. The Task Force on Health work is coordinated by the WHO European Centre for Environment and Health, Bonn. Convention on Long-range Transboundary Air Pollution
Health effects of black carbon
                                                                                         page v

Abbreviations
Abs      absorbance
BC       black carbon
BCP      black carbon particles
BS       black smoke
CVD      cardiovascular disease
DE       diesel engine exhaust
EC       elemental carbon
IQR      inter-quartile range
NIOSH    National Institute for Occupational Safety and Health
OC       organic carbon
PAH      polycyclic aromatic hydrocarbons
PM       particulate matter
POM      particulate organic matter
RSS      rice-straw smoke
RR       relative risk
TOR      thermal optical reflectance
TOT      thermal optical transmittance
UFP      ultrafine particles
Health effects of black carbon
page vii
Executive summary1
Following decision 2010/2 of the Executive Body for the Convention on Long-range
Transboundary Air Pollution (ECE/EB.AIR/106/Add.1, para 8(b)(i)), the Task Force on Health
Aspects of Air Pollution working under the Convention conducted an assessment of the health
effects of black carbon (BC) as a component of fine particulate matter (PM2.5). The Task Force’s
discussion focused on formulating the conclusions presented below, on the basis of the working
papers prepared for it and comments received from external reviewers.
BC is an operationally defined term which describes carbon as measured by light absorption. As
such, it is not the same as elemental carbon (EC), which is usually monitored with thermal-
optical methods. Current measurement methods for BC and EC need to be standardized so as to
facilitate comparison between the results of various studies. The main sources of BC are
combustion engines (especially diesel), residential burning of wood and coal, power stations
using heavy oil or coal, field burning of agricultural wastes, as well as forest and vegetation fires.
Consequently, BC is a universal indicator of a variable mixture of particulate material from a
large variety of combustion sources and, when measured in the atmosphere, it is always
associated with other substances from combustion sources, such as organic compounds. The
spatial variation of BC is greater than that of PM2.5. Although, in general, ambient measurements
or model estimates of BC reflect personal exposures reasonably well and with similar precision
as for PM2.5, the differences in exposure assessment errors may vary between studies and
possibly affect estimates of risk.
The systematic review of the available time-series studies, as well as information from panel
studies, provides sufficient evidence of an association of short-term (daily) variations in BC
concentrations with short-term changes in health (all-cause and cardiovascular mortality, and
cardiopulmonary hospital admissions). Cohort studies provide sufficient evidence of associations
of all-cause and cardiopulmonary mortality with long-term average BC exposure.
Health outcomes associated with exposure to PM2.5 or thoracic particles (PM10) are usually also
associated with BC (and vice versa) in the epidemiological studies reviewed. Effects estimates
(from both short- and long-term studies) are much higher for BC compared to PM10 and PM2.5
when the particulate measures are expressed per unit of mass concentration (µg/m3). Effect
estimates are, however, generally similar per inter-quartile range in pollutant levels. Studies of
short-term health effects show that the associations with BC are more robust than those with
PM2.5 or PM10, suggesting that BC is a better indicator of harmful particulate substances from
combustion sources (especially traffic) than undifferentiated PM mass. In multi-pollutant models
used in these studies, the BC effect estimates are robust to adjustment for PM mass, whereas PM
mass effect estimates decreased considerably after adjustment for BC. The evidence from long-
term studies is inconclusive: in one of the two available cohort studies, using multi-pollutant
models in the analysis, the effect estimates for BC are stronger than those for sulfates, but an
opposite order in the strength of relationship is suggested in the other study.
1
Also published as part of Effects of air pollution on health. Report of the Joint Task Force on Health Aspects of Air
Pollution (2011). Geneva, United Nations Economic and Social Council (ECE/EB.AIR/WG.1/2011/11) (http://
www.unece.org/fileadmin/DAM/env/ documents/2011/eb/wge/ece.eb.air.wg.1.2011.11.pdf, accessed 12 December
2011).Health effects of black carbon page viii There are not enough clinical or toxicological studies to allow an evaluation of the qualitative differences between the health effects of exposure to BC or to PM mass (for example, different health outcomes), of quantitative comparison of the strength of the associations or of identification of any distinctive mechanism of BC effects. The review of the results of all available toxicological studies suggested that BC (measured as EC) may not be a major directly toxic component of fine PM, but it may operate as a universal carrier of a wide variety of, especially, combustion-derived chemical constituents of varying toxicity to sensitive targets in the human body such as the lungs, the body’s major defence cells and possibly the systemic blood circulation. The Task Force on Health agreed that a reduction in exposure to PM2.5 containing BC and other combustion-related PM material for which BC is an indirect indicator should lead to a reduction in the health effects associated with PM. The Task Force recommended that PM2.5 should continue to be used as the primary metric in quantifying human exposure to PM and the health effects of such exposure, and for predicting the benefits of exposure reduction measures. The use of BC as an additional indicator may be useful in evaluating local action aimed at reducing the population’s exposure to combustion PM (for example, from motorized traffic).
Health effects of black carbon
                                                                                                  page 1

Introduction
The health effects of combustion-related air pollution indicated by black particles were identified
decades ago, when the monitoring of black smoke (or “British smoke” – BS) was a widespread
method for air quality assessment in Europe. The evidence about the health effects of this
pollution was used to recommend the first guidelines for exposure limits (then) consistent with
the protection of public health (WHO, 1979). In the 1990s, BS was one of the indicators of air
quality used, for example, in European time-series studies linking mortality with pollution
(Katsouyanni et al., 2001). A recognition of the difficulties in standardizing BS measurements
and an appreciation of the health effects of the non-black components of particulate matter (PM)
attracted the attention of researchers and regulators to the mass concentration of inhalable or
respirable fractions of suspended PM such as PM10 and PM2.5 (WHO Regional Office for
Europe, 2000). BS is not addressed by air quality regulations and the intensity of BS monitoring
has decreased.

New scientific evidence has led to a recognition of the significant role of black particles (black
carbon – BC) as one of the short-lived climate forcers. Measures focused on BC and methane are
expected to achieve a significant short-term reduction in global warming. If they were to be
implemented immediately, together with measures to reduce CO2 emissions, the chances of
keeping the earth’s temperature increase to less than 2 °C relative to pre-industrial levels would
be greatly improved (UNEP, 2011). The same measures would also directly benefit global health
and food security.

The synergy between action to address global warming and air quality has been noted by the
parties to the Convention on Long-range Transboundary Air Pollution. Taking into account the
conclusions of the report of the Ad Hoc Expert Group on Black Carbon (UNECE, 2010a), the
Executive Body of the Convention decided to include consideration of BC, as a component of
PM, in the revision process of the 1999 Gothenburg Protocol to Abate Acidification,
Eutrophication and Ground-level Ozone (Gothenburg Protocol) (UNECE, 2010b). The Executive
Body also requested the Joint Task Force on the Health Aspects of Air Pollution (the Task Force
on Health) to look at the adverse effects on human health of black carbon as a component of
PM2.5.

There is still no systematic comparison of health effects estimated using PM versus BC
indicators. A WHO working group has acknowledged that the evidence on the hazardous nature
of combustion-related PM (from both mobile and stationary sources) was more consistent than
that for PM from other sources (WHO Regional Office for Europe, 2007). Grahame &
Schlesinger (2010) reviewed the evidence of the effects of BC on cardiovascular health
endpoints and concluded that it may be desirable to promulgate a BC PM2.5 standard.
Conversely, Smith et al. (2009) noted that although the results of their time-series meta-analysis
suggest greater effects per unit mass of sulfate than BS, this distinction was less clear in the few
studies that directly compared the estimated effects of both indicators. This indicates the need for
a critical comparison of studies that have measured PM mass as well as BC particles.

In response to the request from the Executive Body of the Convention, and in view of the lack of
a systematic review of the accumulated evidence on the health effects of BC, the Task Force on
Health launched the review by addressing the following specific questions.
Health effects of black carbon
page 2
1. What metrics have been used to estimate the health effects of exposure to BC?
a. What are their respective strengths and weaknesses?
b. How is personal exposure related to ambient levels?
2. What are the effects of BC exposure observed in epidemiological studies (health outcomes,
exposure/response function)?
a. What are the effects of short-term exposure?
b. What are the effects of long-term exposure?
c. Are they different qualitatively (for example, different health outcomes) and/or
quantitatively from the effects of:
i. PM2.5 mass concentration
ii. other measured components of PM2.5?
3. What are the effects of BC in the human controlled exposure experiments? Are they
different qualitatively (for example, different health outcomes) and/or quantitatively from
the effects of:
a. PM2.5 mass concentration
b. other measured components of PM2.5?
4. What are the mechanisms of the effects of BC indicated by toxicological studies?
a. Are they different from the mechanisms of effects attributed to undifferentiated PM2.5
mass concentrations or other measured components of PM2.5?
b. Is there evidence supporting the thesis that (some of) the mechanisms are specific for
BC?
Leading the Task Force on Health, WHO invited selected experts to prepare concise background
papers summarizing evidence corresponding to each of the above questions. The experts signed
the WHO declaration of interest, assuring the absence of any conflicts of interests related to their
contributions to the assessment. The papers were based on a systematic review of the literature,
with relevant documentation of the protocol of the review and of the evidence reviewed (see
Annex 1).
The conclusions of the review were prepared by WHO and the authors of the background papers
based on the papers. The summary also rated the quality of the evidence supporting each
conclusion based on the approach used in the WHO Indoor air quality guidelines (WHO
Regional Office for Europe, 2010, p 6). Both the papers and the summary were subject to review
by another group of experts, and their comments were made available to all members of the Task
Force on Health in advance of the 14th Task Force Meeting, held in Bonn on 12–13 May 2011
(list of participants in Annex 2). The discussion at the Meeting focused on finalizing the
summary assessment, which has been published in the Task Force Report (UNECE, 2011). This
summary also forms the Executive Summary of this report.
The background papers presented in this report were revised after the Task Force Meeting, based
on the comments of the reviewers before and at the Meeting.Health effects of black carbon
page 3
References
Grahame TJ, Schlesinger RB (2010). Cardiovascular health and particulate vehicular emissions: a critical
evaluation of the evidence. Air Quality, Atmosphere and Health, 1:3–27.
Katsouyanni K et al. (2001). Confounding and effect modification in the short-term effects of ambient
particles on total mortality: results from 29 European cities within APHEA2 project. Epidemiology, 12:
521–531.
Smith KR et al. (2009). Public health benefits of strategies to reduce greenhouse-gas emissions: health
implications of short-lived greenhouse pollutants. Lancet, 74:2091–2103.
UNECE (2010a). Black carbon. Report by the co-chairs of the ad-hoc expert group on black carbon.
Geneva, United Nations Economic and Social Council (ECE/EB.AIR/2010/7Corr.1) (http://www.unece.
org/fileadmin/DAM/env/documents/2010/eb/eb/ece.eb.air.2010.7.corr.1.e.pdf, accessed 5 January 2012).
UNECE (2010b). Report of the Executive Body on its twenty-eighth session. Addendum. Decisions
adopted at the twenty-eighth session. Geneva, United Nations Economic and Social Council
(ECE/EB.AIR/106/Add.1) (http://www.unece.org/fileadmin/DAM/env/documents/2010/eb/eb/ece.eb.air.
106.add.1.e.pdf, accessed 5 January 2012).
UNECE (2011). Effects of air pollution on health. Report of the Joint Task Force on Health Aspects of Air
Pollution. Geneva, United Nations Economic and Social Council (ECE/EB.AIR/WG.1/2011/11)
(http://www.unece.org/fileadmin/DAM/env/documents/2011/eb/wge/ece.eb.air.wg.1.2011.11.pdf, accessed
12 December 2011).
UNEP (2011). Integrated assessment of black carbon and tropospheric ozone. Summary for decision
makers. Nairobi, United Nations Environment Programme (http://www.unep.org/dewa/Portals/67/pdf/
BlackCarbon_SDM.pdf, accessed 5 January 2012).
WHO (1979). Sulfur oxides and suspended particulate matter. Geneva, World Health Organization
(Environmental Health Criteria, No. 8).
WHO Regional Office for Europe (2000). Chapter 7.3. Particulate matter. In: Air quality guidelines for
Europe, 2nd ed. Copenhagen, WHO Regional Office for Europe (CD ROM version) (http://www.euro.
who.int/__data/assets/pdf_file/0019/123085/AQG2ndEd_7_3Particulate–matter.pdf, accessed 5 January
2012).
WHO Regional Office for Europe (2007). Health relevance of particulate matter from various sources.
Report on a WHO workshop. Copenhagen, WHO Regional Office for Europe (http://www.euro.who.
int/__data/assets/pdf_file/0007/78658/E90672.pdf, accessed 5 January 2012).
WHO Regional Office for Europe (2010). Indoor air quality guidelines: selected pollutants. Copenhagen,
WHO Regional Office for Europe (http://www.euro.who.int/__data/assets/pdf_file/0009/128169/e94535.
pdf, accessed 5 January 2012).Health effects of black carbon
page 4
1. Metrics used to estimate the exposure to BC in health
studies: strengths and weaknesses
Raimo O Salonen
Introduction
There are several types of measurement method and commercial instrument available for
continuous, semi-continuous and integrated filter sample-based optical and thermal-optical
measurements of aerosol parameters reflecting combustion-derived char, soot, black carbon or
elemental carbon contents in PM. The concentrations of these carbonaceous material are low or
moderate (close to source) in atmospheric PM, and much higher in emissions from common
combustion sources (diesel engines, power plants or ship engines using heavy oil, or small
residential heaters using wood or other biomass).
The following are explanations of the bolded terms in common language according to Han et al.
(2007; 2010).
Char is defined as carbonaceous material obtained by heating organic substances and
formed directly from pyrolysis, or as an impure form of graphitic carbon obtained as a
residue when carbonaceous material is partially burned or heated with limited access of air
(typical of burning vegetation and wood in small residential heaters).
Soot is defined as only those carbon particles that form at high temperature via gas-phase
processes (typical of diesel engines).
Black carbon (BC) refers to the dark, light-absorbing components of aerosols that contain
two forms of elemental carbon.
Elemental carbon (EC) in atmospheric PM derived from a variety of combustion sources
contains the two forms “char-EC” (the original graphite-like structure of natural carbon
partly preserved, brownish colour) and “soot-EC” (the original structure of natural carbon
not preserved, black colour) with different chemical and physical properties and different
optical light-absorbing properties.
A thermal optical reflectance method can be applied to differentiate between char-EC and soot-EC
according to a stepwise thermal evolutional oxidation of different proportions of carbon under
different temperatures and atmosphere (more details under Measurement methods of the dark
component of PM, below). The health significance of the separate char-EC and soot-EC is not
known. In general, EC or BC are regarded as having negligible toxic effects on human and animal
lungs in controlled studies and on airway cells such as macrophages and respiratory epithelial cells.
Instead, it has been suggested that they exert an indirect key role in toxicity as a universal carrier of
toxic semi-volatile organics and other compounds co-released in combustion processes or attached
to their surface during regional and long-range transport (see Chapter 4).
The optimal combustion of fuel at high temperature, such as the current low-sulfur fossil diesel
fuel in modern diesel engines, results in the emission of large numbers of very small soot
particles (aerodynamic diameter 1–5 nm) that rapidly grow in size (10–100 nm) in the tailpipe by
coagulation to form aggregated chains, and further by condensation of the simultaneously
released semi-volatile organic substances on their surfaces in the atmosphere. The speed of
growth depends on air temperature, sunlight, concomitant oxidants, etc. (D’Anna, 2009).Health effects of black carbon
page 5
The burning of solid fuels, such as wood and coal, is usually not optimal, especially in small
residential heaters, since there is, to a varying degree, incomplete smouldering combustion due
to the relative shortage of oxygen. Subsequently, the aerodynamic diameter of emitted PM in
flue gas becomes larger (150–600 nm) than in the case of diesel oil combustion in car engines,
because in addition to thermochemically-formed EC there are incompletely burnt tar-like
organics attached to it. As with diesel car PM, these emitted PM continue to grow in the
atmosphere by condensation of semi-volatile organics on their surface. The combustion of solid
fuels, such as wood and coal, tends to produce much larger amounts of semi-volatile organics
than combustion of low-sulfur diesel oil (Naeher et al., 2007; Kocbach Bolling et al., 2009).
While ageing in the atmosphere for several hours or days, the combustion-derived particles become
even larger (up to 1 µm in diameter) because inorganic salts originating from both NO2 and SO2,
together with atmospheric water, attach to the surfaces of hygroscopic carbonaceous particles.
Taking into account the wide variations in the formation and composition of combustion-derived
PM, and the fact that some of its chemical composition is known to exert not only light-absorbing
(soot/BC/EC) but also considerable light-scattering (organics, inorganics) properties, it is no
surprise that many indirect optical measurement techniques and thermal optical analysis methods,
which have been used for many years in air quality measurements by aerosol and by health
scientists, have proved to give only a rough proxy of the BC or EC concentration in ambient air
without instrument-specific corrective measures. Some methods have also had instrument-specific
technical problems during operation in large methodological inter-comparison studies conducted
by the leading aerosol scientists in Asia, Europe and the United States (Müller et al., 2011; Chow
et al., 2009; Reisinger et al., 2008; Kanaya et al., 2008; Hitzenberger et al., 2006).
Measurement methods of the dark component of PM
Combustion-derived soot and char (in practice, their dark components) have been determined in
epidemiological studies by the following techniques:
light reflectance from (absorbance (Abs), BS) or light transmission through (basis of
measurement of BC) integrated PM samples usually collected at 24-hour intervals on thin
cellulose fibre filter or other filter material, followed by conversion of the optical
measurement units to mass-based units;
real-time photometers measuring light absorption of PM sample spots (BC) at 1–5 minute
intervals and automatically giving readings in mass-based units;
chemical determination of EC and organic carbon (OC) using thermal optical analysis
methods either semi-continuously with mass-based readings given every 30 minutes to
3 hours, or from integrated PM samples collected at 24-hour intervals on quartz filters
(Müller et al., 2011; Janssen et al., 2011; Chow et al., 2009).
The absorption coefficient of PM and BS measured with a reflectometer and BC measured with
an optical transmissometer are metrics that are based on the blackness of aerosol material
collected on a filter. Light is focused on the filter sample and the amount of light reflected or
transmitted is measured. For BS and Abs, the amount of reflected light is converted into PM
mass units (OECD standard) (OECD, 1964) or the black smoke index ISO standard 9835:1993
(ISO, 1993), whereas in the BC method the light transmitted is converted to represent the mass
of EC. BS measurement has been used in Europe since the 1920s, when urban air pollution was
dominated in many places by smoke from coal combustion. Although BS and Abs
determinations are expressed in µg/m3, there is no clear relationship to PM mass, as conversionHealth effects of black carbon page 6 of the optical measurement results into mass units depends on location, season and type of combustion particle. Absorption photometers for real-time application have been available since the 1980s. These are filter-based instruments that measure at intervals of one to five minutes the changes in transmittance through a fibrous filter tape as particles are deposited. The complex relationship between changes in light transmission and aerosol absorption and scattering on the filter requires an adequate calibration of these methods, including the selection of an effective wavelength for a valid absorption co-efficient, determination of filter spot size and characterization of the aerosol flow (Müller et al., 2011). Algorithms have been published for correcting artefactual enhancement of light absorption by filter-loading, back-scattering, and multiple scattering caused by PM and the filter matrix in connection with aethalometers and particle soot absorption photometers. The multi-angle absorption photometer is the only real-time absorption photometer that corrects for these artefacts by design (Müller et al., 2011; Chow et al., 2009) (Table 1). Thermal optical methods are based on OC and EC removed from sampling substrates (such as quartz-fibre filter) by volatilization and/or combustion at selected temperatures, and by conversion of the released gases to carbon dioxide (CO 2) or methane (CH4). This is followed by infrared absorption (CO 2) or flame ionization (CH 4) detection. EC is not volatile and is only released by oxidation. Most of the atmospheric OC tends to evolve at temperatures ≤550 C in pure helium atmosphere and, thus, it can be separated from EC that needs to be oxidized in helium 98%/oxygen 2% at temperatures 550 C. Heating in an inert helium atmosphere, however, causes certain OC compounds to pyrolyse or char, thereby exaggerating the atmospheric EC in the sample. In thermal optical carbon analysis, this can be corrected by simultaneous measurement of thermal optical reflectance (TOR) or thermal optical transmittance (TOT). Although the principles of thermal methods appear to be similar, they contain variations with respect to: location of the temperature monitor (thermocouple) relative to the sample, analysis atmospheres and temperature ramping rates; temperature plateaus; residence time at each plateau; optical pyrolysis monitoring configuration; carrier gas flow through or across the sample; and oven flushing conditions. Chow et al. (2005; 2009) and Han et al. (2007; 2010) have done a lot of development and comparisons of thermal optical methods. Currently, their Interagency Monitoring of Protected Visual Environments (IMPROVE_A) thermal optical reflectance protocol (IMPROVE_A_TOR) seems the best thermal optical method for separating various OC fractions from each other as well as for separating char-EC from soot-EC (Table 1). Comparison of the optical measurement methods with each other and with more sophisticated methods BS/PM10 ratios measured with the reflectometer have varied widely in Europe and many times exceeded one in some locations (Hoek et al., 1997), as the Abs units are converted to BS values in µg/m3 by using a constant conversion factor. This is a major source of bias, because the greatly varying OC/EC ratio in PM affects Abs due to scattering of light from combustion-type organic material. A typical OC/EC ratio in urban traffic environments is two, while the OC/EC ratio can be five in rural background areas with more prevalent biomass combustion. Thus, BS data from different types of site or from different seasons or from decade-long time-series at the same site are not comparable. BS measurement should always be accompanied by local calibration of the conversion factor from Abs units to BS values in µg/m3 on the basis of the OC/EC ratio in PM (Schaap & Denier van der Gon, 2007).
Health effects of black carbon
                                                                                                                    page 7

            Table 1. Summary of methodological aspects in relation to measurement of light Abs,
                                   BS, BC or EC in atmospheric PM

  PM metrics         General information              Methodological principle               Strengths and limitations

PM Abs, BS,         Reflectometer. Collect-      Reflectometer. Analogue or digital       Reflectometer.    Standardized,
BC. Cheap and       ion of usually 24-hour       readout     of   either   percentage     traditional and cheap method;
simple meas-        PM       samples     on      reflectance       (linear      scale,    long time-series in several
urements from       Whatman paper filter at      recommended range 35–95%) or             central    European   countries
integrated filter   sampling flow volume         absorption coefficient (logarithmic      according to the OECD (1964)
                                      3
samples             of     2±0.2    m /day,      scale, recommended range 0.64–           specifications.
                                                               -5
                    absorption coefficient       13.13 × 10 ) that can be trans-
                    measured from PM on          formed into a BS index (ISO 9835,        Baseline reflectance of unused
                    filter   using   simple      1993). According to the OECD             filters may vary from batch to
                    reflectometer consist-       standard (1964), there is a              batch. Scattering of light from
                    ing of a light source        conversion of the reflectance data       PM sample rich in organics or
                    and a detector (ISO
                                                                              3
                                                 into gravimetric units (µg/m ). The      due to some inorganics results in
                    9835:1993 (E)). Origin-      same has been done with absorption       biased reflectance values.
                    ally, there was an           by using a fixed conversion factor:            2
                                                                                          BS (R =0.82–0.93) and absorp-
                    OECD standard (1964)         1 unit of Abs equals an increase of              2
                                                                                          tion (R =0.85-0.98) methods
                                                          3
                    for BS measurement           10 µg/m BS (Roorda-Knape et al.,         have had high correlations with
                    from total suspended         1998).                                   thermal optical EC, but the
                    particulate samples.                                                  slopes of the association show
                                                 Optical transmissometer. The OT-21                                       3
                    Optical transmissome-        is based on the optics used in some      wide variations (BS 10 µg/m
                                                                                                                         3
                    ter. This portable inst-     aethalometer models. It measures         equals    EC       0.5–1.8 µg/m )
                    rument can perform           the transmission intensity of light at   (Janssen et al., 2011).
                    rapid, non-destructive       880 nm and 370 nm passing through        A study in the Netherlands
                    BC determination from        a       particle-loaded  filter   and    showed that BS readings
                    PM material collected        determines the attenuation of light      depended on the OC/EC ratio in
                    on different types of        compared to the intensity of a blank                    2
                                                                                          ambient air (r =0.85 for urban
                    filter (diameter 25 mm,      filter.                                             2
                                                                                          sites and r =0.75 for rural sites)
                    37 mm or 47mm). The                                                   and the slopes of association
                    instrument       has    a                                             varied   with    the   type     of
                    movable tray with two                                                 measurement site and local
                    filter-holder slots, one                                              combustion sources (Schaap &
                    inside and the other                                                  Denier van der Gon, 2007).
                    outside. The outside
                    holder is used to                                                     Optical transmissometer. The
                    measure light attenu-                                                 results obtained from three
                    ation      through    the                                             different types of site in the
                    sample filter, while a                                                United States (New York State)
                    simultaneous measure-                                                 and one site in Turkey showed
                    ment is made through                                                  that the relationships between
                    the reference (blank)                                                 BC values obtained from the OT-
                    filter placed in the                                                  21 and thermal optical BC
                    inside      holder.  The                                              values from a semi-continuous
                    analysis time for an                                                  carbon analyser were linear. The
                    individual      measure-                                              slopes for the data from the sites
                                                                                                                          2
                    ment is less than                                                     varied from 0.75 to 1.02 (r =
                    one minute.                                                           0.44 to 0.88), which was mainly
                                                                                          attributed to the different chem-
                                                                                          ical composition of aerosols as
                                                                                          well as their age in the
                                                                                          atmosphere. When the data
                                                                                          were combined and plotted as
                                                                                          monthly average BC, the two
                                                                                          methods      showed      excellent
                                                                                                                     2
                                                                                          agreement (slope 0.91, r =0.84)
                                                                                          (Ahmed et al., 2009).
BC. Absorption      Real-time     absorption     Aethalometer (Hansen, Rosen &            Unit-to-unit variability between
photometers for     photometers.       Filter-   Novakov, 1984). Offered in different     similar instruments. Up to 30%
real-time appli-    based        instruments     configurations. Multispectral (370–      for PSAPs and aethalometers,
cation (avera-      measure the change of        950 nm)     absorption    coefficients   while less than 5% for multi-
geing time 1–5      transmittance through a      provide    insight   into   chemical     angle absorption photometers.
minutes).           fibrous filter tape as       composition in PM sample. PM             Reasons for the high variability
Health effects of black carbon
page 8
PM metrics General information Methodological principle Strengths and limitations
particles are deposited. collection on quartz-fibre filter tape, were identified as variations in
The complex relation- flow rate 6.7 litres/ minute and sample flow and spot size and
ship between change in averaging time 5 minutes. as cross-sensitivity to PM
light transmission and scattering (Müller et al., 2011).
aerosol absorption and Particle soot absorption photometers
scattering on the filter (Bond, Anderson & Campbell, 1999). Correlations in absorption co-
requires a calibration of Absorption coefficients measured at efficients between different
these methods (effect- variable wavelengths (467–660 nm). instruments. Particle soot absor-
tive wavelength for Dependence of response on PM ption photometers versus multi-
valid absorption co- size and cross-sensitivity to particle angle absorption photometers
efficient, determination scattering that can be controlled by (R2=0.96–0.99), aethalometers
of filter spot size, simultaneously measured nephelo- versus multi-angle absorption
aerosol flow character- meter data. PM collection on glass- photometers (R2=0.96) (Muller
ization) (Muller et al., fibre filter tape, typical flow rate 0.5– et al., 2011). In a campaign in
2011). Published algo- 1 litre/minute and averaging time 3 the United States (Fresno super-
rithms for correction of seconds. site), agreement in BC between
artefactual enhance- corrected aethalometers (660 nm)
Multi-angle absorption photometers and multi-angle absorption photo-
ment of light absorption (Petzold & Schonlinner, 2004).
by filter-loading, back- meters (670 nm) was within 1%.
Measures radiation transmitted BC concentrations determined
scattering and multiple through and scattered back from a
scattering by PM and with the semi-continuous carbon
PM-loaded filter. A two-stream analyser were highly correlated
the filter matrix in radiative transfer model used to
connection with aetha- (R≥0.93) but were 47% and 49%
minimize the cross-sensitivity to lower than BC measured with
lometers and particle particle scattering. Usual emission at
soot absorption photo- aethalometers and multi-angle
wavelength 670 nm. PM collection absorption photometers, respect-
meters. Multi-angle ab- on glass-fibre filter tape, flow rate
sorption photometers ively (Chow et al., 2009). Ele-
16.7 litres/minute. Minimum detect- vated BC-to-EC ratios with multi-
correct by design for ion limit as specified by the
these artefacts (Muller 3 angle absorption photometers
manufacturer is BCHealth effects of black carbon
page 9
PM metrics General information Methodological principle Strengths and limitations
lated (R≥0.95) with photoacous-
tic instrument data (Chow et al.,
2009).
Comparison with thermal optical
methods. The average differ-
ences between BC
concentration by adjusted 7-AE
(660 nm) and multi-angle ab-
sorption photometers (670 nm)
versus EC concentration by
IMPROVE_A_TOR were 0 and
6%, respectively. The BC
analysed by semi-continuous
carbon analyser using the
National Institute for Occupa-
tional Safety and Health
(NIOSH) 5040_TOT protocol
(660 nm) was 47% lower than
the EC analysed by
IMPROVE_A_TOR. In all
comparisons, correlations were
r≥0.87 (Chow et al., 2009).
Comparisons IMPROVE_A_TOR/TOT IMPROVE_A_TOR/TOT. The evol- IMPROVE_A_TOR/TOT. The
between protocol. PM collected ved carbon is converted to CO2 and residence time (150–580
EC/OC thermal on a quartz-fibre filter reduced to CH4 that is detected using seconds) at each temperature
optical methods at ambient temperature a flame ionization detector. Pure plateau in the IMPROVE_A
and pressure is subject helium is used as the carrier gas in protocol is flexible to achieve
to thermal carbon stepwise rising temperatures from well-defined carbon fractions,
analysis following the 30C to 550 C or 580 C to separate and depends on when the flame
IMPROVE_A protocol various OC fractions from each other. ionization detector signal returns
using the DRI Model The separation of various EC to the baseline (Chow et al.,
2001 thermal/optical fractions from each other is done in 2005; 2009).
carbon analyser. The helium 98%/oxygen 2% at temp-
correction for pyrolysed STN TOR/TOT and NIOSH
eratures from 550 C or 580 C to
OC is done by mon- 5040_TOT. The STN protocol
800 C or 840 C: char-EC sepa-
itoring laser reflec- has short and fixed residence
rated from soot-EC at around 700 C times (45–120 seconds), as
tance (TOR) or laser or 740 C (Chow et al., 2009; Han et
transmittance (TOT). does the NIOSH 5040 protocol
al., 2007; Chow et al., 2005). Reports (30–120 seconds) for each
STN TOR/TOT protocol. 24-hour concentrations of EC and OC temperature plateau. They
PM collection the same (including their sub-fractions), total cannot, therefore, report distin-
as above. Thermal/opti- carbon and PM light absorption. guishable carbon fractions.
cal transmission/reflec-
STN TOR/TOT. Pure helium is used Comparison between thermal
tance analysis applied
as the carrier gas in stepwise rising optical protocols. In the Fresno
to the US PM2.5.
temperatures from 30 C to 900 C supersite study, 24-hour EC
Speciation Trends Net- to separate various OC fractions. concentration by TOR was 23%
work (STN). Filter Helium 98%/oxygen 2% is applied to higher than EC by TOT following
transmittance is moni- EC fractions at temperatures from the IMPROVE_A protocol, and
tored to split OC and 600 C to 920 C. Reports 24-hour 29% higher following the STN
EC (STN_TOT). With concentrations of EC, OC and total protocol. These differences were
the DRI Model 2001 carbon. smaller when TOR was used to
thermal/optical carbon determine the OC/EC split. EC
analyser, reflectance Semi-continuous carbon analyser_ by STN_TOR was 10% lower
can also be recorded TOT. Evolved CO2 is analysed by than by IMPROVE_A_TOR.
during the analyses the non-dispersive infrared sensor. NIOSH 5040_TOT of the semi-
(STN_TOR). In the NIOSH 5040 protocol. Pure continuous carbon analyser
helium is used as the carrier gas in gave 45% lower integrated
Semi-continuous car- stepwise rising temperatures from 24-hour EC concentration than
bon analyser_TOT. PM 30 C to 840 C for various OC frac- that by IMPROVE_A_TOR. In all
collected on the quartz tions. Helium 98%/oxygen 2% is cases, the pairwise correlations
fibre filter tape is applied to EC fractions at tempe- were r≥0.87 (Chow et al., 2009).Health effects of black carbon
page 10
PM metrics General information Methodological principle Strengths and limitations
subjected to thermal ratures from 550 C to 850 C. Laser
optical analysis fol- transmittance (TOT) is used to
lowing the NIOSH correct for pyrolysis. During the PM
5040_TOT protocol. collection phase, light transmission
Typical flow rate 8.5 through the filter is monitored to
litres/minute and aver- quantify BC similarly to aethalo-
aging time 1 hour. meters. All measurements at
Used as a field instru- 660 nm. Reports 1-hour concen-
ment for air quality and trations of BC, EC, OC and total
health studies. carbon for ambient conditions.
The variability in the chemical composition of BC aerosol at different locations also biases the
BC data of optical transmissometers. It has been suggested that these should be calibrated with
the help of more sophisticated and reliable measurement techniques using statistically significant
numbers of samples for the specific sites (Ahmed et al., 2009). As with reflectometers, however,
controlling the measurement bias by local calibrations may not be easy, because the OC/EC ratio
in PM can also vary with the season and with day-to-day temperatures at the same site due to
variations in biomass combustion for residential heating.
Aerosol scientists have produced valuable information about the type and quantity of sources of
measurement error in relation to absorption photometers for real-time application (Müller et al.,
2011; Chow et al., 2009; Reisinger et al., 2008; Kanaya et al., 2008; Hitzenberger et al., 2006).
In fact, the use of filter-based instruments to derive information on aerosol light Abs and BC is a
matter of debate (Müller et al., 2011), as is the use of older optical measurements of BS and Abs
(see Janssen et al., 2011). Currently, there is no generally accepted standard method to measure
BC or EC. It has, however, been possible to make comparisons of several filter-based
instruments of aerosol light Abs with more sophisticated instruments such as the photoacoustic
analyser (Chow et al., 2009).
Several workshops have been conducted to investigate the performance of individual
instruments, for example, two workshops with large sets of aerosol absorption photometers in
2005 and 2007. The data from these instruments have been corrected using existing methods, but
still the most recent inter-comparison has shown relatively broad variations in responses to PM
light absorption in connection with some instruments (Müller et al., 2011). Significant biases
associated with filter-based measurements of PM light absorption, BC and EC are method-
specific. Correction of these biases must take into account the variations in aerosol
concentration, composition and sources (Chow et al., 2009).
The key results from the comparisons of the real-time optical measurement methods with each
other and with more sophisticated methods of measuring BC and EC, and from the comparisons
of BS and Abs with EC (Janssen et al., 2011) are summarized in Table 1. The literature search
and the criteria for selection of the literature cited are described in Annex 1.
Conclusions
BC is an operationally defined term, which describes carbon as measured by light absorption. As
such, it is not the same as EC, which is usually monitored with thermal-optical methods. Despite
intensive efforts during the past 20 years, there are no generally accepted standard methods to
measure BC or EC in atmospheric aerosol. While most of the measurement methods of BC orHealth effects of black carbon
page 11
EC seem to be well-correlated, biases in filter-based light absorption and thermal optical carbon
measurements need to be identified and corrected for accurate determination of aerosol light
absorption, BC and EC in different environments. Variations in the OC/EC ratio bias filter-based
PM light absorption in addition to other artefacts. The multi-angle absorption photometer is
currently the only type of real-time absorption photometer that corrects for these biases and
artefacts of BC measurement by design. However, aethalometer data can be corrected using
published algorithms. The IMPROVE_A protocol in thermal optical carbon analyser, equipped
with laser reflectance (TOR) to correct for pyrolysed OC, currently seems to be the most reliable
method to measure OC and EC concentrations from atmospheric PM in integrated filter samples.
The flexible residence time (150–580 seconds) at each temperature plateau also enables the
measurement of well-defined OC and EC sub-fractions, which may be useful in PM source
analysis. At their best in a field campaign, the 24-hour concentrations of BC by multi-angle
absorption photometer and from corrected aethalometer data have been nearly equal to the
24-hour EC concentration measured by IMPROVE_A_TOR. Current methods of measuring BC
and EC need standardization to facilitate comparison between various study results.
References
Ahmed T et al. (2009). Measurement of black carbon (BC) by an optical method and a thermal-optical
method: intercomparison for four sites. Atmospheric Environment, 43(40):6305–6311.
Arnott WP et al. (1999). Photoacoustic spectrometer for measuring light absorption by aerosol:
instrument description. Atmospheric Environment, 33:2845–2852.
Bond TC, Anderson TL, Campbell D (1999). Calibration and intercomparison of filter-based
measurements of visible light absorption by aerosols. Aerosol Science and Technology, 30:582–600.
Chow JC et al. (2005). Refining temperature measures in thermal/optical carbon analysis. Atmospheric
Chemistry and Physics, 5(4):2961–2972.
Chow JC et al. (2009). Aerosol light absorption, black carbon, and elemental carbon at the Fresno
Supersite, California. Atmospheric Research, 93:874–887.
D’Anna A (2009). Combustion-formed nanoparticles. Proceedings of the Combustion Institute, 32:593–
613.
Han YM et al. (2007). Evaluation of the thermal/optical reflectance method for discrimination between
char- and soot-EC. Chemosphere, 69:569–574.
Han YM et al. (2010). Different characteristics of char and soot in the atmosphere and their ratio as an
indicator for source identification in Xi’an, China. Atmospheric Chemistry and Physics, 10:595–607.
Hansen ADA, Rosen H, Novakov T (1984). The aethalometer – an instrument for the real-time
measurement of optical absorption by aerosol particles. Science of the Total Environment, 36:191–196.
Hitzenberger RA et al. (2006). Intercomparison of thermal and optical measurement methods for
elemental carbon and black carbon at an urban location. Environmental Science & Technology, 40:6377–
6383.
Hoek G et al. (1997). Wintertime PM10 and black smoke concentrations across Europe: results from the
PEACE study. Atmospheric Environment, 31:3609–3622.
ISO (1993). ISO standard 9835:1993 (E). Ambient air – determination of a black smoke index. Geneva,
International Organization for Standardization.
Janssen NAH et al. (2011). Black carbon as an additional indicator of the adverse health of airborne
particles compared to PM10 and PM2.5. Environmental Health Perspectives, 119:1691–1699.
Kanaya Y et al. (2008). Mass concentrations of black carbon measured by four instruments in the middle
of Central East China in June 2006. Atmospheric Chemistry and Physics, 8:7637–7649.Health effects of black carbon page 12 Kocbach Bolling A et al. (2009). Health effects of residential wood smoke particles: the importance of combustion conditions and physicochemical particle properties. Particle and Fibre Toxicology, 6:29. Müller TM et al. (2011). Characterization and intercomparison of aerosol absorption photometers: result of two intercomparison workshops. Atmospheric Measurements Techniques, 4: 245–268. Naeher LP et al. (2007). Woodsmoke health effects: a review. Inhalation Toxicology, 19:67–106. OECD (1964). Methods of measuring air pollution. Report of the working party on methods of measuring air pollution and survey techniques. Paris, Organisation for Economic Co-operation and Development. Petzold A, Schonlinner M (2004). Multi-angle absorption photometry – a new method for the measurement of aerosol light absorption and atmospheric black carbon. Journal of Aerosol Science, 35:421–441. Reisinger P et al. (2008). Intercomparison of measurement techniques for black or elemental carbon under urban background conditions in wintertime: influence of biomass combustion. Environmental Science & Technology, 42:884–889. Roorda-Knape MC et al. (1998). Air pollution from traffic in city districts near major roadways. Atmospheric Environment, 32:1921–1930. Schaap M, Denier van der Gon HAC (2007). On the variability of black smoke and carbonaceous aerosols in the Netherlands. Atmospheric Environment, 41:5908–5920.
Health effects of black carbon
                                                                                                  page 13

2. Assessment of exposure to BC in epidemiological
   studies
      Timo Lanki

The light Abs of PM2.5 filter samples has been used in most European epidemiological studies as
a measure of exposure to black carbon particles (BCP), whereas in studies in the United States,
the EC content of the samples has mostly been used for the purpose. In some studies, Abs has
been further converted into BS, which was widely used in the past in Europe for air quality
monitoring. However, the conversion factor found in ISO standard 9835:1993 (ISO, 1993) is not
suitable for present-day particulate air pollution mixture, but local calibration factors should be
used. In earlier studies, the coefficient of haze may have been used as a measure of BCP.
Because of similar measurement principles, the method gives results that are highly correlated
with BC concentrations obtained with more modern methods such as aethalometers. Real-time
BC measurement methods will undoubtedly increase in popularity with time, especially in
settings where filter sampling is not needed for other purposes.

Short-term exposures
Time-series study design has been the most frequently used method to evaluate the acute effects of
BC exposure on population health. The design is based on comparing short-term (typically daily)
variations in exposure with short-term variations in population health, for example, mortality or
hospitalization. In the setting, population exposure is assessed by measuring BCP at one or more
centrally located outdoor monitoring stations. The accuracy of estimates of the effects on health
eventually depends on how well daily BCP levels measured at the central outdoor monitoring site
(ambient BCP) reflect daily changes in personal exposure to BCP (personal BCP) in the study area.
It should be noted that ambient concentration is a valid proxy for personal exposure even when an
individual’s exposure on a given day may not be predicted very accurately because of random
error (Zeger et al., 2000). In contrast, an inability by outdoor monitoring to reflect daily mean
exposure in the study population leads to biased health effect estimates. Panel studies with repeated
clinical and air pollution measurements similarly rely on accurate assessment of day-to-day
variability in exposure.

Only a few studies have evaluated longitudinal relationships between daily ambient and personal
BCP concentrations (Table 2). Considering the large proportion of the 24-hour cycle typically
spent in the home, the observation of a high correlation between repeated daily measurements of
personal BCP and BCP indoors (indoor BCP) (median Pearson’s r >0.9 for individual regression
results) is not surprising (Janssen et al., 2000). One study linking ambient BCP with indoor BCP
has, therefore, been included in Table 2.

In European studies, the Abs of PM2.5 filters has been used as a measure of BCP (Table 2).
Ambient Abs was found to be more strongly associated with respective personal and indoor
levels than PM2.5 in these studies. It is noteworthy that indoor EC was reasonably correlated with
indoor Abs (R=0.57–0.85) in the Dutch-Finnish study (Janssen et al., 2000), but the slope was
different for homes with and without environmental tobacco smoke. In the studies included in
this report, Abs has been measured from PM2.5 filters, and thus size-fraction is not mentioned
any more. PM2.5 Abs has been reported as capturing most of the particulate Abs in ambient air
(Cyrys et al., 2003).
You can also read