Blackpool Drug Health Needs Assessment - April 2014 - JSNA Blackpool
←
→
Page content transcription
If your browser does not render page correctly, please read the page content below
Blackpool Drug Health Needs
Assessment

April 2014
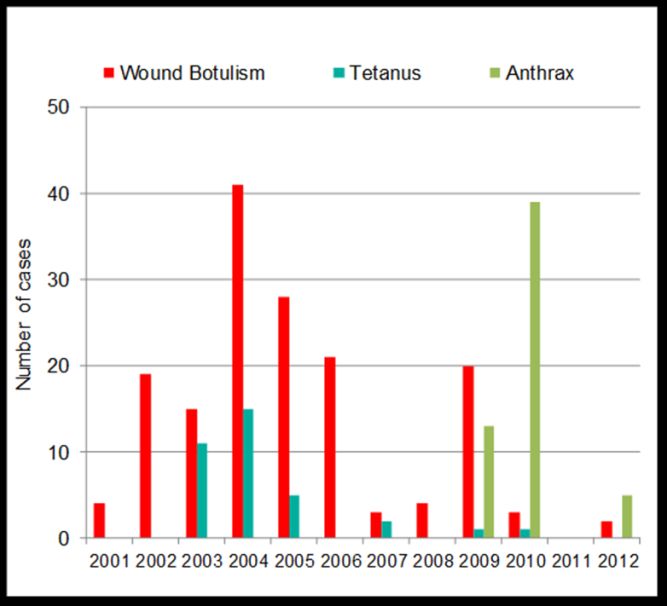
Table of Contents
   Tables .................................................................................................................................................. 2
   Figures ................................................................................................................................................. 2
Blackpool Drugs Health Needs Assessment ............................................................................................ 4
        Key Points - Service Overview ......................................................................................................... 5
   Scope ................................................................................................................................................... 6
   1.          Introduction ................................................................................................................................ 7
   2.          Children and Young People ......................................................................................................... 8
        i.        Demographics ......................................................................................................................... 8
        ii.       Factors associated with drug use .......................................................................................... 10
        iii.      AACCE (Alcohol, Amphetamine, Cannabis, Cocaine or Ecstasy use) ..................................... 11
        iv.       Legal Highs ............................................................................................................................ 11
        v.        Child and young person deaths ............................................................................................. 12
        vi.       Families in Need .................................................................................................................... 13
        vii.          Referrals ............................................................................................................................ 14
        viii.         Service Overview ............................................................................................................... 14
   3.          Adults ........................................................................................................................................ 16
        i.        Estimated problematic drug use prevalence rates and geographic variations .................... 16
        ii.       AACCE (Alcohol, Amphetamine, Cannabis, Cocaine or Ecstasy use) ..................................... 17
        iii.      Emerging Drug Trends in Lancashire: Night Time Economy Surveys - Phase One Report .... 19
        iv.       Legal Highs ............................................................................................................................ 20
        v.        Adverse Effects/Consequences.............................................................................................. 20
        vi.       Drug Related Morbidity......................................................................................................... 28
        vii. Risk Behaviours ........................................................................................................................ 31
        vii.          Dual Diagnosis / Comorbidity ........................................................................................... 34
        ix. Hospital Admissions (Drug-Related) ......................................................................................... 35
        x. Families in Need ........................................................................................................................ 36
        xii. Drugs and Community Safety .................................................................................................. 37
        xiii. Service overview ..................................................................................................................... 40
   References ........................................................................................................................................ 48

                                                                                                                                                               1
Tables
Table 1: Young people referral sources - local & national (2012-13) ................................................... 14
Table 2: England prevalence estimates and rates per 1,000 population aged 15-64 (2010-11) .......... 16
Table 3: Opiate and/or crack use prevalence rates per thousand population, by age group and region
 .............................................................................................................................................................. 16
Table 4: National (England) estimates of opiate and/or crack use, and crack cocaine use 2009-10 and
2010-11 ................................................................................................................................................. 17
Table 5: National and local OCU prevalence estimates and rates per 1,000 population aged 15-64
(2010-11) ............................................................................................................................................... 17
Table 6: Number of deaths from drug-related poisoning and drug misuse for England and Wales
(2008-2012)........................................................................................................................................... 21
Table 7: Demographic characteristics of 'drug misuse' deaths reported to np-SAD panel of Coroners’
areas (2002-2011) ................................................................................................................................. 24
Table 8: Male drug-related poisonings ................................................................................................. 25
Table 9: Female drug-related poisonings ............................................................................................. 25
Table 10: Housing situation of new treatment journeys – England & Blackpool 2012/13 .................. 36
Table 11: Source of criminal justice referrals into drug treatment: Blackpool 2012-13 ...................... 38
Table 12: Complex needs identified at intake ...................................................................................... 40
Table 13: Prevalence estimates (aged 15-64yrs): Local and national rates.......................................... 41
Table 14: Source of referral into drug treatment, new presentations into treatment: Blackpool 2012-
13 .......................................................................................................................................................... 44
Table 15: Treatment exit reasons for individuals not retained in treatment in Blackpool and England
on 31/03/ 2013 ..................................................................................................................................... 45
Table 16: Length of time in prescribing for clients in continuous prescribing treatment in England
2012-13 ................................................................................................................................................. 45
Table 17: Time in treatment in Blackpool as at Sept 2013. .................................................................. 46

Figures
Figure 1: Took cannabis, volatile substances or poppers in the last year (2001-2012).......................... 8
Figure 2: Took drugs in the last month, year and ever (2001-2012) ...................................................... 8
Figure 3: Proportion of pupils who have taken drugs ever and in the last year, by region (2011-2012)
.............................................................................................................................................................. 11
Figure 4: Substance misuse by children who have been looked after continuously for at least 12
months (Blackpool 2011-13) ................................................................................................................. 13
Figure 5: Numbers of young people in specialist services - local and national 2012-13 ...................... 14
Figure 6: Young Person’s Risk-harm Profile – Blackpool and England 2010-2013 ............................... 15
Figure 7: Trends in illicit drug use (excluding mephedrone) in the last year among adults, 1996 to
2012/13, Crime Survey for England and Wales .................................................................................... 18
Figure 8: Proportion of 16 to 59 year olds reporting use of any drug in the last year by age group,
1996 to 2012/13, Crime Survey for England and Wales ....................................................................... 18
Figure 9: Comparing the Lancashire NTE survey to the national picture (2009-10)............................. 19
Figure 10: Source drugs were obtained from (2012-13) ...................................................................... 20
Figure 11: Age-standardised mortality rates for selected substances, males, deaths registered in
2008–2012, England and Wales............................................................................................................ 22

                                                                                                                                                                2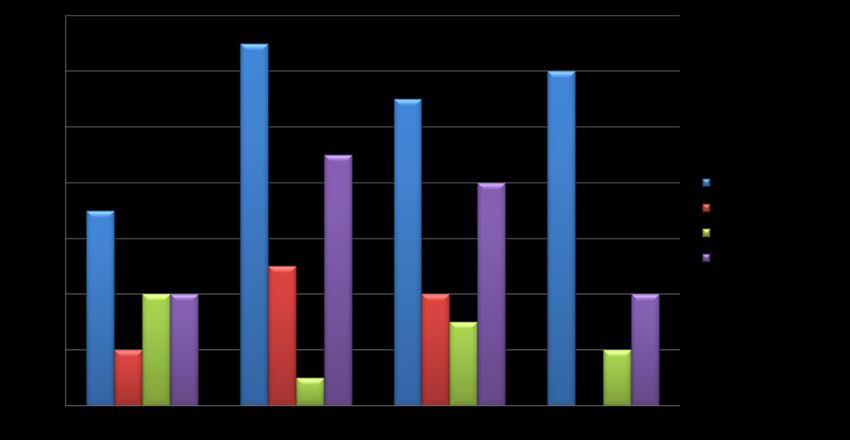
Figure 12: Age-standardised mortality rates for selected substances, females, deaths registered in
2008–2012, England and Wales............................................................................................................ 23
Figure 13: Suspected drug-related deaths – Blackpool (2009-2012).................................................... 26
Figure 14: Substances implicated – Blackpool (2009-2012) ................................................................. 27
Figure 15: Age range of drug-related deaths – Blackpool (2009-2012) ................................................ 27
Figure 16: Age-standardised mortality rates for deaths related to drug poisoning and drug misuse, by
sex, deaths registered in 1993-2012 ..................................................................................................... 27
Figure 17: Spore forming bacterial infections among PWID: reported cases in the UK (2001-2012) .. 29
Figure 18: Frequent or heavy alcohol users — use of cannabis and cocaine during the last 12 months
compared to the general population of 15- to 34-year-olds ................................................................ 33
Figure 19: All drug-related offences: Blackpool 2008-12 (All ages) ...................................................... 39
Figure 20: Adult OCU new treatment journey numbers: Blackpool 2012-13....................................... 41
Figure 21: Adult new treatment journey numbers: Blackpool 2012-13 ............................................... 41
  Figure 22: Adult treatment group gender profile: Blackpool 2012-13 ............................................. 42
Figure 23: Age group profile: Blackpool 2012-13 ................................................................................. 42
Figure 24: Employment status at start of treatment: Blackpool 2012-13 ............................................ 43
Figure 25: Primary drug of use: Blackpool 2012-13 .............................................................................. 43
Figure 26: Injecting status: Blackpool as at March 2013 ...................................................................... 44
Figure 27: Hepatitis B and C vaccinations: Blackpool and National 2012-13 ....................................... 46

                                                                                                                                          3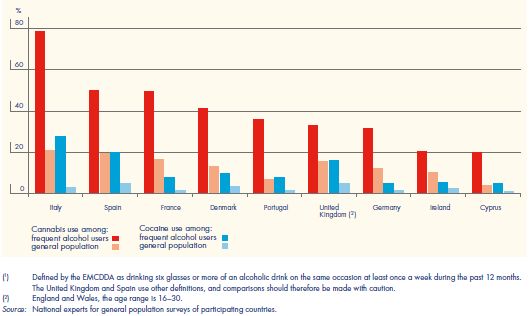
Blackpool Drugs Health Needs Assessment

                                                Alan Shaw

                                  Public Health Department

                                          Blackpool Council

                                                  Page 4 of 52
Key Points - Service Overview
Children & Young People’s Services
The majority of referrals (62%) to Blackpool’s young people’s specialist substance misuse services were
received from Youth Justice and Education services.
There were 76 drug and alcohol clients aged under 18 years in specialist services in 2012/13, compared to
140 and 176 in 2011/12 and 2010/11 respectively.
70% of young people in treatment services had 2 to 4 identified risks/vulnerabilities in 2012/13.
Young people in treatment services are more likely to be not in education, employment or training / have
a contracted sexually transmitted infection / have a child / be in contact with the youth justice system / be
receiving benefits by the time they are 18 / half as likely to be in full-time employment.
98% of young people entering the treatment service in 2012/13 began using the main problem substance
(includes alcohol) under the age of 15 years.
42% of young people entering the treatment service in 2012/13 were using two or more substances.
40% of young people entering the treatment service in 2012/13 were involved in offending.
Adult Services
In 2012/13 there were an estimated 1,946 Opiate and/or Crack users in Blackpool (21.89 per 1,000
population – compared to 8.67 per 1,000 for England).
In 2012/13 there were an estimated 958 injecting drug users in Blackpool (10.77 per 1,000 population –
compared to 2.71 per 1,000 for England).
63% of all those in treatment in 2012/13 were ‘opiate only’ users. 28% were opiate and crack users.
As at 31/3/2012, 771 adults (63%) in treatment reported the use of a second drug. 363 (30%) reported
the use of a third drug.
In 2012 there were 18 suspected drug-related deaths – a 50% reduction from 2006, when Blackpool had
the highest number in England.
In 2012/13 68% of eligible new clients accepted a hepatitis B vaccination.
In 2012/13 approximately 491,000 needles were distributed through the needle exchange programme.
In 2012/13 87 individuals starting treatment were receiving care from mental health services for reasons
other than substance misuse.
In 2010/11 there were 545 hospital admissions where there was a primary or secondary diagnosis of drug-
related mental health and behavioural disorders.
In 2010/11 there were 82 hospital admissions where there was a primary diagnosis of poisoning by drugs.
In 2012/13 26% (n=92) of new clients reported a housing problem i.e. of no fixed abode or staying with
friends/family as a short-term guest or residing at a short-term hostel.
Drug-related offences committed in Blackpool increased 107% (from 240 to 498 offences) between 2008
and 2013.
73% of new clients in 2012/13 were unemployed, and 5% were long-term sick or disabled.
88% of clients in treatment services are aged 30+. 62% are aged 35 to 50 years.
68% of all clients in treatment in 2012/13 were male.
74% of new clients starting treatment in 2012/13 were self-referrals.
During 2012/13, 26% of Blackpool clients (n=105) who exited treatment did so drug free. 23% of clients
(n=90) who exited treatment dropped out of, or didn’t commence treatment.
As at September 2013, 43.3% of opiate users had been in treatment up to two years. 25.9% had been in
treatment for six years or more.
Approximately 491,000 needles were distributed through the Blackpool needle exchange programme in
2012/13.
Page 5 of 52Scope
This Health Needs Assessment (HNA) provides an overview of the current patterns of drug use in
Blackpool and the impact on the population, along with regional and national comparisons. It
considers both adult and young person groups, and also the current use of drug services. As such it is
a comparative, epidemiological HNA using existing data and evidence. It is intended to act as a
foundation from which further information gathering can develop, and to inform the direction of
service provision and resource use according to need.
Page 6 of 521. Introduction
The Misuse of Drugs Act 1971, with amendments, is the main law regulating drug control in the United
Kingdom. It divides controlled substances into three classes (A, B, C) based on harm, with Class A being the
most harmful. These classes provide a basis for attributing penalties for offences. Each class attracts different
levels of penalties for a range of unlawful activities, including possession, supply and production of a
controlled drug. The Home Secretary has the power to make a temporary class drug order (TCDO) for an
emerging drug that is causing a concern. A TCDO can be made within a matter of days and lasts for up to 12
months.
Drug Classification:
Class A: Crack cocaine, cocaine, ecstasy (MDMA), heroin, magic mushrooms, methadone, methamphetamine
(crystal meth).
Class B: Amphetamines, barbiturates, cannabis, codeine, methylphenidate (Ritalin), synthetic cannabinoids,
synthetic cathinones (e.g. mephedrone. methoxetamine).
Class C: Anabolic steroids, benzodiazepines (diazepam), gamma hydroxybutyrate (GHB), gamma-
butyrolactone (GBL), ketamine, piperazines (BZP).
National drug strategy for England
Launched on 8 December 2010, the Drug Strategy 2010: Reducing Demand, Restricting Supply, Building
Recovery is primarily concerned with illicit drugs, but also includes alcohol use. The strategy has two
overarching aims: (i) to reduce illicit and other harmful drug use; and (ii) to increase the numbers recovering
from their dependence. This document replaced the 2008 strategy published by the previous government and
has a greater emphasis on recovery, with more responsibility placed on individuals to seek help and overcome
dependency. Increased weight is given to providing a more holistic approach by addressing other issues in
addition to treatment. This is designed to support people dependent on drugs or alcohol by addressing issues
such as offending, employment and housing. The strategy aims to reduce demand and takes an
uncompromising approach to targeting those involved in supplying drugs in the United Kingdom and
internationally. In addition, it places more power and accountability in the hands of local communities to
tackle drugs and the harms they cause. The strategy’s aims are addressed though three thematic areas: (i)
reducing demand; (ii) restricting supply; and (iii) building recovery in communities.
Page 7 of 522. Children and Young People
i. Demographics
Please see the JSNA Core Document Chapter 1 for general demographic information.
1
Smoking, drinking and drug use among young people in England in 2012 :
In 2012, the prevalence of illegal drug use was at its lowest since 2001, when the current method of
measurement was first used. 17% of pupils had ever taken drugs, 12% had taken them in the last year and 6%
in the last month.
Boys and girls were equally likely to have taken drugs, and older pupils were more likely than younger ones to
have done so. The prevalence of ever having taken drugs increased with age from 7% of 11 year olds to 31% of
15 year olds. There were similar patterns for drug use in the last year (from 4% to 24%) and in the last month
(from 2% to 13%).
In 2012, as in previous years, cannabis was the most widely used drug among 11 to 15 year olds; 7.5% of pupils
reported taking it in the last year. This figure is similar to that seen in 2011 (7.6%), but continues the overall
downward trend in prevalence of cannabis use since 2001.
In 2012, 28% of pupils reported that they had ever been offered drugs.
Around half (52%) of pupils aged between 11 and 15 said that they had tried smoking, drunk alcohol or taken
drugs at least once in their lives. 17% had done one or more of these recently. They were more likely to have
drunk alcohol in the last week (10%) than to have smoked in the last week (6%) or to have taken drugs in the
last month (also 6%). There was considerable overlap between behaviours. For example, 6% of pupils
reported taking drugs in the last month and most of those (4% of all pupils) had smoked or drunk alcohol in the
last week, or had done both.
Figure 2: Took drugs in the last month, year and ever (2001- Figure 1: Took cannabis, volatile substances or poppers in the
2012) last year (2001-2012)
Source: HSCIC, 2013 Source: HSCIC, 2013
In 2012, Class A drug use remained relatively rare among pupils; 2.2% reported taking one of the eight Class A
drugs asked about in the last year. From 2001 to 2009, this proportion was around 4% but fell to 2.4% in 2010
and has remained at a similar level since.
1
Statistics on Drug Misuse: England 2013 (Health and Social Care Information Centre)
Page 8 of 52In 2012, 75% of pupils who had taken drugs in the last year reported only having taken one type of drug, and
25% had taken two or more. Boys were more likely than girls to have only taken cannabis in the last year (50%
and 41% respectively). Conversely, girls were more likely than boys to have only used volatile substances (26%
and 20% respectively). Other differences between boys and girls in patterns of drug use over the last year
were not significant.
Of those who reported any drug use in the last year, older pupils were more likely than younger pupils to have
taken two or more types of drug in that time (17% of 11 - 13 year olds, rising to 29% of 15 year olds). Younger
pupils were more likely to report that their only drug use in the last year was volatile substances (52% of 11 to
13 year olds compared with 9% of 15 year olds), whilst older pupils were most likely to have taken cannabis,
but not other drugs (56% of 15 year olds compared with 21% of 11 to 13 year olds).
In 2012, pupils who had ever truanted or had been excluded from school were more likely to report usually
taking drugs at least once a month than those who had never truanted or had never been excluded (10%
compared with 1%). This proportion is lower than in 2011 (12%) and maintains the overall decline in the
prevalence of frequent drug use amongst this group of vulnerable pupils since 2003, when it was 21%. Pupils
who had ever played truant or been excluded were more likely to report taking Class A drugs in the last year
(9%) than those who had never truanted or been excluded (1%). This is at a similar level to recent years,
although lower than in 2003, when it was 14%.
Awareness of individual drugs
As in previous years, there was a widespread awareness of illegal drugs among pupils in 2012. Around nine in
ten pupils had heard of cocaine (92%), heroin (89%) and cannabis (87%). Fewer pupils had heard of the other
drugs listed. Poppers (35%), ketamine (35%) and mephedrone (44%) were the least well-known.
Polydrug Use
The broad definition of ‘polydrug’ used by many EU Member States is the use of more than one drug or type of
drug by an individual — consumed at the same time or sequentially. According to the broad definition, all
illegal drug users would be defined as polydrug users as they almost always use alcohol and/or tobacco at
some time in their life.
Polydrug use can lead to multiple adverse health consequences. Such consequences can occur (generally as
acute toxicity) shortly after the consumption of several substances, or within a short time. They can also occur
following a long period of use, due to various mechanisms affecting body systems, including the liver and the
central nervous, cardiovascular or respiratory systems.
The European Monitoring Centre for Drugs and Drug Addiction (EMCDDA) states that polydrug use
encompasses wide variations in user populations and patterns of use: from occasional alcohol and cannabis
use to the daily use of combinations of heroin, cocaine, alcohol and benzodiazepines. The EMCDDA therefore
looks at three different populations, for which patterns of polydrug use and their consequences are likely to
differ: adolescents aged 15–16 years, young adults and problem drug users.
Polydrug use among adolescents aged 15-16 years
Use of alcohol, cigarettes, cannabis and other psychoactive substances by young Europeans has increased
since the 1990s, in a variety of drug-using repertoires (EMCDDA, 2008a). School population surveys invariably
show that alcohol consumption and cigarette smoking are far more prevalent than the use of illicit drugs. They
also confirm that cannabis is the most commonly used illicit drug, with prevalence estimates generally
reaching much higher levels than those for other substances such as ecstasy, amphetamine, cocaine, heroin,
LSD and hallucinogenic mushrooms.
Page 9 of 52Intensive patterns of drug use, with the possible exception of tobacco smoking, usually remain limited among
adolescents. However, the use of any psychoactive substance in this age group is of concern as the brain and
other organs are still developing during adolescence, and exposure to toxic substances may cause damage,
though it might only appear later in life. In addition, early initiation during adolescence has been associated
with higher probability of drug use later in life and greater difficulties in reducing or ceasing drug use (von
Sydow et al., 2002). Polydrug use among adolescents, defined as the use of at least two different psychoactive
substances at a young age, could be considered an indirect indicator for early initiation. Furthermore, the use
of illicit substances that are uncommon at this age — depending on the local context, these might be cannabis
or other drugs such as cocaine — could also reflect higher levels of risk behaviours, social exclusion or
deviance among adolescents.
Individual data from surveys carried out in 2003 by the European school survey project on alcohol and other
drugs (ESPAD) were used to examine the characteristics of polydrug use among over 70 000 15 to 16-year-old
students from 22 European countries. In order to attain sufficiently large samples for statistical analysis, while
also allowing exploration of differences in polydrug use patterns in different contexts, the countries were
divided into three distinct groups based on their prevalence levels of substance use during the last 30 days
(last month use). The United Kingdom was assigned to the high-prevalence group. The proportion of polydrug
users was nearly 40% in the high-prevalence country group, 36% in the medium-prevalence country group and
22.5% in the low-prevalence group.
ii. Factors associated with drug use
Sex and age
After controlling for other factors, there was no significant difference between boys and girls. Although age
was strongly associated with drug use in the last year, once other variables were taken into account, the
increase in the odds of having taken drugs in the last year with each additional year of age was not statistically
significant (HSCIC, 2013). This is because some of the variables that were most strongly associated with drug
use in the last year (for example, smoking, drinking alcohol and truancy) were also strongly associated with
age.
Ethnicity
Compared with White pupils, pupils of Mixed, Asian and Black ethnicity were more likely to have taken drugs
in the last year (odds ratios: 1.80, 2.36, 1.97 respectively).
The proportions of pupils who had ever tried drugs were generally higher in the south of England than
elsewhere. In the north and midlands, between 15% and 17% of pupils reported having tried drugs. In the
south, the proportion who had ever taken drugs varied between 18% (the South West) and 20% (London).
There was little variation between regions in the proportion of pupils who had taken drugs in the last year and
in the last month.
Page 10 of 52Figure 3: Proportion of pupils who have taken drugs ever and in the last year, by region (2011-2012)
Source: HSCIC, 2012.
iii. AACCE (Alcohol, Amphetamine, Cannabis, Cocaine or Ecstasy use)
Drug Misuse: Findings from the 2012/13 Crime Survey for England and Wales (CSEW)
Young adults (those aged 16 to 24) were more likely to have used drugs in the last year than older adults.
However, the proportion of adults aged 16 to 24 taking any drug in the last year was 16.3%, down from 19.3%
in 2011/12.
iv. Legal Highs
The pattern of drugs use is constantly evolving, and there are always new drug threats to consider. New
psychoactive substances (so-called ‘legal highs’) frequently contain substances that are not legal and cannot be
assumed safe. New psychoactive substances have become a particular concern in recent years with supply
and demand increasing. The availability of these substances, especially over the internet and in ‘head shops’,
has radically changed the nature of the drugs market.
For the 2012/13 CSEW, questions were added for the first time on the ‘last year use’ of legal emerging drugs
salvia and nitrous oxide:
For young adults, aged 16 to 24:
6.1% had taken nitrous oxide in the last year
1.1% had taken salvia in the last year
Findings from the Lancashire Night Time Economy survey (NTE) in November 2010 by Lancaster University
2
revealed that 1% of the sample reported having had a ‘legal high’ in the last month . Mean age of the
respondents was 23.8 years.
2
Emerging Drug Trends in Lancashire: Night Time Economy Surveys – Phase One Report (2011)
Page 11 of 52v. Child and young person deaths
Males
Mortality rates in younger males have continued their downward trend and are now at their lowest level since
records began (2.5 and 47.6 deaths per million population in 2012 for under 20s and 20-29-year-olds
respectively).
Females
As with males, the lowest female mortality rates in 2012 were in those aged under 20 (1.2 deaths per million
population). Mortality rates for females aged 20-29 has reduced significantly from 18.9 deaths per million
population in 2008 to 10.7 per million in 2012. These trends mean that the female mortality rate in 20 to 29-
year-olds is now slightly lower than the rate in 50 to 69-year-olds.
Blackpool
During the 2012/13 reporting year the Pan-Lancashire Child Death Overview Panel (CDOP) was notified of 129
child deaths (8 Blackpool residents, 11 Blackburn with Darwen (BwD) residents, 93 Lancashire residents and 17
out of area). In the same reporting year the Panel completed 150 reviews (15 BwD reviews, 11 Blackpool
reviews and 124 Lancashire reviews). Of the 150 child deaths reviewed, 36 were deemed to have modifiable
factors (defined as those factors which, by means of nationally or locally achievable interventions, could be
modified to reduce the risk of future child deaths) and 114 of which were deemed to have no modifiable
factors. Blackpool was deemed to have had seven unexpected deaths, of which five had modifiable factors.
During the period April 2008 – March 2013, the Pan-Lancashire CDOP completed 633 reviews, of which 140
were deemed to have modifiable factors. The most common risk factors identified from the 140 cases
deemed to have modifiable factors were:
1. 32% of cases identified issues in relation to service provision: including engagement with services,
language barriers or access to services
28% of cases identified alcohol/ substance misuse by a parent or carer
24% of cases identified smoking by a parent/ carer
2. 21% of cases identified issues relating to safer sleep for baby (80% also had either smoking, alcohol
and/or substance misuse as risk factors)
3. Other factors noted by CDOP included mental health of a parent/ carer, domestic violence, chaotic
lifestyles and housing issue
Experian Mosaic Public Sector was used to profile all the child death data, and it was identified that families
from the following socio-economic backgrounds suffered more child deaths:
i. Lower income workers in urban terraces in often diverse areas
ii. Families in low-rise social housing with high levels of benefit need
Further analysis identified the following specific groups of being more at risk of child deaths:
i. South Asian communities experiencing social deprivation
ii. Families living in older town centre terraces with transient, single populations
iii. Low income families occupying poor quality older terraces
iv. Vulnerable young parents needing substantial state support
Page 12 of 52vi. Families in Need
Children and families affected
Information obtained from the National Drug Treatment Monitoring System (NDTMS) indicate that there were
201 individuals in treatment in Blackpool with children, which was 54% of those starting treatment during
2012. This Includes 15 (31%) of those starting treatment at the Hub (Young Peoples service).
Looked After Children
Studies have shown that young people from more than one vulnerable group are more at risk of drug and
alcohol misuse (DfES, 2005; The NHS Information Centre, 2011). The groups at risk are:
i. Young offenders
ii. Looked after children
iii. Care leavers
iv. Children affected by parental substance misuse
v. Children affected by domestic violence
vi. Homeless young people
vii. Young people at risk from sexual exploitation
viii. Young people in gangs or at risk of gang recruitment
ix. Excludees and persistent truants
Figure 4: Substance misuse by children who have been looked after continuously for at least 12 months (Blackpool 2011-
13)
Substance misuse by children who have been looked after
continuously for at least 12 months: Blackpool 2011-13
350 Number of children
looked after at 31 March
300
250
Number identified as
200 having a substance
misuse problem during
150 the year
100 Number who received an
intervention for their
50 substance misuse
problem during the year
0
Blackpool Blackpool Blackpool
2013 2012 2011
Source: Dept. for Education, 2013
Page 13 of 52vii. Referrals
Young people come to specialist services from various routes but are typically referred by youth justice;
education; self; family & friends and children & family services. In Blackpool in 2012-13, 34% of referrals into
Young Peoples specialist substance misuse services were from Youth Justice, followed by 28% from Education
Services (Table 1).
Table 1: Young people referral sources - local & national (2012-13)
Young People Referral Sources: 2012-13 Local National
n % %
Youth Justice (incl. the Secure Estate) 28 34% 34%
Education Services 23 28% 24%
Self, Family & Friends 8 10% 11%
Children & Family Services 8 10% 10%
Other Substance Misuse Services 4 5% 9%
Health & Mental Health Services (excl. A&E) 6 7% 7%
Accident & Emergency 0 0% 1%
Other 6 7% 3%
Source: NDTMS
viii. Service Overview
In Blackpool, there is a specialist treatment service (The Hub) for young people under the age of 25 years. This
service provides a central point of contact for initial introduction to treatment for all drug and alcohol users
under the age of 25 years.
The figures below reflect the number of young people aged under 18 years in specialist substance misuse
services in Blackpool during 2011-12 and 2012-13, and as a proportion of the entire treatment population for
the area. Also included is the number of young people who have received specialist treatment within a secure
setting in the youth justice system. Reporting to NDTMS by the secure estate began with Young Offender
Institutions (YOI) in 2012-13 and has been rolled out to Secure Training Centres and Secure Children’s Homes
since April 2013. The figures for 2012-13 therefore only reflect those detained within the YOI estate and a
partial picture of the total number of specialist interventions delivered to young people whilst in custody.
Figure 5: Numbers of young people in specialist services - local and national 2012-13
Source: NDTMS
Page 14 of 52The risk-harm profile (Fig. 5) identifies 10 key items to gauge the vulnerability of young people entering
specialist substance misuse services. The higher the score, the more complex the need. Age of initiation is
often the strongest predictor of the length and severity of substance misuse problems, the younger the age
they start to use, the greater the likelihood of them becoming adult problematic drug users. The data below
(Fig. 6) gives the age of young people in specialist services but not the age of initiation.
Many young people receiving specialist interventions have a range of vulnerabilities. They are more likely to
be not in education, employment or training (NEET), have contracted a sexually transmitted infection (STI),
have a child, be in contact with the youth justice system, be receiving benefits by the time they are 18, and
half as likely to be in full-time employment. Universal and targeted services have a role to play in providing
substance misuse support at the earliest opportunity, specialist services should be provided to those whose
use has escalated and is causing them harm.
Figure 6: Young Person’s Risk-harm Profile – Blackpool and England 2010-2013
Source: NDTMS
Criminal Justice
Whilst the above figures relate to young people aged under 18 years, The Hub Young People’s Substance
Misuse service also provides a service to individuals aged 18 to 24 years. The Hub therefore receives referrals
from the Lancashire Probation Service, who supervise 18-24 year olds in the community.
The following referrals were received by The Hub for young people on probation with assessed substance
misuse problems:
x. 2011/12 – 15
xi. 2012/13 - 22
Page 15 of 523. Adults
i. Estimated problematic drug use prevalence rates and geographic variations
Table 2 presents the 2010-11 national (England) estimates and prevalence rates for those using opiates and/or
crack cocaine or injecting. Overall in 2010-11 there were an estimated 298,752 opiate and/or crack users in
England; this corresponds to 8.67 per thousand of the population age 15-64.
Table 2: England prevalence estimates and rates per 1,000 population aged 15-64 (2010-11)
Drug Estimate Rate
Opiate and/or crack 298,752 8.67
Opiate 259,260 7.59
Crack cocaine 165,877 4.95
Injecting 90,974 2.71
Source: NTA, 2013
In terms of regional differences, the North West has the highest prevalence of opiate and/or crack use at
10.83 per thousand population aged 15-64. The South East and the East of England have the lowest
prevalence of opiate and/or crack use at 5.98 and 6.30 per thousand, respectively.
When considering opiate use prevalence, the highest prevalence rates are in the North West at 9.58 per
thousand and the North East at 9.51. The lowest prevalence rates of opiate use are in the South East and the
East of England at 5.27 and 5.44 per thousand, respectively. London has the highest estimated prevalence of
crack cocaine use at 7.30 per thousand population compared to a prevalence of 6.01 in the North West.
Table 3 shows that, nationally, the markedly highest prevalence rate is in the 25-34 age group. This was also
the case across individual regions. The North West has the highest prevalence rate in the 35-64 age range
which, at just over ten per thousand, is much greater than the other Government Office Regions.
Table 3: Opiate and/or crack use prevalence rates per thousand population, by age group and region
15-24 years 25-34 years 35-64 years
Region
Rate Rate Rate
East of England 5.33 11.96 4.87
East Midlands 5.84 19.85 5.57
London 8.61 11.24 9.13
North East 7.58 28.05 6.26
North West 5.69 17.45 10.57
South East 4.41 12.04 4.67
South West 4.42 17.94 6.55
West Midlands 6.85 23.48 6.52
Yorkshire and the Humber 6.22 21.79 7.49
ENGLAND 6.04 16.46 6.94
Source: NTA, 2013
Table 4 compares the prevalence estimates for 2009-10 and 2010-11. Overall in 2010-11 there were an
estimated 298,752 opiate and/or crack users in England; in 2009-10 it was 306,150. There was a slight
decrease in the number of opiate users and a statistically significant decrease in the number of crack cocaine
users. The decrease in the number of injectors was also statistically significant.
Page 16 of 52Table 4: National (England) estimates of opiate and/or crack use, and crack cocaine use 2009-10 and 2010-11
2009-10 2010-11
Drug
Estimate Estimate
Opiate and/or crack 306,150 298,752
Opiate 264,072 259,260
Crack cocaine 184,247 165,877
Injecting 103,185 90,974
Source: NTA, 2013
The results here show that there has been a decrease in the national estimate of problem drug use between
2009-10 and 2010-11. There were statistically significant decreases in crack use and injecting, in the younger
(15 to 24) and middle (25 to 34) age group, but a statistically significant increase in the older (35 to 64) age
group.
Blackpool has an opiate and/or crack cocaine use (OCU) rate of 21.89 per 1,000 population, compared to
10.83 and 8.67 for the North West and England respectively. The rate for opiate users is 20.27, compared to
9.58 and 7.59 for the North West and England; 10.77 for injecting drug users, compared to 3.23 and 2.71 for
the North West and England; and 8.11 for crack users, compared to 6.01 and 4.95 for the North West and
England.
Table 5: National and local OCU prevalence estimates and rates per 1,000 population aged 15-64 (2010-11)
Number of users Rate per thousand of the population
15-64
population
Opiate Crack Opiate Crack
OCU Injecting OCU Injecting
users users users users
Blackpool 88,900 1,946 1,802 721 958 21.89 20.27 8.11 10.77
North West 4,562,100 49,426 43,704 27,407 14,731 10.83 9.58 6.01 3.23
ENGLAND 34,476,900 298,752 261,792 170,627 93,401 8.67 7.59 4.95 2.71
Source: NTA (2013)
ii. AACCE (Alcohol, Amphetamine, Cannabis, Cocaine or Ecstasy use)
Drug Misuse: Findings from the 2012/13 Crime Survey for England and Wales:
Around 1 in 12 (8.2%) adults in England and Wales had taken an illicit drug (excluding mephedrone) in the
last year, a fall compared with 2011/12 (8.9%). This equates to around 2.7 million people;
According to the 2012/13 CSEW, 2.6% of adults aged 16 to 59 had taken a Class A drug in the last year
(equivalent to almost 850,000 people);
Cannabis was the most commonly used drug, with 6.4% of adults aged 16 to 59 using it in the last year.
The next most commonly used drugs in the last year were powder cocaine (1.9%) and ecstasy (1.3%).
Along with cannabis, these were also the most used drugs in 2011/12;
For all adults, the use of mephedrone in the last year has fallen from 1.1% in 2011/12 to 0.5% in 2012/13;
Page 17 of 52 Young adults (those aged 16 to 24) were more likely to have used drugs in the last year than older adults.
However, the proportion of adults aged 16 to 24 taking any drug in the last year was 16.3%, down from
19.3% in 2011/12.
Figure 7: Trends in illicit drug use (excluding mephedrone) in the last year among adults, 1996 to 2012/13, Crime Survey for
England and Wales
Source: Home Office, 2013
Figure 8: Proportion of 16 to 59 year olds reporting use of any drug in the last year by age group, 1996 to 2012/13, Crime
Survey for England and Wales
Source: Home Office, 2013
Page 18 of 52iii. Emerging Drug Trends in Lancashire: Night Time Economy Surveys - Phase
One Report
The authors state that the respondents in Lancashire’s NTE appear to be more drug experienced than those in
the general population – at least compared to those captured by lifetime, past year and past month drug use
figures in the British Crime Survey (BCS) 2009/10 (Figure 9). The number of adults (16-59 year olds) in the UK
who have ever used an illegal drug was 36% according to this latest BCS. By way of comparison, 70% of the
207 respondents surveyed across Lancashire’s NTE reported that they had tried an illegal drug at least once in
their lifetime.
Figure 9: Comparing the Lancashire NTE survey to the national picture (2009-10)
Comparing the Lancashire NTE survey to the
national picture
80
% of Respondents
70
60
50 Lancashire NTE
40
30 Survey 2010
20 British Crime Survey
10 2009/10
0
At least once in In the last year In the last
their lifetime month
Frequency of reported drug use
Source: Measham, Moore & Østergaard, 2011
In the terms of past year use of any drug, the BCS 2009/10 figure stands at 9%. This contrasts with the
Lancashire NTE survey where 41% of respondents reported having used any illegal drug within the last year.
5% of those in the BCS sample had consumed any illegal drug within the past month, compared with 29% of
those in the Lancashire NTE survey.
The BCS 2009/10 data on drug use by the regions of England and Wales highlights that the North West of
England (compared to all other regions, including Wales) has the highest proportion of adults (16-59 year olds)
reporting past year use of any drug at 10.4%, cannabis at 8%, ecstasy 2.3%, amphetamines 1.7% and
hallucinogens 0.8%. These regional figures are all higher than UK national averages. The North West of
England is second only to the North East of England for the proportion of adults using any Class A drug in the
past year and for the proportion of adults using powder cocaine in the past year (Hoare and Moon, 2010:49).
Between 1996 and 2012/13 CSEW last year use of any illicit drug fell overall, due in large part to the declines in
illicit drug use among 16 to 24 year olds (as shown in Figure 10) for the most prevalent drug types (cannabis,
ecstasy, amphetamines and hallucinogens).
Page 19 of 52Figure 10: Source drugs were obtained from (2012-13)
Source: Home Office, 2013
iv. Legal Highs
Please click here to see ‘Legal Highs’ section under Young People.
v. Adverse Effects/Consequences
a. Drug related deaths3
The following data covers accidents and suicides involving drug poisonings, as well as deaths from drug abuse
and drug dependence, but not other adverse effects of drugs (for example anaphylactic shock) in England and
Wales. Drug poisoning deaths involve a broad spectrum of substances, including legal and illegal drugs,
prescription drugs (either prescribed to the deceased or obtained by other means) and over-the-counter
medications. Some of these deaths may also be the result of complications of drug abuse, such as deep vein
thrombosis or septicaemia resulting from intravenous drug use, rather than an acute drug overdose.
There were 2,597 drug poisoning deaths (involving both legal and illegal drugs) registered in England and
Wales in 2012, and as in previous years, the majority (just over two-thirds) of these deaths were in males.
All figures are based on deaths registered in a particular calendar year, and out of the 2,597 drug-related
deaths registered in 2012, 1,358 (just over half) occurred in years prior to 2012.
There were 1,706 male drug poisoning deaths (involving both legal and illegal drugs) registered in 2012, a
4% decrease since 2011, and the lowest since 1995.
Female drug poisoning deaths have increased every year since 2009, reaching 891 in 2012. An increase of
1% since 2011, and the highest since 2004.
3
Deaths Related to Drug Poisoning in England and Wales, 2012 (ONS, 2013)
Page 20 of 52 The number of male drug misuse deaths (involving illegal drugs) decreased by 9% from 1,192 in 2011 to
1,086 in 2012; female deaths decreased by 1% from 413 in 2011 to 410 in 2012.
In 2012 males aged 30 to 39 had the highest mortality rate from drug misuse (97.8 deaths per million
population), followed by males aged 40 to 49 (85.9 deaths per million population). The male mortality
rates in these two age groups were significantly higher than the rates in all other age groups and much
higher than females of any age.
As with males, the highest rates for females were among those aged 30 to 39 and 40 to 49 (28.9 and 28.7
deaths per million respectively), and these rates were significantly higher than the rates in other age
groups.
Over half (52%) of all deaths related to drug poisoning involved an opiate drug, and in men aged 30 to 39,
nearly two thirds (63%) of drug-related deaths involved an opiate. In 2012, as in previous years, the most
commonly mentioned opiates were heroin and/or morphine, which were involved in 579 deaths.
The number of deaths involving heroin/morphine fell slightly in 2012 to 579 deaths, but these remain the
substances most commonly involved in drug poisoning deaths.
The number of deaths involving tramadol have continued to rise, with 175 deaths in 2012 – more than
double the number seen in 2008 (83 deaths).
Deaths Involving new psychoactive substances (sometimes referred to as ‘legal highs’) such as
mephedrone have increased sharply - from 29 deaths in 2011 to 52 deaths in 2012. However, the number
of deaths from new psychoactive substances are still much lower than the number of deaths from
heroin/morphine.
In England, the North West had the highest mortality rate from drug misuse in 2012 (41.0 deaths per
million population).
Table 6: Number of deaths from drug-related poisoning and drug misuse for England and Wales (2008-2012)
Number of deaths from drug-related poisoning and drug misuse, by sex, England
and Wales, deaths registered between 2008–20121,2,3
Registration All drug poisoning Drug misuse
year Males Females Males Females
2008 2,075 853 1,506 435
2009 2,098 780 1,510 364
2010 1,890 857 1,382 402
2011 1,772 880 1,192 413
2012 1,706 891 1,086 410
1 Cause of death was defined using the International Classification of Diseases, Ninth
Revision (ICD-9) for the years 1993 to 2000 and Tenth Revision (ICD-10) from 2001
onwards. The underlying cause of death codes used to select 'all drug poisonings' and
'drug misuse' deaths are shown in Box 1 on the Definition page. Drug misuse as defined
by the current headline indicator shown in Box 2 on the Definition page. Deaths from drug
misuse are included in the figures for all drug poisoning.
2 Figures for England and Wales include deaths of non-residents.
3 Figures are for deaths registered, rather than deaths occurring in each calendar. Due to
the length of time it takes to complete a coroner’s inquest, it can take months or even
years for a drug-related death to be registered. More details can be found in the 'deaths
related to drug poisoning' statistical bulletin: www.ons.gov.uk/ons/rel/subnational-
health3/deaths-related-to-drug-poisoning/2012/stb---deaths-related-to-drug-poisoning-
2012.html
Source: Office for National Statistics
Page 21 of 52Age-specific mortality rates for deaths related to drug misuse
Males
In 2012, males aged 30 - 39 had the highest mortality rate from drug misuse (97.8 deaths per million
population), followed by males aged 40 - 49 (85.9 deaths per million population). The male mortality rates in
these two age groups were significantly higher than the rates in all other age groups and much higher than
females of any age.
Although males aged 30 - 39 had the highest mortality rate, this has declined sharply in recent years and is
now at its lowest level since 1998. The male mortality rate in 40 - 49-year-olds has also declined since its peak
in 2009, but not as steeply as the decline seen in 30 - 39-year-olds.
Mortality rates in younger males continued their downward trend and are now at their lowest level since
records began (2.5 and 47.6 deaths per million population in 2012 for under 20s and 20 - 29-year-olds
respectively).
Mortality rates in males aged 50 - 69 increased significantly between 1998 and 2010, but have remained stable
since then, with 24.1 deaths per million population in 2012.
Male mortality rates in the oldest age group (70 and over) have shown no consistent trends over time and
remained low in 2012 with 7.3 deaths per million population.
This pattern of drug misuse deaths is broadly in line with treatment figures from Public Health England (PHE –
previously the National Treatment Agency), which showed that as the drug-dependent population ages, the
over 40s have become the largest age group starting treatment. In contrast, the number of 18 - 24-year-olds
newly entering treatment for heroin and crack use has halved over the last five years.
Figure 11: Age-standardised mortality rates for selected substances, males, deaths registered in 2008–2012, England and
Wales
Source: ONS
Page 22 of 52Females
In 2012, mortality rates from drug misuse for females were lower than males in every age group, except those
aged 70 and over, where rates were very similar in men and women. As with males, the highest rates were
among those aged 30 - 39 and 40 - 49 (28.9 and 28.7 deaths per million population respectively), and these
rates were significantly higher than the rate in other age groups.
Unlike in males, where the mortality rate fell in 30 - 39 and 40 - 49-year-olds, the female mortality rates in
these age groups remained stable in 2012.
The female mortality rate for 50 - 69-year-olds has increased steadily over the last few years and is now at 15.7
deaths per million population – its highest level since records began in 1993.
The opposite trend is seen in females aged 20 - 29, where the mortality rate has decreased significantly from
18.9 deaths per million population in 2008 to 10.7 per million in 2012. These trends mean that the female
mortality rate in 20 - 29-year-olds is now slightly lower than the rate in 50 - 69-year-olds.
As with males, the lowest female mortality rates in 2012 were in those aged under 20 (1.2 deaths per million
population) and 70 and over (7.9 deaths per million population).
Figure 12: Age-standardised mortality rates for selected substances, females, deaths registered in 2008–2012, England and
Wales
Source: ONS
Page 23 of 52Table 7: Demographic characteristics of 'drug misuse' deaths reported to np-SAD panel of Coroners’ areas (2002-2011)
Source: International Centre for Drug Policy, 2013
Number of drug-related deaths by underlying cause in England and Wales
In January 2011, ONS introduced a new version of ICD-10. This means figures for 2011 onwards will not be
directly comparable with figures for 2001 to 2010.
In both males and females the largest proportion of drug-related deaths were from accidental poisonings (65%
of all drug poisoning deaths in males and 49% in females).
In males the number of accidental poisonings remained virtually unchanged at 1,104 deaths in 2012.
In females, accidental poisonings decreased slightly from 445 to 437 deaths between 2011 and 2012, a 2%
fall.
There were substantial increases in the number of deaths from accidental poisonings between 2010 and 2011,
which were almost certainly due to the introduction of ICD-10 v2010.
In females, just under half of all drug poisoning deaths were suicides (defined as intentional self-poisoning
or poisoning of undetermined intent). In 2012, the number of female drug-related suicides increased
slightly, from 418 deaths in 2011 to 422 deaths in 2012; this continues the upward trend that has been
seen since 2009.
In males, 31% of all drug poisoning deaths were suicides. The number of deaths went down from 576 to
525 deaths between 2011 and 2012 – a 9% decrease. This reverses the large increase seen in 2011, and
the number of drug-related male suicides in 2012 were similar to the levels seen between 2006 and 2009.
Page 24 of 52 In males the number of deaths where the underlying cause was a mental and behavioural disorder due to
drug use reduced by 16%, from 86 deaths in 2011 to 72 in 2012.
In females, the equivalent number increased 70%, from 17 deaths in 2011 to 29 in 2012. It is not clear
what has caused this increase in females, and it may just be a random fluctuation, rather than the start of
an upward trend.
Table 8: Male drug-related poisonings
Number of deaths from drug-related poisoning by underlying cause, males, England and Wales, deaths
registered between 1993–20121,2,3,4
Males
Underlying cause of death 2008 2009 2010 2011 2012
All drug poisoning deaths 2,075 2,098 1,890 1,772 1,706
Mental and behavioural disorders due to drug use (excluding alcohol 705 586 504 86 72
and tobacco)
Accidental poisoning by drugs, medicaments and biological 861 983 899 1,107 1,104
substances
Intentional self-poisoning and poisoning of undetermined intent, by 500 524 482 576 525
drugs, medicaments and biological substances
Assault by drugs, medicaments and biological substances 9 5 5 3 5
1 Cause of death was defined using the International Classification of Diseases, Ninth revision (ICD-9) codes given in Box 1 in
the Definition page for the years 1993-2000 and Tenth Revision (ICD-10) codes from 2001 onwards.
2 In January 2011 ONS introduced a new version of ICD-10, so figures for 2011 onwards are not directly comparable with
figures for 2008–10. More information can be found in last year’s drug-related deaths statistical bulletin:
www.ons.gov.uk/ons/rel/subnational-health3/deaths-related-to-drug-poisoning/2011/stb-deaths-related-to-drug-poisoning-
2011.html#tab-ICD-coding-changes-implemented-in-2011.
3 Figures for England and Wales include non-residents.
4 Figures are for deaths registered, rather than deaths occurring in each calendar. Due to the length of time it takes to complete
a coroner’s inquest, it can take months or even years for a drug-related death to be registered. More details can be found in the
'deaths related to drug poisoning' statistical bulletin: www.ons.gov.uk/ons/rel/subnational-health3/deaths-related-to-drug-
poisoning/2012/stb---deaths-related-to-drug-poisoning-2012.html
Source: Office for National Statistics
Table 9: Female drug-related poisonings
Number of deaths from drug-related poisoning by underlying cause, females, England and Wales, deaths
registered between 1993–20121,2,3,4
Females
Underlying cause of death 2008 2009 2010 2011 2012
All drug poisoning deaths 853 780 857 880 891
Mental and behavioural disorders due to drug use (excluding
139 101 96 17 29
alcohol and tobacco)
Accidental poisoning by drugs, medicaments and biological
327 305 369 445 437
substances
Intentional self-poisoning and poisoning of undetermined
385 374 391 418 422
intent, by drugs, medicaments and biological substances
Assault by drugs, medicaments and biological substances 2 0 1 0 3
1 Cause of death was defined using the International Classification of Diseases, Ninth revision (ICD-9) codes given in Box 1 in the
Definition page for the years 1993-2000 and Tenth Revision (ICD-10) codes from 2001 onwards.
2 In January 2011 ONS introduced a new version of ICD-10, so figures for 2011 onwards are not directly comparable with figures
for 2008–10. More information can be found in last year’s drug-related deaths statistical bulletin:
www.ons.gov.uk/ons/rel/subnational-health3/deaths-related-to-drug-poisoning/2011/stb-deaths-related-to-drug-poisoning-
2011.html#tab-ICD-coding-changes-implemented-in-2011.
3 Figures for England and Wales include non-residents.
4 Figures are for deaths registered, rather than deaths occurring in each calendar. Due to the length of time it takes to complete a
coroner’s inquest, it can take months or even years for a drug-related death to be registered. More details can be found in the
'deaths related to drug poisoning' statistical bulletin: www.ons.gov.uk/ons/rel/subnational-health3/deaths-related-to-drug-
poisoning/2012/stb---deaths-related-to-drug-poisoning-2012.html
Source: Office for National Statistics
Page 25 of 52You can also read