BLM's Lotic Assessment, Inventory, and Monitoring (AIM) Data Management and Quality Assurance and Control Protocol - 2020 Field Season
←
→
Page content transcription
If your browser does not render page correctly, please read the page content below
BLM’s Lotic Assessment, Inventory,
and Monitoring (AIM)
Data Management and Quality
Assurance and Control Protocol – 2020
Field Season

VERSION 3.2

Produced by BLM National Operations Center (NOC) and the BLM/USU National Aquatic
Monitoring Center (NAMC) – 8/13/2020

                                                                                    1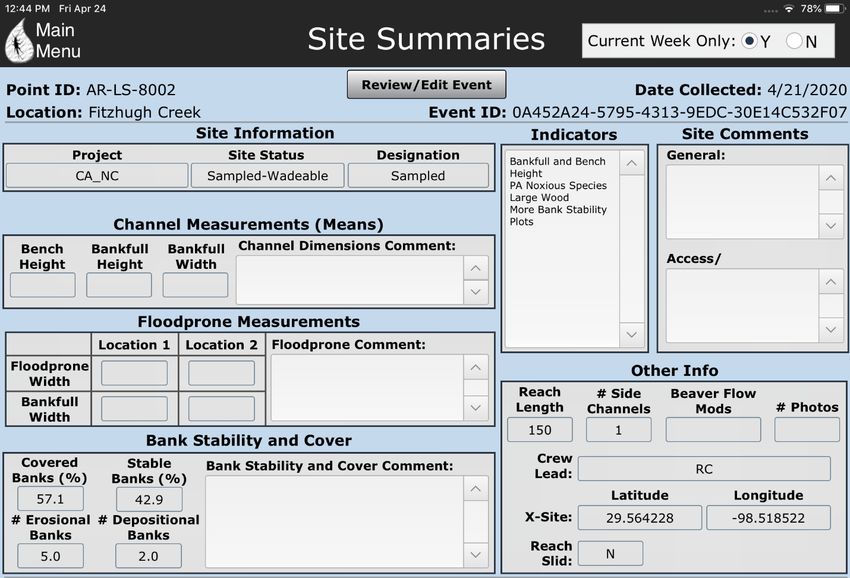
Contents
PROTOCOL OVERVIEW ............................................................................................................. 3
STEP BY STEP DIRECTIONS...................................................................................................... 5
   Step 1 – Field Training and Orientation ..................................................................................... 5
   Step 2 – Collect Data ................................................................................................................ 10
   Step 3 – Backup Data ................................................................................................................ 12
   Step 4 – Submit Final Data ....................................................................................................... 14
   Step 5 – Update Evaluation Status ............................................................................................ 15
   Step 6 – Review Photos and Data Summary ............................................................................ 17
   Step 7 – Resolve Errors in Error Log........................................................................................ 21
   Step 8 – Review Indicators ....................................................................................................... 23
   Step 9 – Check-in and Project Close-out .................................................................................. 26
APPENDIX A. COMMENT PROTOCOL .................................................................................. 31
APPENDIX B. ESTIMATION PROTOCOL............................................................................... 34

                                                                                                                                          2
PROTOCOL OVERVIEW
The purpose of this protocol is to detail steps for managing data and assuring data quality (i.e.,
data quality and assurance procedures) during the field season (Figure 1). The protocol describes
nine steps and includes responsible parties and required files and tools for each step.
Figure 1. Nine steps during the field season for managing data and assuring data quality. Steps
are color coded by responsible parties and the timeframe for completing.
3Users should consult this protocol for data collection, management, and ensuring data quality.
Refer to the Technology and Application Manual for details on how to use data collection tools
such as SARAH and Collector . If questions remain after reading this protocol, the Lotic
Technology and Applications Manual, or the Evaluation and Design Management Protocol,
please reach out to your contract lead, BLM Project Lead, or State Lead. If you need additional
support, please contact the appropriate National AIM Team member:
• Design related questions: Nicole Cappuccio (ncappuccio@blm.gov; 303-236-6112)
• General project coordination and implementation support: State Lead and Kate Lunz
(klunz@blm.gov; 303-236-0473)
• Field data collection questions (e.g., SARAH and protocol): Logan Shank
(lshank@blm.gov; 303-236-1161)
• Technology and applications questions (e.g., Teams, Collector, Box, Companion): Jacob
Shipman (jshipman@blm.gov; 303-236-0476)
• If someone from the list above is not available and there is an immediate issue please
contact Jennifer (jennifer.courtwright@usu.edu; 985-502-7530), Nicole Cappuccio, or
Scott Miller (swmiller@blm.gov; 720-545-8367)
4STEP BY STEP DIRECTIONS
Step 1 – Field Training and Orientation
Overview
The National AIM Team leads annual lotic AIM field methods trainings following TR 1735-2
Version 2, which include pre-training online coursework. The main objective of this field-based
training is for participants to be proficient in the application of AIM lotic core and contingent
field methods. Training requirements vary among participants and include:
• Contractor/agreement staff must complete online training materials before attending field
methods training.
• Contractor/agreement staff responsible for data collection must have successfully
completed lotic AIM field methods training during the year in which data will be
collected.
• Contractor/agreement staff responsible for Multiple Indicator Monitoring (MIM) data
collection must have successfully completed MIM training within the last two years.
Furthermore, the field botanist must be proficient in species level identification of
riparian plants including difficult taxa (e.g., Salix and graminoids such
as Cyperaceae, Juncaceae, and Poaceae).
• Project leads overseeing data collection should attend the first 3.5 days of field methods
training at least one out of three years and should review protocol updates every year.
• BLM personnel collecting data must have successfully completed lotic AIM field
methods training within the last two years and should review protocol updates and
training materials every year.
Field training cannot fully introduce individuals to the diversity of stream types present on BLM
lands and so a local orientation to critical geomorphic concepts and riparian vegetation is
required. Two field orientation activities are recommended depending on BLM Project Leads
and contractor staff availability and expertise. At a minimum, Field Orientation Activity #1
(Field Tour Critical of Concepts and Protocol Review) is required.
Similarly, field calibration is an important quality assurance step. The purpose of field
calibration is to: 1) ensure the precision of collected data among field technicians; 2) assess the
accuracy of collected data to the ‘known truth’ established by BLM and/or contractor staff; and
3) provide supplemental training opportunities for field technicians. Calibration occurs twice
during field methods training, but similar calibration in local streams where data will be
collected is critical for ensuring protocols are mastered and properly applied to local systems.
Responsible Parties
Field training: The National AIM Team develops and leads content delivery for field
methods training and State and Project Leads are recruited to host and/or serve as trainers. BLM
project leads, contractor management staff (if applicable), field crews, and other BLM and
contractor staff are required to attend as specified in the overview above.
Field orientation and calibration: BLM project leads, contractor management staff (if
applicable), field crews, and other BLM and contractor staff as appropriate or available. Ideally,
subject matter experts in hydrology, geomorphology, and riparian vegetation would be present.
5When and Estimated Time
Field training: Attend a weeklong field training conducted annually in late spring and early
summer.
Field orientation and calibration: Occurs after field training on TR 1735-2 Version 2 and prior
to the start of data collection. It is recommended that field calibration be repeated any time crews
switch to new areas that possess unique hydrologic, geomorphic, or vegetative conditions from
that which they have been oriented and working. Field orientation takes 1 – 2 days and
calibration ½ to a full day.
Tools and Files
• Lotic Field Protocol for Wadeable Systems TR 1735-2 Version 2
• Lotic Field Protocol for Wadeable Systems TR 1735-2– Changes
• Pre-training videos and quizzes
• Lotic Master Gear List
• Local riparian vegetation identification guides (See state specific Teams channel)
• Post-training calibration data forms
Instructions
Field training
A. Watch pre-training videos and complete video-based quizzes and activities
B. Attend training
C. Complete two calibration exercises while at training
Field Orientation Activity #1 - Field Tour of Critical Concepts and Protocol Review
A. Tour a variety of stream systems that represent the hydrologic, geomorphic, and riparian
vegetation diversity crews will encounter throughout the field season. At a minimum,
visit three different systems, but the more the better!
B. At each of the visited systems, conduct the following exercises:
I. Work as a group to walk the reach and identify:
a. Scour line height
b. Bankfull height
c. Bench height
Review protocol section 2.2 and discuss what features were helpful indicators of
scour, bankfull, and bench height versus unhelpful. Encourage crew members
responsible for data collection to lead these discussions.
II. Review priority noxious and native woody vegetation at each system.
III. Walk the reach to review the protocol related to bank stability and cover.
Specifically, have the crew identify:
a. Erosional and depositional banks
b. Covered and uncovered plots
6c. Erosional features (fracture, slumps, sloughs, vertical banks)
IV. Walk the reach to identify 3 – 4 pools. For each pool have the crew identify or
measure:
a. Pool tail
b. Pool head
c. Max pool depth
d. Pool length
V. If measuring greenline vegetation composition, review greenline location and
riparian plant species at each of the visited systems with the field botanist.
a. Ideally at least one BLM staff or contractor present would have
knowledge of local riparian vegetation and the MIM greenline vegetation
protocol. If so, work with the crew field botanist to perform these steps
while other individuals are working on steps c and d.
VI. If the crew is measuring other contingent indicators (e.g., nutrients, turbidity,
bank angle, pool tail fines), ensure they are confident in the application of
protocols to local systems.
C. At the conclusion of the field tour, review major discussion points and reiterate any
protocol application clarifications or corrections. If questions or clarifications exist for
the National AIM Team, capture those and identify who is reaching out to continue the
conversations.
Field Orientation Activity #2 – Photo Review
A. Locate past stream and river system photos taken during AIM, MIM, PFC or other field
inventory, assessment, and monitoring activities. Photos should represent the diversity of
stream and river systems the crews will encounter.
I. AIM photos can be found on Box. To facilitate easy searching of these photos, the
National AIM Team has created a Box account for general lotic AIM use.
II. To access this account and photos, go to https://account.box.com/login and log in
using aim.aquatics@gmail.com as the username and stonefly2020 as the
password.
III. Photos are stored by project/field office and year and named with the PointID.
Within the “Older images” folder, navigate to the desired project folder and type
the PointID in the top search bar.
B. Review photos with crews to identify and discuss critical geomorphic concepts – scour
line height, bankfull height, and bench height.
C. Have field technicians annotate 3 – 5 photos with critical concept heights (Section 10.4)
and bank stability and cover plot locations (Section 10.5), as they would for sampled lotic
AIM reaches.
7Calibration
A. Identify a stream reach having representative hydrologic, geomorphic, and vegetative
conditions similar to those the crew will be working with. If the crew is working among
multiple field offices or districts, more than one field calibration might be required.
I. Do not calibrate on the same system used for field orientation activities.
B. Do not discuss critical concepts or other aspects of the sample reach with field
technicians prior to conducting calibration exercises.
C. Set up 5 transects for field technicians to perform calibration.
I. Guidance from Section 4.0 of TR 1735-2 Version 2 – Setting Up the Reach does
NOT need followed for this exercise. Rather, optimize transect locations for:
a. Diversity of bank types
b. Presence of pools and large wood in the reach (Not all reaches will have
large wood, but try to select reaches with pools. If wood is not present,
consider staging logs in the stream or measuring on uplands)
c. Riparian plots containing priority noxious and/or native woody species
D. Have field technicians work in groups of two or three to perform the following
measurements:
I. Bankfull and wetted width (Section 7.1)
II. Bankfull and bench height (Section 7.2)
III. Thalweg depth – at main transects only (Section 7.2.1)
IV. Bank stability and cover (Section 7.3)
V. Large wood (Section 7.6)
VI. Pools dimensions (Section 7.7)
VII. Flood-prone width for a single representative riffle (Section 7.9)
VIII. Priority noxious and priority native woody vegetation (Section 8.0)
IX. Bank angle (contingent) (Section 7.11)
X. Pool tail fines (contingent) (Section 7.8)
All calibration data should be collected on the provided paper data forms.
E. BLM and contractor staff (i.e., trainers) work together to take their own measurements
for each of the above measurements and take photos of all transects and plots.
F. BLM and contractor staff review results with crews and provide course corrections.
I. Table 1 provides a guide for the desired level of precision among repeat
measurements. Use these values as a starting point for when transects and/or
plots should be revisited and differences discussed.
II. Crew values should be compared to “trainer” values, but keep in mind that we do
not know the truth and any differences should be discussed and consensus
achieved.
G. Crew and BLM and contractor staff results and pictures should be uploaded to Teams.
Pictures of field forms are welcomed.
8Table 1. Desired level of precision among repeat measurements taken as a part of calibration
exercises. Use these values as a guide to determine when transects and/or plots should be
revisited and differences in results discussed. Percent differences are to be assessed
individually for each measurement per transect unless otherwise noted in relation to trainer
values.
Measurement Precision among repeat measurements
Wetted width ≤10%
Bankfull width ≤10%
Bankfull height ≤15%
Bench height ≤15%
Thalweg depth ≤15%
Bank type1 90% of assessed plots in correct category
Bank cover1 90% of assessed plots in correct category
Bank erosional feature1 90% of assessed plots in correct category
Bank cover categories ≤10%
# of pools2 0 – 5 pools +/- 1; 6 – 10 pools +/- 2; > 10 pools +/- 3
Max pool depth ≤15%
Pool tail depth ≤15%
Pool length ≤10%
Large wood (# of pieces) 3 ± 1 or 15%, whichever is greatest
Flood-prone height ≤15%
Flood-prone width ≤10%
Bank angle ≤10o
Pool tail fines ± 2 or 15% of intersections, whichever is greatest
Priority noxious All priority noxious species identified in all plots
Priority native woody All priority noxious species identified in all plots
1
Assess bank type, cover, erosional features, individually for each plot, but then compute the
percent correct among the 10 assessed banks.
2
Total number of pools observed throughout the reach
3
Percent difference is assessed across all measurements taken throughout a calibration
reach. For example, if 5 pieces of qualifying large wood were observed throughout the
reach, acceptable crew values for large wood would be between 4 and 6 qualifying pieces.
9Step 2 – Collect Data
Overview
Electronic data collection and submission is centrally managed by the National AIM team. The
Stream and River Assessment Hub (SARAH) is used to collect field data and Collector is used
for navigating to points and to record which points were field visited. Use of SARAH and
Collector are part of field training, but proficiency is only gained through consistent use. To
prevent information overload when learning the field protocol, we recommend that first time
users watch the Collecting Data with SARAH and Data Backup and Submission pre-training
videos, following along with an iPad if possible. Detailed instructions on using SARAH and
Collector can be found in the Lotic Technology and Applications Manual. Best data entry
practices and requirements are detailed below.
Responsible Parties
Field Crew
When and Estimated Time
Data collection should occur when water levels are at baseflow between June 1 and September
30, with exceptions for climatic conditions that preclude data collection during this time. Data
collection takes 4-8 hours per reach.
Tools and Files
• Lotic Master Gear List
• Lotic Field Protocol for Wadeable Systems TR 1735-2 Version 2
• Local riparian vegetation identification guides
• Paper copies of field data collection forms
• Macroinvertebrate and water quality labels
• iPad
• SARAH application
• Collector application
Instructions
A. Record field evaluation and reach statuses using Collector.
B. Record all field data in SARAH including photos and GPS coordinates.
I. Pay attention to app warnings and checks. Some warnings will not let you move
on, while others will. If values are left after being warned, comments should be
made (see Appendix A for more information).
II. Follow the Comment and Estimation protocols in Appendices A and B to make
comments and estimate values where appropriate. Do NOT make extraneous
comments. Only estimate values where allowed and flag any estimated or suspect
values as “E”.
III. Appropriately mark what data was not collected vs. zeros
a. Zeros are data too! Refer to the Lotic Technology and Applications
Manual for how to fill out 0s for many fields at once to ease data entry for
things like large wood.
b. Make sure all fields are filled in or flagged “N” for not collected.
10IV. Review all errors in the “Final QA page”
a. Outlier checks
1. Bankfull width and height and bench height are especially
important measurements and should be determined using relatively
continuous surfaces throughout the reach. Therefore, there should
be minimal variation in these measurements unless valley
geomorphology also changes.
2. At the end of a reach, SARAH calculates the mean and standard
deviation of bankfull width, bankfull height, and bench height
across all transects. Any values that are outside 2 standard
deviations of the mean are flagged with hyperlinks.
3. For any outliers that appear, think back to the channel dimensions
at the transect. Was there a constraining feature such as a hillslope
that caused the channel to change shape partway throughout the
reach? Verify that you did not use a local feature that was not
continuous throughout multiple transects to determine channel
dimensions.
4. Re-measure, omit, or flag the value if you do not feel confident in
the measurement.
5. Note reasons for any remaining outliers in the final confirmation
page.
b. Final missing data checks
1. Any remaining blank fields not flagged as “Not Collected” will
appear on this screen and users should resolve these errors
following the guidance above.
2. If one or more PHAB transects were not completed, classify the
reach as “partial” and note how many PHAB transects were not
collected and the reach length for PHAB. This reach length is used
for calculating sinuosity and should match the corresponding
bottom of reach and top of reach coordinates.
V. Exit out of a site and go back to the main menu to initiate automatic data backup
on the iPad.
C. If electronic data collection is impossible (e.g., iPad battery dies), record all data on paper
datasheets and then enter into SARAH at a later date. All data must be entered into
Collector or SARAH for the National AIM Team to ingest it into AquADat. Additionally,
photos should be taken of paper datasheets and sent to the National AIM Team.
11Step 3 – Backup Data
Overview
The crew will need to backup both SARAH and Collector data during each trip whenever
internet access (4G or Wi-Fi) is available. Backups will allow data recovery if, for example, the
iPad is lost or stolen. Uploading files to Teams or external backup USB drives can be used as
alternative backup methods until better internet can be obtained or if issues occur with the
SARAH or Collector backup processes.
Responsible Parties
Field Crew
When and Estimated Time
Preferably this occurs daily after every sample reach, but it MUST occur after every two reaches.
How long data backup takes depends on internet connection. With a reasonable internet
connection speed, two reaches should take ~15-30 min to backup. However, photos may take ~ 1
hour to backup all photos depending on the number and internet speed. If there is a poor internet
connection, backing data up on USB drives will be considerably faster (i.e., 1-2 min). However,
data will need to be backed up eventually using the internet prior to submitting final data.
Tools and Files
• SARAH
• Collector
• Teams
• External USB drive
• Photos on Box
Instructions
A. Sync field visit information to the Office Webmap using Collector
B. Backup SARAH field data
I. Back up data to the National AIM team servers. Use the “Upload Data via WiFi”
button on the SARAH main menu to do this.
a. At a minimum, backup all XML field data
b. If internet connections allow, also back up photos. After backing up
photos, they should appear on Box within a few hours, but at most within
a day.
II. You will receive a success or failure message. If you receive a failure message,
try again ensuring that you have a good internet connection.
III. If there are errors with XML data, use “View Upload Status and Confirm Final
Data” button within SARAH to determine which files did not upload. Then
manually backup files by uploading them to your project folder on Teams or if
concerns exist about internet connections, back up data to an external USB drive.
Send an email with the file(s) location and a description of the problem to Logan
Shank (lshank@blm.gov).
IV. If there are errors with photos, identify which photos were not uploaded
successfully by reviewing uploaded photos on Box. Log into
12https://account.box.com/login or the Box application on an iPad with
aim.aquatics@gmail.com as the username and stonefly2020 as the password. If
photos are missing, use the “Export Photos” button within the “View Photos”
main menu button to export photos. Then follow the above directions and
instructions in the Technology and Application Manual to upload any problem
files to Teams or an external USB drive.
13Step 4 – Submit Final Data
Overview
Crews should submit final data as soon as the trip is finished and an internet connection can be
obtained using the SARAH and Collector applications. Confirming data as final will notify the
National AIM Team that data is ready for additional review by project leads and crew managers.
The National AIM Team will NOT process data unless it has been confirmed as final so make
sure that this is completed for all reaches!
Responsible Parties
Field Crews
When and Estimated Time
Data should be submitted after each trip. This should only take 15-30 minutes, but it could take
longer if photos have not been backed up recently.
Tools and Files
• SARAH
• Collector
• Teams
Instructions
A. Field data should be submitted as final using the “View Upload status and Submit Final
Data” button in SARAH. Note all data for a reach including photos must be first
Uploaded via Wi-Fi before it can be confirmed as final.
B. Upload the Data Summary csv from SARAH to Teams so that project leads and crew
managers can review it.
C. In Collector, record that field data was submitted as final for each field visit. Then resync
the field visit to the Office Webmap
D. Please make sure to complete the above steps as frequently as possible. If a crew has
more than one trip worth of backed-up but unfinalized data, the National AIM team will
record this as an error in the Error Log (see Step 7 below).
14Step 5 – Update Evaluation Status
Overview
The ‘Eval Status’ in the Points layer of the Office Webmap tracks which reaches have been
sampled or not. This status and the ‘Reason Not Sampled” (if applicable) will need to be updated
after a crew field visits a point. This step overlaps with the Evaluation and Design Management
Protocol Step 6. This is an iterative step in design management throughout the field season but is
also relevant for data management. Updating evaluation statuses in the Office Webmap ensures
that the crew is sampling the correct reaches and that the design is being implemented and
tracked properly and consistently.
Responsible Parties
Project leads and crew managers
When and Estimated Time
Evaluation status should be updated after each trip, and the process of verifying and updating
statuses should take less than 30 min per trip.
Tools and Files
• Office Webmap
• Teams
• Data summary on Teams or on the iPad
• Photos on Box
Instructions
A. Field evaluation statuses for all visited points should be recorded in both the webmap and
the data summary. Navigate to your project on Teams to find the Data Summary csv. If it
is not there, follow up with the crew to make sure they uploaded it to the correct folder.
Check that all records in the data summary have a matching record in the Office Webmap
Field Visits layer. Review the Field Visits layer ‘FinalDataSubmitted’ column to ensure
all data from the past trip was submitted as final to the National AIM Team.
B. Ensure the crew visited the correct location and did not incorrectly move the point
coordinates. The ‘PointMoved’ column in the data summary indicates if the point was
moved and the design and sampled coordinates can be viewed on the Office Webmap.
See section 3.2.2 in TR 1735-2 for guidance on moving the point coordinates.
C. Ensure that you agree with the crew’s field evaluation status after reading comments and
reviewing photos. To view photos in Box, go to https://account.box.com/login and log in
using aim.aquatics@gmail.com as the username and stonefly2020 as the password.
Photos are organized by project and year. They can be searched for by typing the PointID
in the top search bar (using double quotes ensures an exact match). There should be
photos for all visits to a reach even if it wasn’t sampled.
I. Common errors are misclassifying not sampled points (e.g. dry vs. inaccessible)
or not properly recording partially sampled reaches. Ensure that partially sampled
reaches are limited to instances where some transects are truly inaccessible.
Targeted points should rarely, if ever, have a field evaluation status of ‘partially
15sampled’. Partially sampled reaches should not make up more than 10-15% of
sampled random points.
II. If you agree with the status, then update the ‘Eval Status’ in the Points layer to
match that of the Field Visits layer or to the corrected ‘Eval Status’ if you
disagreed with the crew’s status mark as a Reattempt or update appropriately in
the ‘Eval Status’ in the Point layer. See the Evaluation and Design Management
Protocol Step 6 for detailed instructions on how to do this.
D. Record any errors found in A-D in the error log and follow up as needed with the crew.
See step 7 for more details on how to fill out the error log.
16Step 6 – Review Photos and Data Summary
Overview
Within a week after a trip, project leads and/or crew managers should review photos and the data
summary generated by SARAH for all sampled reaches. This does NOT need to be done prior to
submitting final data. The National AIM team has identified concepts that are most error prone
and are the highest priority for addressing with the crew prior to additional data collection. This
high priority data is included in a csv file that crews save to Teams and contains data related to
the following concepts: 1) Critical concepts, 2) Flood-prone width, 3) Bank cover and stability
and 4) Special situation protocols. After reviewing the data and corresponding photos project
leads and/or crew managers should contact the crew to discuss any issues and record them in the
Error Log (See Step 7 below).
Responsible Parties
Project leads and crew managers
When and Estimated Time
Review should occur after each trip and may take 1-2 hours.
Tools and Files
• Photos on Box
• Teams
• Data summary on Teams or on the iPad
• Error Log table
Instructions
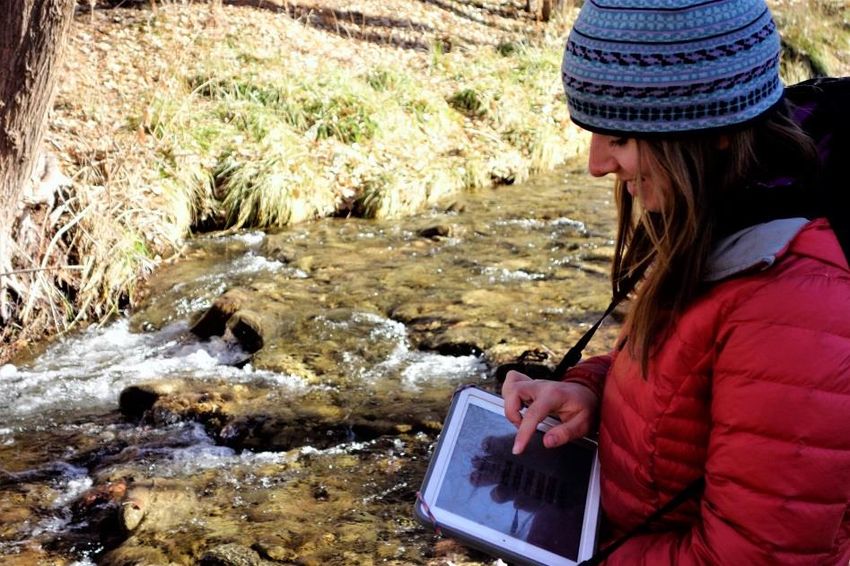
Data summaries and photos can be viewed in two different ways: on a computer or on the iPad.
• The Site Summary page within SARAH (Figure 2) can be easier to review data than in a
csv format on a desktop computer, while photos might be easier to view on a desktop
computer with multiple screens.
• If viewing files on a desktop computer, navigate to your project on Teams to find the
Data Summary csv. To view photos in Box, go to https://account.box.com/login and log
in using aim.aquatics@gmail.com as the username and stonefly2020 as the password.
Photos are organized by project and year. They can be searched for by typing the PointID
in the top search bar.
• If viewing files on the iPad, use the “View Site Summaries” button within SARAH to
view the Data summary. To view photos, log into the Box application using the above
credentials and then view and search for photos.
17Figure 2. Site summary page in SARAH that can be used to review crew data in relation to
photos and local knowledge following each trip.
A. Ensure the correct core and contingent methods and resulting data were collected. The
field methods to be collected are specified in the contingent method specific columns or
Supplementals column in the Points layer of the Office Webmap. The ‘IndicatorsUsed’
column in the data summary specifies which contingent indicators were actually
collected, but will not list selected supplementals.
B. Ensure that critical concept, flood-prone width, and bank cover, and stability photos were
taken and uploaded to Box for each reach. If photos are missing, check that the number of
photos on Box matches the number recorded in the csv.
I. If the number of photos does not match, have the crew try the following
troubleshooting steps:
a. Reupload photos with a better internet connection.
b. Ensure the proper PointID was selected before uploading photos and if not
check for photos under the PointID originally used.
c. Export photos using the “View Photos” button in the appand send the
project lead/ crew manager these exported photos.
d. Contact the National AIM Team for further troubleshooting and to upload
missing photos to Box.
C. Critical concepts – Scour line, bankfull, and bench heights
18I. Determine if scour line, bankfull, and bench heights are correct on the annotated
photos. Do the heights correctly correspond to recorded data in the csv or other
local knowledge such as gage data?
II. If there are questions about any of the lines or critical concepts data, reference the
field protocol and ask the crew the following questions:
a. What features from section 2.2.3 (Identifying Scour Line) were used to
identify scour line?
b. What features from section 2.2.1 (Identifying Bankfull) did the crew use
to identify bankfull?
c. Was the guidance in section 2.2.2 properly used to identify bench height?
III. If any issues were identified during the above review or discussion, record the
error in the Error Log (See Step 7 below). Possible outcomes are:
a. Critical concepts were slightly off, but no major changes are needed.
Protocol is clarified for the crew for future reaches.
b. Scour line placement was incorrect:
1. Bank stability and cover data at a minimum may need to be
omitted but see bank stability and cover section below.
2. The rest of physical habitat data for the reach may be suspect;
Consult the National AIM Team for next steps.
c. Bankfull placement was incorrect:
1. Bankfull height can be inferred from bench height (i.e., bankfull
heights should be replaced with the data recorded for bench
height). If this is the case, consider how wrong bankfull widths are.
If bankfull widths, would be drastically different, physical habitat
data for the reach may be suspect; Consult the National AIM Team
for next steps.
2. Bankfull is incorrect and can’t be inferred from other data.
Physical habitat data for the reach may be suspect; Consult the
National AIM Team for next steps.
d. Bench placement was incorrect:
1. Bench height should be changed to equal bankfull height.
2. Bench height was incorrect and should be omitted.
D. Flood-prone width
I. Did the crew take flood-prone width in two representative riffles parallel to the
valley? If locations are not representative, record incorrect location(s) in the Error
Log so the National AIM Team can review and possibly omit this data.
II. Review photos and consider if the flood-prone width values make sense given the
observed valley confinement of the reach? If one or both values do not make
sense, consider if the value(s) should be omitted and have a discussion with the
crew to ensure they know how to properly measure flood prone width.
E. Bank stability and cover
I. Did the crew place the plot in the right location (e.g., correct identification of
scour and bankfull features)?
II. Did the crew correctly identify depositional vs. erosional banks?
III. Did the crew correctly estimate cover?
a. Did the crew correctly estimate foliar rather than basal cover?
19b. Did the crew correctly include perennial vegetation (including senesced
vegetation) and exclude annual vegetation as cover?
IV. Did the crew properly identify erosional features (i.e., fracture, slump, slough,
eroding)?
V. If the answer to any of the above questions is no, ensure that the protocol is
clarified for the crew for the future and record one of the following options in the
Error Log for this specific reach:
a. Bank cover data should be omitted.
b. Bank stability data should be omitted.
c. Bank cover and stability data should be omitted.
F. Special situations – Side channels, interrupted flow, partial data, beaver impacts, or
braided channels
I. Review the data summary and photos for evidence that the crew encountered
special situations Review specific photos taken of these special situations and
verify that the crew properly documented these situations using the columns listed
below from the Data Summary.
• Side channels- ‘SideChannelCount’
• Interrupted flow and Partial Data- ‘Designation’
• Beaver impacts- ‘BeaverFlowModifications’
• Braided channels- ‘Channel Dimensions Comment’
II. The best way to ensure the crew is clear on how to implement the applicable
special situations protocol is to have a discussion. Ask the crew if they
encountered any of the above special situations and if they have questions. They
should have at least one question the first time each protocol is implemented. The
following questions could be used to start conversations:
a. Side channels: Were multiple side channels present and if so was it clear
which one to sample? Are you sure there were islands present and that
these were not just mid-channel bars?
b. Interrupted flow: Was it difficult to collect macroinvertebrates and water
quality? Were any concerns about the quality of these samples noted in the
comments?
c. Partially Sampled: Did the crew do everything in their ability to collect all
possible data?
d. Beaver impacts: Was there any question about if this was a lotic vs. lentic
reach?
e. Braided Channels: Was it difficult to set up the reach?
20Step 7 – Resolve Errors in Error Log
Overview
The Error Log is a table a used to track data errors after crew data submission. The National
AIM Team will run checks on raw data and post any errors in this file on a weekly basis. The file
is located within a folder called “QC” on the General Channel of the Field Work team. Project
leads and crew managers will also record any errors found during photo and data summary or
indicator review in this log. At least once a month, project leads and crew managers should
review and resolve errors with the help of the crew. The National AIM Team will review
resolved errors and make data edits once a week.
Responsible Parties
Everyone
When and Estimated Time
Errors should be resolved monthly, but preferably after each trip; There should only be a handful
of errors per trip and it should take less than an hour to investigate errors and resolve them.
Tools and Files
• Error Log table
• Photos on Box
Instructions
General Error Log Use
• The Error Log has two main components:
o Field identified errors in the Field Reported Errors worksheet
▪ This worksheet will be used by all projects and cannot be filtered or
sorted.
o NOC identified errors in Project specific worksheets
▪ These worksheets may be filtered and sorted.
• Teams will show how many users are in the file and where they are. If multiple users are
in the same worksheet:
o Ensure that you are both working in different rows.
o Do not apply any filters because these filters will also filter things for the other
user.
o Always close the file when you are finished or taking an extended break
• Within each tab columns are color coded by who should populate them.
o Green columns are automatically populated and are not editable.
o Orange should be filled out by project leads, crew managers, or crews and are
editable.
o Blue will be filled out by the NOC and are not editable.
• The file can be edited on a computer or iPad. If editing on an iPad, open the document in
Teams and then launch the Excel application. All edits but must be done online.
21• When you are finished recording or resolving your errors, CLOSE the document. If you
leave the document open, it will still show you active in the document and this could
cause problems for others.
Field Identified Errors
If errors are identified during the data summary review by crew managers and/or project leads,
these errors and their resolutions should be recorded using the Field Reported Errors worksheet.
Any errors recorded in this worksheet will be automatically copied over into the project specific
worksheets.
A. Choose your project from the dropdown options.
B. Next be extremely careful to properly enter the correct PointID.
C. Column I, J, and Q (Data Type, Indicator Method Or Field, and Resolution) have
common types of data errors as options in the dropdowns. If these match the error that
you are recording, use these preestablished options. Note you need to first select a data
type for the indicator Method Or Field dropdown to populate. If you do not find an
appropriate option in the dropdown list, you can type in your error.
D. Record today’s date as the Date Reviewed and your name as the IndividualReviewed.
E. If there is a known resolution (e.g. bank cover data should be omitted), fill that in. You
might identify and record an error, but need to follow up with the crew before a
resolution is known.
F. The National AIM Team will review the proposed resolution, record their intended
action (i.e. implementing your resolution) in the NOC Completed Data Edits field
(Column R). Then they will change the resolved column from No to Yes.
NOC Identified Errors
If errors are identified by the National AIM Team while running QC checks on submitted raw
data, the errors will be posted to the Error Log by project which will each appear as its own
worksheet. To review and resolve these errors:
A. Locate your project’s worksheet.
B. Respond to recorded errors in the orange columns (O-Q) by recording the date, your
name and the resolution. Project leads and crew managers should reach out the crew as
needed to clarify the protocol or to determine an appropriate resolution.
C. The National AIM Team will review the proposed resolution, record their intended action
(i.e. implementing your resolution) in the NOC Completed Data Edits field (Column R).
Then they will change the resolved column from No to Yes.
22Step 8 – Review Indicators
Overview
The objective of indicator review is to ensure the accuracy of collected field data and resulting
indicators. Indicators will be calculated and posted once a month for review. Project leads should
review calculated indicators for 2020 data following instructions in Step A. Indicator review
would ideally occur once a month but must be done at least once at the end of the season. Crew
managers may also review calculated indicators as desired. In addition, the National AIM Team
will assess the precision of collected data through time and factors that could confound trend
analyses for any reaches having revisit data (Step B).
Responsible Parties
Project leads, crew managers (optional), and the National AIM Team
When and Estimated Time
Once a month or at least once at the end of the field season; 1-2 hours if done monthly
Tools and Files
• Calculated Indicator Table (located within the “QC” directory on the General Channel of
the Field Work team).
• Photos on Box
Instructions
A. Project leads should use the following guidance to evaluate data in the ‘2020 data’
column of the computed indicator file:
I. Go through the computed indicator file one reach at a time. First view photos on
Box to get a feel for the nature of each reach. For example, is the reach high
versus low gradient, confined versus unconfined, or highly impacted by
management or unaltered?
II. Given what you observed in the photos, do the covariate values such as slope,
sinuosity, and bankfull width make sense? For example, do entrenchment,
sinuosity, and slope values follow patterns expected by stream typologies like the
Rosgen Classification (e.g., It is rare to observe reaches with both high slope and
high sinuosity or high slope and low entrenchment).
III. Next, review the crews field comments for the reach.
a. You can use the ‘Filter’ column, to select all comments for the reach.
b. Do any comments warrant omitting or flagging an indicator value as
suspect? Flagging data as suspect allows data users to consider data use on
a case by case basis for a given analysis. In contrast, omitting data should
be done if there are no situations in which data use is appropriate.
IV. Do groups of indicators tell a consistent and/or logical story at each reach? If not,
review pictures, crew comments, and consider the reasons this could be the case.
For example:
a. Are there consistent patterns between bank overhead cover and bank
cover? For example, both low bank overhead cover (BankOverheadCover)
and low bank cover (BankCoverFoliar). It is rare to have high bank
23overhead cover and low bank cover unless the overhead cover is all
greater the 0.5 m in height.
b. If bank stability is low (BankStability), is the percent of covered banks
(BankCoverFoliar) also low? It is rare to have a large percent of banks
covered and yet low bank stability.
c. Does the number of pools (NumPools) and percent pools (PctPools) seem
practical for the observed slope, sinuosity, and general reach
characteristics? The number of pools generally increases as sinuosity
increases and slope decreases, for example. Exceptions include high slope
reaches with step-pool geomorphic features.
d. Do floodplain connectivity and entrenchment ratio indicator values tell a
consistent story? For example, stream channels with well-connected
floodplains connectivity are generally associated with little to no
entrenchment. However, exceptions exist where minor channel incision is
present. Similarly, in V-shaped valleys with no potential to support
benches, floodplain connectivity values should be 1, as bankfull and bench
heights are measured as equal.
V. To record the outcomes from step A, record your name in the ‘EvaluatorName’
column. If no errors were found, record “No errors” in the ‘EvaluatorComments”
column for every row for each reach. If potential errors were identified, record the
errors with clear action items for the National AIM Team in the
“OmitOrEditData’ column. For example, percent pools was 90%, which is an
unrealistic value. The crew clearly misapplied the protocol and classified runs as
pools. Record any general comments during this process in the
‘EvaluatorComments’.
B. The National AIM Team will compare indicator values among visits if the reach has been
sampled multiple times.
I. 2020 Data are provided and if revisit data is available it is provided in the ‘Visit
1’ and ‘Visit 2’ columns.
II. Photos and reach coordinates are reviewed to determine if sampling conditions
and reach placement were similar or if major changes occurred at a reach.
III. Covariate values are compared to the photos and through time. Any large
differences in covariates are particularly concerning because things such as stream
slope should not change appreciably among years.
IV. Sample dates are compared among visits to determine if any protocol changes or
natural temporal variation were likely.
V. Logical groups of indicators are compared among sample events keeping in mind
which indicators should or shouldn’t be expected to change much through time.
Absolute value changes through time should be considered in an ecological or
geomorphic context.
VI. Notes are recorded following the instructions below:
a. If any values are clearly wrong and all data from that visit for a given
indicator should be omitted, the ‘Omit Or Edit Data’ column is populated
with the description of the issue specifying which visit to omit and why.
For example, if bench height was incorrectly identified during the first
visit (measured abandoned terrace above floodplain height accidentally)
24and only bench height and subsequent floodplain connectivity values are
correct for the second visit.
b. For questionable values and differences among visits the
‘EvaluatorComments’ column is used to make appropriate comments. For
example, percent pools from visit one was 5% and 20% for visit two, but
there is no reason to expect large geomorphic changes between years and
it is unclear from photos which one is correct.
c. If possible, reasons for observed differences among visits should be
recorded. Possible reasons for differences include:
1. Crews – One crew may have improperly implemented the protocol
during a specific visit.
2. Protocols – changes in protocol methods through time. The
following are key changes to be aware of:
i. Change in 2019 to collecting bank foliar cover rather than
bank basal cover. These will appear as separate indicators
but could result in higher cover values from 2019 on, and
lower values from 2013-2018.
ii. Changes in location of canopy cover measurements along
the bank (i.e., from water’s edge to scour), which could
result in higher canopy cover values from 2016 on, than
those measured from 2013-2015.
iii. Changes in the extent of collected streambed particles (e.g.,
scour to scour vs. wetted edge to wetted edge). Data from
2013 could be biased towards higher median particles sizes
and lower percent fines, for example, than data post 2013.
3. ReachPlacement – Differences in reach placement or length among
repeat visits.
i. Assess changes in reach location or length that could
confound comparisons through time (e.g., channel
morphology, land use, or stream size).
4. Year-To-Year Variability – indicator differences may occur
through time due to interannual climatic variability or seasonal
management actions.
25Step 9 – Check-in and Project Close-out
Overview
A check-in meeting should be held one month into the field season with the crew, project lead,
state lead and/or monitoring coordinator, crew manager, and the National AIM Team to make
sure data management and data quality steps are being completed and that there is good
communication among team members. During this meeting, the one-month check list and agenda
topics can provide a starting point of questions to address unresolved protocol questions, app and
iPad quirks, or logistical and gear issues such as YSIs malfunctioning. The state leads or
monitoring coordinators should schedule and lead this meeting and all other parties should come
prepared to discuss issues that have arisen thus far throughout the season. If the state lead or
monitoring coordinator is not able to schedule and lead these meetings, they should coordinate
with the project leads to ensure these meetings occur.
The project close-out meeting should be scheduled by the state lead and/or monitoring
coordinator before the end of contracts such that crews and crew supervisors are still available to
clear up any data questions that may arise. The end of season check list below should serve as an
exhaustive list of everything that needs to be done to close out the project. In summary, all final
data should be submitted and the evaluation statuses in the Point and Field Visits layers in the
Office Webmap should be finalized. Project leads or crew managers should submit all
macroinvertebrate samples and water quality samples to NAMC following the protocol found
here.
Responsible Parties
Everyone
When and Estimated Time
One month into data collection and at the end of the season while the crew is still working;
1-2 hours per meeting
Tools and Files
• Check lists below
• Error Log Table
• Teams
• Sample Size Dashboard
• Bug and Water Quality Submission Protocol
26One-month check list and agenda topics
The purpose of the one-month check-in meeting is to discuss data quality processes for design
management, data collection, and data submission to date with the goal of resolving any
questions or issues so they don't propagate throughout the field season.
Pre-meeting preparation checklist:
The project lead has prepared a quick assessment of number of points sampled and crew
productivity.
The crew has submitted ~1 month's worth of data 1 week prior to this meeting.
The crew has selected bankfull, scour, and floodplain photos from at least 3 reaches and
posted them on the google drive for meeting discussion. Photos should include: 1) a
normal reach, 2) the most quirky reach visited to date, and 3) something in between or that
warrants discussion.
All parties involved have prepared a list of protocol questions and clarifications and
potentially some photos to facilitate discussion.
All parties involved have prepared a list of design management and data questions to
discuss during the meeting.
The National AIM Team has a list of questions in regards to any final data to discuss
during the meeting.
Discussion topics and questions:
If crews are taking more than 4-8 hours per site, or not sampling 1-1.5
sampled sites per day, what can we do to help improve efficiency. Action Items and Notes
Consider:
Does the crew feel they have been provided with adequate office evaluation
information to get to point coordinates? Are trip plans organized in a realistic
manner? If not, what do they suggest for improvements?
Does the project lead feel that it is realistic to meet the project's total sample
size by the end of the summer? If not, how do we adjust and prioritize, what's
in the contract, etc.?
Is it clear to the crew who they are supposed to call for protocol questions,
access issues, trip schedule issues, etc.?
Design management Action Items and Notes
Is the crew updating the Field Visits layer often and completely?
Is the crew labeling macroinvertebrate samples with an inside and outside
label, storing appropriately, and recording number of jars collected in the
Field Visits layer?
Is the crew clear that they should be collecting duplicate and blank WQ
samples for total nitrogen and phosphorus at 10% of sites and labeling these
samples appropriately? How many reaches has the crew collected duplicates
and blanks for so far?
Are project leads finalizing eval statuses so that designs can be managed
iteratively? Are there questions in regards to this?
Are the trip planners managing the design iteratively according to guidance
in the design management protocol? Is the Points layer being properly and
completely updated?
27Table continued on next page
Has the project lead assigned merged PointIDs properly and is the crew clear
on what coordinates and PointIDs should be used?
Local Field/District Office orientation training and calibration: Action Items and Notes
Who was able to make it to this local training? How many and what types of
reaches were visited?
Did this enhance everyone's understanding (especially the crew) of how to
identify the critical concepts? Which critical concept caused the most
discussion?
Which other indicators caused a lot of discussion and why?
Was calibration data saved electronically on Teams?
Photo review: Action Items and Notes
The crew presents bankfull photos and discusses their experience at 3
sampled reaches: 1) a typical reach, 2) a challenging reach, and 3) 1 other
reach that you would like to share. Does everyone agree on the critical
concept locations? Is the crew confident identifying the three critical
concepts across a diversity of reaches? Other discussion about these reaches?
Does anyone else have photos or specific indicators they want to discuss?
Has the crew encountered any of the below special situations (TR 1735-2
Appendix C) yet this field season, and how did they go? What indicators Action Items and Notes
were difficult in these systems?
Interrupted flow
Beaver impacts
Partial data
Side Channels
Braided systems
SARAH and QAQC Action Items and Notes
Has the crew found any SARAH glitches preventing efficient data collection,
QAQC, backup, and submission that the National AIM Team can fix?
Is the crew backing up data after at least every two reaches? If not, why?
Are there reoccurring themes or issues being discussed at the weekly QAQC
meetings? Who is attending? If these meetings are not occurring, why not?
How can we improve?
How often is the project lead able to review indicator values? What issues
have arisen?
Does the National AIM Team have questions for the team about final data?
Are there any other unresolved data issues?
28End of season check list
The purpose of the end of season meeting is to ensure all that all data questions have been
resolved, all design and field data have been finalized, and no more information or tasks are
required prior to the end of the field season.
Pre-meeting preparation checklist:
Crews have submitted all final data.
Project Lead has reviewed all indicator data and will come to the meeting with any
questions.
National AIM team has reviewed final data and will come to the meeting with any
questions.
All questions in the Error Log have been resolved or will be resolved during the
meeting.
The National AIM Team has reviewed the finalized Evaluation Statuses in the Office
Webmap and will come to the meeting with any questions.
Crews prepare a list of gear that needs to be replaced, replenished, or fixed and share
with whomever is responsible for gear (using the master gear list as a checklist could
be helpful).
Contractors have coordinated with NAMC to submit macroinvertebrate and water
quality samples following this protocol.
State Lead/Coordinator organizes meeting with National AIM Team, project leads,
contractors, and crews. Keeps notes in the Teams Mid and End of season check folder.
Pre-meeting table to be completed by Project Lead:
Project Lead Name
Project Area
Year of design (e.g., first year of 3)
Field season start and end dates (e.g., May 1-August 31)
Contract/agreement company and crew members
Number of random sampled reaches
Number of targeted sampled reaches
List of reaches that were suppose to be sampled this year but
for various reasons will need to be sampled next year (discuss
list)
List of boatable reaches support is needed for sampling
Preliminary notes about the design (e.g., next year we will
need more points in Field Office A, next year we will want an
intensification because there are not enough points in X
allotment, or the design was great and should continue as is
next year) National AIM Team will follow up during the
planning stages.
29Discussion topics/questions, and final checks at minimum:
Design management
Resolve any disagreements on final eval status in Points Layer in the Office Webmap.
Resolve any other questions in regards to the Points or Field Visits layers in the Office Webmap.
Is there any other follow up needed on reaches that should be revisited in future years?
Have all PointIDs that were merged been properly noted as such with the merged site code in the
Points layer?
Data
Discuss any remaining problem reaches, photos, indicators, or field methods.
Final data questions follow-up.
Have macroinvertebrate and WQ samples been submitted? If not, what is the plan?
All electronic data, photos, etc. have been sent to National AIM Team. If not, resolve issues at
meeting.
30APPENDIX A. COMMENT PROTOCOL
Crews should be judicious when recording comments in SARAH. Any general comments related
to difficulty implementing the protocol are very helpful. To assist crews with understanding what
other kinds of comment are helpful, comment types are listed below with a description of the
kinds of information that should be included in each comment type. General and access
comments are required. Photo and water quality and macroinvertebrates comments and not
required in all cases but are frequently used. The rest of comment types listed below are rarely
used.
General Comment
Comment used to
• Justify why a reach was not sampled, partially sampled, or classified as interrupted flow.
If partially sampled or interrupted flow, it should specify which transects were not
collected or were dry.
• Note general observations about the reach. For example:
o Was any management history about the reach evident? (e.g., livestock, recreation,
wildlife, roads, culverts)
o Was any additional information gained from talking to adjacent landowners or
permittees?
o Did flow conditions change while at the reach?
o Was there more than one side channel present at the reach?
• Note if there were any drastic geomorphic changes throughout the reach (e.g., tributaries
coming in or drastic changes in valley confinement)
Other critical data comments that are not included elsewhere should also be included in this
comment. For example, if two iPads were used for data collection at one reach and the data from
each iPad needs merged. Other common general data comments include:
• Uncertainty with special situation protocols (e.g., interrupted or side channel)
• Data for an entire transect entered under the wrong transect.
• Any changes needed to PointIDs should be fixed before submitting, but photos may still
be improperly labeled depending on when they were uploaded!
• Any app errors that impeded data entry
Access Comment
Comment used to provide information about
• Exactly how the reach was accessed (e.g., which roads were taken and any hiking routes).
• Any special gear needs, and length of time to access and sample
• It should NOT include landowner contact information as this is sensitive personal
information not to be recorded in the database.
Photos Comment
Appropriate comments should be made for each photo taken. Paired photos with comments are
the best kind of comments if there are any questions about protocol application! Please make
sure any comments and photos taken are specific enough that they can be easily reviewed with
project leads and crew managers within a week or two of sampling the reach.
31You can also read