Bone Mineral Reference Values for Athletes 11 to 20 Years of Age - MDPI
←
→
Page content transcription
If your browser does not render page correctly, please read the page content below
International Journal of
           Environmental Research
           and Public Health

Article
Bone Mineral Reference Values for Athletes 11 to
20 Years of Age
Irina Kalabiska 1 , Annamária Zsakai 2, * , Robert M. Malina 3                   and Tamas Szabo 1
 1    Research Center for Sport Physiology, University of Physical Education, Alkotas u. 44,
      1123 Budapest, Hungary; kalabiskai@gmail.com (I.K.); szabo.tamas@tf.hu (T.S.)
 2    Department of Biological Anthropology, Eotvos Lorand University, Pazmany P. s. 1/c,
      1117 Budapest, Hungary
 3    Department of Kinesiology and Health Education, University of Texas, Austin, TX 78712, USA;
      rmalina@1skyconnect.net
 *    Correspondence: zsakaia@elte.hu; Tel.: +36-20-355-7036

 Received: 8 June 2020; Accepted: 6 July 2020; Published: 8 July 2020

 Abstract: Objectives. Training for sport is associated with the development of bone minerals, and the
 need for reference data based on athletes is often indicated. The purpose of this study was to
 develop a reference for bone mineral density (BMD) and content (BMC) specific for youth athletes
 of both sexes participating in several sports. Methods DEXA (dual energy X-ray absorptiometry)
 was used for total body measurements of bone minerals in 1385 athletes 11 to 20 years, 1019 males
 and 366 females. The athletes were training in several sports at Hungarian academies. Reference
 values for total bone mineral density and bone mineral content, and also BMD excluding the head
 (total body less head, TBLH) were developed using the LMS chartmaker pro version 2.3. Results.
 The centile distributions for BMD and BMC of the athletes differed significantly from those of the age-
 and sex-specific references for the general population. The youth athletes had higher BMD and BMC
 than those of the reference for the general population. Conclusion. The potential utility of the DEXA
 reference for male and female youth athletes may assist in monitoring changes in the BMC and BMD
 associated with normal growth and maturation, and perhaps more importantly, may be useful in
 monitoring changes specific to different phases of sport-specific training protocols.

 Keywords: DEXA; bone mineral; bone development; youth athletes

1. Introduction
     Concern for bone health, specifically bone mineral density (BMD) and bone mineral content
(BMC), is a major concern given age and gender variation [1,2]. In this context, reference data for a
population are routinely used for screening purposes; as such, they are a reference for comparison [1,3,4].
Given changes in BMD and BMC during the course of growth and maturation, there is increased
interest in the bone health of children and youth, especially in the context of beneficial effects of
regular physical activity on BMC [5–7]. Evidence is also consistent in showing beneficial effects of
systematic training for sport on BMC [8,9]. Mechanical loading associated with regular training has a
significant influence on skeletal development and bone maintenance. Regular intensive exercise with
considerable mechanical loading in athletes is associated with an increase in absolute and relative bone
dimensions and structural parameters. In contrast, inadequate bone development per se and some
practices associated with specific sports, e.g., extreme weight control measures and disordered eating,
can negatively influence performance and can increase the risk for bone stress injuries. Understanding
bone development in young athletes may inform training practices, leading to success in sport,

Int. J. Environ. Res. Public Health 2020, 17, 4930; doi:10.3390/ijerph17144930           www.mdpi.com/journal/ijerph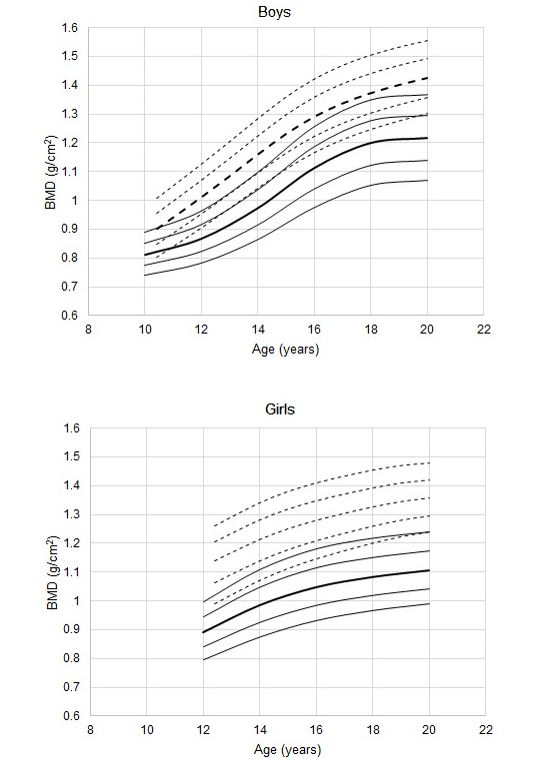
Int. J. Environ. Res. Public Health 2020, 17, 4930                                                    2 of 11

facilitate the diagnosis of structural abnormalities in bone, and contribute to the prevention of skeletal
injuries [10–12].
      The bone health of athletes, specifically BMD and BMC status, is generally evaluated relative
to reference data for the general population [13–15]. Such a reference may have limitations with
athletes given the selectivity of sport in general, sport-specific training demands, and dietary pressures
associated with specific sports [16,17]. Moreover, measures of BMD and BMC among athletes often fall
outside normal ranges for the general population [18–20].
      DEXA (dual energy X-ray absorptiometry) technology provides measures of total body bone area
(cm2 ), BMC (g), and BMD (g/cm2 ) [21]. However, evaluation of BMC and BMD requires appropriate
reference data that allow for chronological age, body size, pubertal status, ethnicity, and sex, and perhaps
demands of specific sports [22–24]. The preferred indicator of BMD is the total body, excluding the
head [25]. Evidence suggests that age, height, and weight were better predictors of total body BMD
excluding the head (total body less head (TBLH) BMD) in contrast to total body BMD [26]. Use of
the subtotal BMD result, excluding the head region, is preferred as the skull does not develop in
a proportionally similar manner to body mass and to the weight of other organs in children and
adolescents. In addition, the head constitutes a large portion of the total body bone mass but changes
little with growth, activity, or disease. Thus, including the skull may mask gains or losses at other
skeletal sites [21].
      The purpose of this study was to develop reference values for BMC, BMD, and TBLH BMD based
on DEXA in a sample of Hungarian youth athletes of both sexes.

2. Material and Methods
      The project was approved by the Ethics Committee of the University of Physical Education in
Budapest, Hungary. Parents of athletes 130 kg, height >200 cm, pregnancy, non-removable objects
(e.g., prostheses or implants) in the past one-half year, and inability of an athlete to attain correct
position and/or to remain motionless during the scan.
      The research was conducted between September 2015 and March 2019. Whole body bone mineral
density (BMD), bone mineral content (BMC), and total body less head (TBLH BMD) were measured
with a GE Lunar Prodigy dual-energy X-ray scanner. The scanner was located in the Research Center
for Sport Physiology, University of Physical Education, Budapest, Hungary, and the first Author
(IK) made the DEXA measurements. The data were processed with enCORE Version 16 software.
The Lunar Prodigy reference data were based on an international sample of healthy children and adults
from the general population in several regions of the world in the 1990s and early 2000s. The sample
was free of people with chronic diseases affecting bone structure and development and those taking
bone-altering medications. The enCORE software of the scanner permits comparison of a subject’s
results to a selected reference population considering ethnicity (Black, White, Asian, or Hispanic;
White was chosen in the case of the Hungarian young athletes). The athletes were grouped into single
year chronological age groups with the whole year as the midpoint, i.e., 11 years = 10.50 to 11.49,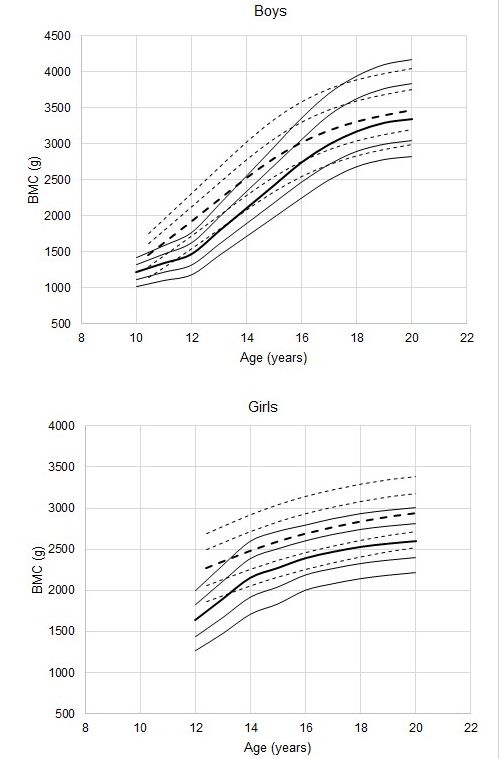
Int. J. Environ. Res. Public Health 2020, 17, 4930                                                         3 of 11

12 years = 11.50 to 12.49, etc. Sample sizes and descriptive statistics for age, height, and weight of male
and female athletes are summarized by age groups in Tables 1 and 2, respectively.

      Table 1. Sample sizes and descriptive statistics (means (M) and standard deviations (SD)) for age,
      height, and weight of male athletes by age group.

                        Age Group        Sample              Age              Height          Weight
                           (years)           n        M            SD       M      SD       M      SD
                              11             25      11.56         0.28   157.62    6.28   43.19    6.23
                              12             28      12.63         0.26   166.89    9.05   50.75   12.72
                              13             63      13.55         0.28   173.04   10.57   57.65   11.55
                              14             98      14.57         0.30   177.09    8.86   63.98   10.67
                              15            200      15.50         0.27   180.08    8.79   69.12   11.94
                              16            237      16.48         0.29   181.87    9.19   71.27    9.48
                              17            174      17.49         0.28   184.74    9.65   76.65   11.09
                              18            123      18.43         0.29   182.27    8.21   76.52   12.19
                              19             42      19.53         0.32   180.76    7.39   76.13    6.50
                              20             29      20.34         0.27   177.40    6.00   78.91   11.95

      Table 2. Sample sizes and descriptive statistics (means (M) and standard deviations (SD)) for age,
      height, and weight of female athletes by age group.

                        Age Group        Sample           Age                Height           Weight
                          (years)            n        M            SD      M       SD       M      SD
                             13             25       13.60      0.23      168.24   8.86    57.27   10.32
                             14             79       14.51      0.24      171.47   7.06    63.76   9.36
                             15             86       15.55      0.30      173.46   7.26    67.11   11.36
                             16             49       16.54      0.30      172.70   7.08    65.35   8.96
                             17             63       17.37      0.32      173.00   7.01    66.98   12.78
                             18             27       18.52      0.32      174.46   8.14    66.10   7.31
                             19             27       19.43      0.24      174.16   6.69    70.14   9.64
                             20             10       20.65      0.24      167.38   8.14    63.53   7.16

     Age- and sex-specific means and standard deviations, and selected percentiles (10th, 25th, 50th,
75th, 90th) were calculated for BMD, BMC, and TBLH BMD using the LMS chart maker pro version
2.3. The bone mineral parameters of each athlete were converted to z-scores relative to age- and
sex-specific reference values specified by the Lunar Prodigy type dual-energy X-ray scanner manual.
The distributions of BMD and BMC parameters in the athletes were compared to standard reference
centile distributions by using individual z-scores of bone mineral parameters in young athletes on the
basis of the reference centile distribution (reference L, M, S parameters). Single sample t-tests were
used to evaluate the distribution of z-scores in each age-group of males and females, i.e., to compare
age and sex-specific z-scores for BMD and BMC of the athletes to the Lunar Prodigy reference for
youth. The normality of z-scores for BMD and BMC was tested by the Kruskal–Wallis test. Hypotheses
were tested at a 5% level of random error.

Ethical Approval Information
     The Research Ethics Committee of the University of Physical Education (Budapest, Hungary)
approved the study (ID of approval: TE-KEB/No42/2019). The investigations were carried out following
the rules of the Declaration of Helsinki of 1975 (https://www.wma.net/what-we-do/medical-ethics/
declaration-of-helsinki/), revised in 2013.

3. Results
     Sex differences in the selected bone mineral parameters are apparent at 14 years and older;
total BMD, TBLH BMD, and BMC of male athletes are greater than corresponding values in their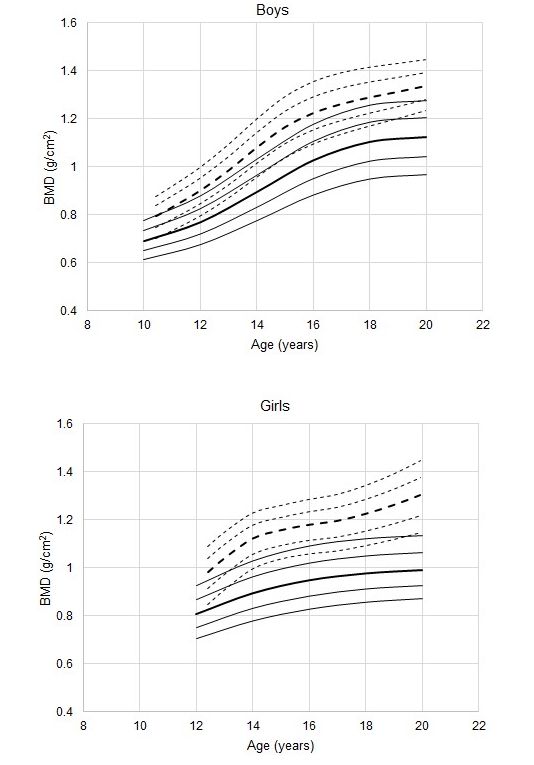
Int. J. Environ. Res. Public Health 2020, 17, 4930                                                                        4 of 11

female age-peers except for total BMD (tBMD) at 13, 14, 19, and 20 years, and TBLH BMD at 20 years.
At each indicated age, the BMD parameters do not differ between boys and girls (Table 3).

      Table 3. Significance levels for sex differences in BMD and bone mineral content (BMC) parameters
      among athletes (significant values in italics).

                                       Age           Total BMD    TBLH BMD             BMC
                                     (years)           (g/cm2 )     (g/cm2 )            (g)
                                            12              0.378             0.669          0.505
                                            13              0.421             0.468          0.806
                                            14
Int. J. Environ. Res. Public Health 2020, 17, x 6 of 12
Table 3. Significance levels for sex differences in BMD and bone mineral content (BMC) parameters
among athletes (significant values in italics).
Int. J. Environ. Res. Public Health 2020, 17, 4930 5 of 11
Age Total BMD TBLH BMD BMC
(years) (g/cm2) (g/cm2) (g)
The corresponding trend
12 for total BMD
0.378 among female athletes also indicates
0.669 0.505 higher BMD (Figure 1,
p < 0.001 in all age groups
13except 20 years,0.421p = 0.02). Of 0.468
interest, the 25th 0.806
percentile for female athletes
14the reference across the age range except at 12 years when the 25th percentile of the athletes
approximated the 90th percentile of reference.
The corresponding trends for BMC of female athletes generally parallel those of the reference
percentiles
Int. J. Environ.from 14 years
Res. Public Health on,
2020,but are significantly higher than those of the reference (Figure 3,6 of
17, 4930 p 11
<
0.001 in all age groups except 13 years, p = 0.04).
Figure
Figure 3. Total BMC
3. Total BMC in in youth
youth male
male and
and female
female athletes
athletes11
11 to
to 20
20 years
years of
of age;
age; percentiles
percentiles (-(- -- -)-) for
for
athletes,estimated
athletes, estimatedwith
withthe
theLMS
LMSmethod,
method,areare plotted
plottedrelative
relativetoto the
the DEXA
DEXA reference
reference (—)
(—) percentiles
percentiles
(10th, 25th,
(10th, 25th, 50th,
50th, 75th,
75th, 90th;
90th; the
the 50th
50th percentiles
percentiles are in bold).
The corresponding
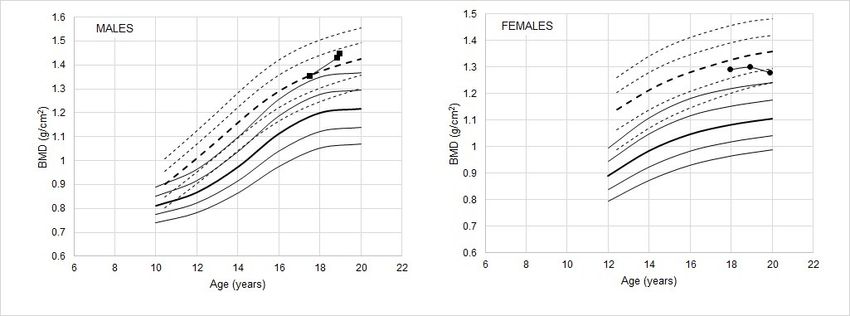
Examples trends for of
of the application BMC theofreference
female athletes generally
percentiles parallel those
for athletes in theofevaluation
the reference of
percentiles from 14 years on, but are significantly higher than those of the
individual BMDs are shown in Figure 4. The athletes were selected from a longitudinal studyreference (Figure 3, pof< bone
0.001
in all age in
structure groups
youthexcept 13 years,
athletes. = 0.04).
In the pmale athlete (Figure 4, left), the BMD of the athlete is higher than
the 90th percentile of the general population atpercentiles
Examples of the application of the reference for athletes
each observation, butinrelative
the evaluation of individual
to the reference for
BMDs are
athletes, theshown
BMDinshifts
Figure 4. The
from the athletes
median were selected from
at observation 1 toathe
longitudinal study at
75th percentile of observation
bone structure 2,
in youth athletes. In the male athlete (Figure 4, left), the BMD of the athlete
suggesting that BMD continued to increase between 17 and 19 years. In the example of the female is higher than the 90th
percentile
athlete of the
(Figure 4, general
right), BMDpopulation
values atareeach observation,
higher than the 90thbut percentile
relative to of thethe
reference
general for athletes,
population
the BMD shifts
reference acrossfrom
the the
agemedian
intervalatconsidered,
observation but
1 to the
are 75th
belowpercentile at observation
the reference median 2,forsuggesting
athletes andthat
gradually decline over time toInt. J. Environ. Res. Public Health 2020, 17, x 8 of 12
Int. J. Environ.
decline Res. Publicrelative
in BMD Health 2020, 17,athlete
to the 4930 reference suggests the need for attention from the trainers as to7 of 11
potential factors associated with the decline.
FigureFigure 4. BMD
4. BMD of two
of two athletes,
athletes, a femalehandball
a female handball player
player and
anda amale
malefootball player,
football is shown
player, relative
is shown relative
to the percentiles (- - -) for athletes and the DEXA reference (—) percentiles (10th, 25th, 50th,
to the percentiles (- - -) for athletes and the DEXA reference (—) percentiles (10th, 25th, 50th, 75th, 75th, 90th;
90th; the 50th percentiles are in bold).
the 50th percentiles are in bold).
4. Overview
4. Overview
Comparison of the percentiles of DEXA measurements of total BMD, BMD TBLH, and BMC of
Comparison of the percentiles of DEXA measurements of total BMD, BMD TBLH, and BMC of
athletes 11–20 years in several sports (Appendix A, Tables A1–A3) with the corresponding Lunar
athletes 11–20 years in several sports (Appendix A, Tables A1–A3) with the corresponding Lunar
Prodigy reference percentiles highlighted the contrast in bone development between athletes and the
Prodigy reference percentiles highlighted the contrast in bone development between athletes and
reference, and by inference suggested a need for reference values specific for youth athletes.
the reference,
Referencesand data by inference
for DEXA bonesuggested
parameters aforneed for are
athletes reference values
limited [27]. specific
As such, for youth
the reference athletes.
values
References data for DEXA bone parameters for athletes are limited [27]. As
for athletes in the present study may aid in the understanding of bone development in activelysuch, the reference values
for athletes in the present
training youth athletes. study may aid in the understanding of bone development in actively training
Relative to age- and sex-peers in the general population [28], BMD and BMC are better
youth athletes.
developed
Relative to among
age- and thesex-peers
youth athletes. The results
in the general were consistent
population [28], BMD with
andearlier
BMC studies of developed
are better youth
athletes, and highlighted the importance of regular physical activity associated
among the youth athletes. The results were consistent with earlier studies of youth athletes, with specific sports
on bone structure, density, and morphology [12,29–31]. Intensive physical activity associated with
and highlighted the importance of regular physical activity associated with specific sports on bone
systematic training was associated with increased BMC and BMD. The data, however, were based on
structure, density, and morphology [12,29–31]. Intensive physical activity associated with systematic
a combined sample of athletes in a variety of sports, and in the context of the literature, highlight the
training was associated with increased BMC and BMD. The data, however, were based on a combined
need to evaluate BMD and BMC in specific sports and also in sports characterized by variation in
sampleimpactathletes
of forces, ine.g.,a variety of sports,
high-impact and injudo,
(gymnastics, the context of the literature,
karate, volleyball, highlight (soccer,
etc.), odd-impact the need to
evaluate
basketball, step-aerobics, etc.), and non-impact or negative-impact (cycling, swimming, water in
BMD and BMC in specific sports and also in sports characterized by variation impact
polo,
forces, e.g.,
etc.) high-impact
stresses. In addition (gymnastics, judo, itkarate,
to BMD and BMC, volleyball,
is also important etc.), odd-impact
to consider variation in(soccer, basketball,
bone geometry
in anatomic
step-aerobics, regions
etc.), and specific to variation
non-impact in loading patterns
or negative-impact by sport.
(cycling, swimming, water polo, etc.) stresses.
In addition to BMD and BMC, it is also important to consider variation in bone geometry in anatomic
5. Limitations of the Study
regions specific to variation in loading patterns by sport.
Given the limited number of female athletes, the analysis of sex differences in BMD and BMC
5. Limitations of the Study
should be evaluated with caution. The lack of an indicator of maturity status in the younger athletes
is also a limitation.
Given the limited number of female athletes, the analysis of sex differences in BMD and BMC
should be evaluated with caution. The lack of an indicator of maturity status in the younger athletes is
6. Summary
also a limitation.
• Reference values for DEXA measures of BMD, TBLH BMD, and BMC were developed for a
6. Summaryrelatively large sample of youth athletes 11–20 years of age.
• Compared to reference values for the general population (White ethnicity), BMD and BMC of
• Reference values
the youth for were
athletes DEXA measures
better of BMD, TBLH BMD, and BMC were developed for a
developed.
•
relatively large sample
By inference, of youth
comparison athletes
of DEXA 11–20 years
observations of age.
of athletes with reference values for the general
• population must be done with care to avoid potential misinterpretations.
Compared to reference values for the general population (White ethnicity), BMD and BMC of the
youth athletes were better developed.
• By inference, comparison of DEXA observations of athletes with reference values for the general
population must be done with care to avoid potential misinterpretations.
Author Contributions: I.K. participated in the data collection, bone development estimation, statistical analyses
and the interpretation of the results, manuscript construction. A.Z. participated in statistical analyses and theInt. J. Environ. Res. Public Health 2020, 17, 4930 8 of 11
interpretation of the results, manuscript construction. R.M.M. participated in the interpretation of the results,
preparation of the manuscript. T.S. participated in statistical analyses and the interpretation of the results,
manuscript construction. All authors have read and agreed to the published version of the manuscript.
Funding: The project was supported by the Scientific Excellence Program 2019 at the University of Physical
Education, Innovation and Technology Ministry, Hungary (project number: TUDFO/51757/2019-ITM).
Acknowledgments: We would like to thank the sports clubs for their cooperation and engagement. Also, we thank
the participants for their valuable time during the tests.
Conflicts of Interest: The authors declare that they have no conflict of interest.
Appendix A
Table A1. Basic statistical parameters (mean, SD, and 10th, 25th, 50th, 75th, and 90th percentiles) for
total BMD (g/cm2 ) in youth male and female athletes.
Age (year) Mean SD P10 P25 P50 P75 P90
Males
11 0.962 0.062 0.837 0.885 0.942 0.996 1.048
12 0.997 0.063 0.902 0.952 1.012 1.069 1.124
13 1.063 0.095 0.971 1.023 1.085 1.145 1.202
14 1.158 0.098 1.041 1.096 1.160 1.223 1.283
15 1.248 0.105 1.109 1.165 1.232 1.297 1.359
16 1.296 0.101 1.166 1.223 1.292 1.358 1.423
17 1.335 0.109 1.212 1.269 1.338 1.405 1.471
18 1.372 0.093 1.248 1.305 1.374 1.441 1.506
19 1.378 0.085 1.278 1.334 1.402 1.469 1.534
20 1.412 0.112 1.303 1.359 1.426 1.492 1.557
Females
13 1.085 0.130 1.020 1.092 1.168 1.233 1.290
14 1.239 0.106 1.071 1.139 1.214 1.280 1.340
15 1.240 0.087 1.113 1.178 1.251 1.318 1.380
16 1.278 0.119 1.146 1.209 1.280 1.348 1.410
17 1.296 0.096 1.175 1.235 1.305 1.371 1.435
18 1.326 0.087 1.202 1.259 1.328 1.393 1.456
19 1.357 0.105 1.224 1.280 1.346 1.410 1.472
20 1.377 0.177 1.240 1.294 1.358 1.420 1.480
Table A2. Basic statistical parameters (mean, SD, and 10th, 25th, 50th, 75th, and 90th percentiles) of
TBLH BMD (g/cm2 ) in youth male and female athletes.
Age (year) Mean SD P10 P25 P50 P75 P90
Males
11 0.846 0.062 0.734 0.780 0.831 0.876 0.917
12 0.899 0.090 0.796 0.845 0.900 0.951 0.997
13 0.973 0.107 0.870 0.923 0.984 1.040 1.092
14 1.084 0.105 0.957 1.014 1.079 1.141 1.199
15 1.177 0.106 1.038 1.096 1.165 1.230 1.293
16 1.220 0.098 1.096 1.154 1.224 1.291 1.356
17 1.261 0.117 1.137 1.194 1.262 1.328 1.394
18 1.290 0.095 1.171 1.224 1.289 1.353 1.417
19 1.298 0.087 1.203 1.252 1.312 1.373 1.433
20 1.318 0.103 1.235 1.280 1.336 1.392 1.448
Females
13 0.994 0.133 0.906 0.972 1.040 1.097 1.147
14 1.143 0.116 0.995 1.057 1.122 1.178 1.227
15 1.143 0.083 1.036 1.094 1.156 1.211 1.259
16 1.180 0.113 1.057 1.116 1.179 1.235 1.284
17 1.192 0.094 1.070 1.130 1.195 1.253 1.305
18 1.220 0.094 1.092 1.155 1.224 1.286 1.342
19 1.241 0.115 1.118 1.186 1.261 1.329 1.391
20 1.339 0.211 1.146 1.219 1.302 1.377 1.445Int. J. Environ. Res. Public Health 2020, 17, 4930 9 of 11
Table A3. Basic statistical parameters (mean, SD, and 10th, 25th, 50th, 75th, and 90th percentiles) for
BMC (g) in youth male and female athletes.
Age (year) Mean SD P10 P25 P50 P75 P90
Males
11 1691.0 216.3 1281.4 1446.2 1625.3 1800.8 1956.1
12 1886.5 343.6 1539.6 1720.9 1923.5 2127.3 2311.7
13 2136.9 459.0 1807.7 2003.2 2227.2 2458.0 2671.3
14 2537.4 433.1 2079.2 2285.8 2527.6 2782.4 3022.8
15 2883.5 447.9 2331.8 2545.3 2799.4 3072.3 3334.6
16 3030.0 401.7 2543.0 2759.1 3019.6 3303.1 3579.7
17 3219.2 461.4 2708.0 2924.1 3186.5 3474.8 3758.7
18 3300.5 451.4 2830.5 3045.9 3308.2 3597.4 3883.4
19 3328.7 403.1 2918.7 3134.1 3396.1 3684.7 3969.8
20 3321.2 422.3 2986.0 3203.2 3466.3 3754.8 4038.4
Females
13 2073.0 386.1 1937.0 2135.8 2356.4 2576.8 2775.0
14 2580.8 375.0 2055.7 2258.9 2485.4 2712.6 2917.7
15 2551.6 321.3 2162.6 2368.5 2598.9 2830.9 3041.1
16 2722.9 370.8 2254.9 2461.6 2693.7 2928.5 3141.9
17 2729.8 340.7 2334.6 2540.5 2772.7 3008.4 3223.2
18 2818.1 345.4 2406.0 2610.2 2841.3 3076.6 3291.8
19 2899.2 461.5 2468.0 2669.5 2898.2 3131.9 3346.2
20 2687.9 865.3 2518.5 2716.2 2941.4 3172.0 3384.2
References
1. Ward, K.A.; Ashby, R.L.; Roberts, S.A.; Adams, J.E.; Mughal, M.Z. UK reference data for the Hologic QDR
Discovery dual-energy x ray absorptiometry scanner in healthy children and young adults aged 6–17 years.
Arch. Dis. Child. 2007, 92, 53–59. [CrossRef] [PubMed]
2. Elhakeem, A.; Frysz, M.; Tilling, K.; Tobias, J.H.; Lawlor, D.A. Association between age at puberty and bone
accrual from 10 to 25 years of age. JAMA Netw. Open 2019, 2, e198918. [CrossRef]
3. Baroncelli, G.I. Quantitative ultrasound methods to assess bone mineral status in children: Technical
characteristics, performance, and clinical application. Pediatric Res. 2008, 63, 220–228. [CrossRef] [PubMed]
4. Golden, N.H.; Abrams, S.A. Optimizing bone health in children and adolescents. Pediatrics 2014, 134,
e1229–e1243. [CrossRef] [PubMed]
5. Soininen, S.; Sidoroff, V.; Lindi, V.; Mahonen, A.; Kröger, L.; Kröger, H.; Jaaskelainenf, J.; Atalaya, M.;
Laaksonenai, E.D.; Laitinen, T.; et al. Body fat mass, lean body mass and associated biomarkers as
determinants of bone mineral density in children 6–8 years of age—The Physical Activity and Nutrition in
Children (PANIC) study. Bone 2018, 108, 106–114. [CrossRef]
6. Larsen, M.N.; Nielsen, C.M.; Helge, E.W.; Madsen, M.; Manniche, V.; Hansen, L.; Hansen, P.R.; Bangsbo, J.;
Krustrup, P. Positive effects on bone mineralisation and muscular fitness after 10 months of intense
school-based physical training for children aged 8–10 years: The FIT FIRST randomised controlled trial. Br. J.
Sports Med. 2018, 52, 254–260. [CrossRef]
7. Strong, W.B.; Malina, R.M.; Blimkie, C.J.; Daniels, S.R.; Dishman, R.K.; Gutin, B.; Hergenroeder, A.C.; Must, A.;
Nixon, P.A.; Pivarnik, J.M.; et al. Evidence based physical activity for school-age youth. J. Pediatrics 2005,
146, 732–737. [CrossRef]
8. Malina, M.R.; Coelho-e-Silva, J.M. Physical activity, growth and maturation of youth. In Body Composition:
Health and Performance in Exercise and Sport; Lukaski, H., Ed.; CRC Press (Taylor and Francis Group):
Boca Raton, FL, USA; Abingdon, UK, 2017; pp. 69–88.
9. Herbert, A.J.; Williams, A.G.; Hennis, P.J.; Erskine, R.M.; Sale, C.; Day, S.H.; Stebbings, G.K. The interactions
of physical activity, exercise and genetics and their associations with bone mineral density: Implications for
Injury Risk in Elite Athletes. Eur. J. Appl. Physiol. 2019, 119, 29–47. [CrossRef]
10. Carbuhn, A.F.; Fernandez, T.E.; Bragg, A.F.; Green, J.S.; Crouse, S.F. Sport and training influence bone and
body composition in women collegiate athletes. J. Strength Cond. Res. 2010, 24, 1710–1717. [CrossRef]Int. J. Environ. Res. Public Health 2020, 17, 4930 10 of 11
11. Tenforde, A.S.; Carlson, J.L.; Chang, A.; Sainani, K.L.; Shultz, R.; Kim, J.H.; Fredericson, M.; Kim, J.H.;
Cutti, P.; Golden, N.H.; et al. Association of the female athlete triad risk assessment stratification to the
development of bone stress injuries in collegiate athletes. Am. J. Sport. Med. 2017, 45, 302–310. [CrossRef]
12. Vlachopoulos, D.; Barker, R.A.; Ubago-Guisado, E.; Ortega, B.F.; Krustrup, P.; Metcalf, B.; Pinero, C.J.;
Ruiz, R.J.; Knapp, M.K.; Williams, A.C.; et al. The effect of 12-month participation in osteogenic and
non-osteogenic sports on bone development in adolescent male athletes. The PRO-BONE study. J. Sci.
Med. Sport 2018, 21, 404–409. [CrossRef]
13. Csakvary, V.; Puskas, T.; Oroszlan, G.; Lakatos, P.; Kalman, B.; Kovacs, G.L.; Toldy, E. Hormonal and
biochemical parameters correlated with bone densitometric markers in prepubertal Hungarian children.
Bone 2013, 54, 106–112. [CrossRef] [PubMed]
14. Sioen, I.; Lust, E.; Henauw, S.; Moreno, A.L.; Jiménez-Pavon, D. Associations between body composition and
bone health in children and adolescents: A systematic review. Calcif. Tissue Int. 2016, 99, 557–577. [CrossRef]
[PubMed]
15. Gordon, C.M.; Zemel, B.S.; Wren, T.A.; Leonard, M.B.; Bachrach, L.K.; Rauch, F.; Gilsanz, V.; Rosen, C.J.;
Winer, K.K. The determinants of peak bone mass. J. Pediatric 2017, 180, 261–269. [CrossRef] [PubMed]
16. Mountjoy, M.; Sundgot-Borgen, J.; Burke, L.; Carter, S.; Constantini, N.; Lebrun, C.; Meyer, N.; Sherman, R.;
Steffen, K.; Budgett, R.; et al. The IOC consensus statement: Beyond the female athlete triad–Relative Energy
Deficiency in Sport (RED-S). Br. J. Sports. Med. 2014, 48, 491–497. [CrossRef] [PubMed]
17. Mountjoy, M.; Sundgot-Borgen, J.K.; Burke, L.M.; Ackerman, K.E.; Blauwet, C.; Constantini, N.; Lebrun, C.;
Lundy, B.; Melin, A.K.; Meyer, N.L.; et al. IOC consensus statement on relative energy deficiency in sport
(RED-S): 2018 update. Br. J. Sports. Med. 2018, 52, 687–697. [CrossRef]
18. Malina, C.; Bouchard, C.; Bar-Or, O. Growth, Maturation, and Physical Activity, 2nd ed.; Human Kinetics:
Champaign, IL, USA, 2004.
19. Tenforde, S.A.; Sainani, L.K.; Sayres, C.L.; Milgrom, C.; Fredericson, M. Participation in ball sports may
represent a prehabilitation strategy to prevent future stress fractures and promote bone health in young
athletes. PM&R 2015, 7, 222–225. [CrossRef]
20. Faigenbaum, D.A.; Lloyd, S.R.; MacDonald, J.; Myer Citius, G.; Altius, D. Fortius: Beneficial effects of
resistance training for young athletes: Narrative review. Br. J. Sports. Med. 2016, 50, 3–7. [CrossRef]
21. Liu, J.; Wang, L.; Sun, J.; Liu, G.; Yan, W.; Xi, B.; Xiong, F.; Ding, W.; Huang, G.; Heymsfield, S.; et al.
Bone mineral density reference standards for Chinese children aged 3–18: Cross-sectional results of the
2013–2015 China Child and Adolescent Cardiovascular Health (CCACH) Study. BMJ Open 2017, 7, e014542.
[CrossRef]
22. Neu, C.M.; Manz, F.; Rauch, F.; Merkel, A.; Schoenau, E. Bone densities and bone size at the distal radius in
healthy children and adolescents: A study using peripheral quantitative computed tomography. Bone 2001,
28, 227–232. [CrossRef]
23. Schoenau, E.; Neu, C.M.; Rauch, F.; Manz, F. Gender-specific pubertal changes in volumetric cortical bone
mineral density at the proximal radius. Bone 2002, 31, 110–113. [CrossRef]
24. Bachrach, L.K.; Gordon, C.M. Section on endocrinology. Bone densitometry in children and adolescents.
Pediatrics 2016, 138, e20162398. [CrossRef] [PubMed]
25. Crabtree, N.J.; Arabi, A.; Bachrach, L.K.; Fewtrell, M.; Fuleihan, G.E.H.; Kecskemethy, H.H.; Jaworski, M.;
Gordon, C.M. Dual-energy X-ray absorptiometry interpretation and reporting in children and adolescents:
The revised 2013 ISCD Pediatric Official Positions. J. Clin. Densitom. 2014, 17, 225–242. [CrossRef] [PubMed]
26. Taylor, A.; Konrad, P.T.; Norman, M.E.; Harcke, H.T. Total body bone mineral density in young children:
Influence of head bone mineral density. J. Bone Miner. Res. 1997, 12, 652–655. [CrossRef]
27. Andreoli, A.; Monteleone, M.; Loan, M.; Promenzio, L.; Tarantino, U.; Lorenzo, A. Effects of different sports
on bone density and muscle mass in highly trained athletes. Med. Sci. Sports Exerc. 2001, 33, 507–511.
[CrossRef]
28. General Electric Healthcare. Lunar X-ray Bone Densitometer with Encore v18 Software-User Manual;
LU46000EN-2EN Revision; General Electric: Boston, MA, USA, 2019.
29. Peer, K.S. Bone Health in Athletes: Factors and Future Considerations. Orthop. Nurs. 2004, 23, 174–181.
[CrossRef]Int. J. Environ. Res. Public Health 2020, 17, 4930 11 of 11
30. Quiterio, A.L.D.; Carnero, E.A.; Baptista, F.M.; Sardinha, L.B. Skeletal mass in adolescent male athletes
and nonathletes: Relationships with high-impact sports. J. Strength. Condition. Res. 2011, 25, 3439–3447.
[CrossRef]
31. Tenforde, A.S.; Fredericson, M. Influence of sports participation on bone health in the young athlete: A review
of the literature. PMR 2011, 3, 861–867. [CrossRef]
© 2020 by the authors. Licensee MDPI, Basel, Switzerland. This article is an open access
article distributed under the terms and conditions of the Creative Commons Attribution
(CC BY) license (http://creativecommons.org/licenses/by/4.0/).You can also read