BPOP-v1 model: exploring the impact of changes in the biological pump on the shelf sea and ocean nutrient and redox state
←
→
Page content transcription
If your browser does not render page correctly, please read the page content below
Geosci. Model Dev., 13, 1865–1883, 2020
https://doi.org/10.5194/gmd-13-1865-2020
© Author(s) 2020. This work is distributed under
the Creative Commons Attribution 4.0 License.

BPOP-v1 model: exploring the impact of changes in the biological
pump on the shelf sea and ocean nutrient and redox state
Elisa Lovecchio and Timothy M. Lenton
Global Systems Institute, University of Exeter, Exeter, EX4 4QE, UK

Correspondence: Elisa Lovecchio (e.lovecchio@exeter.ac.uk)

Received: 8 July 2019 – Discussion started: 14 August 2019
Revised: 12 February 2020 – Accepted: 25 February 2020 – Published: 9 April 2020

Abstract. The biological pump of the ocean has changed               physical processes coupled with the biological pump in a va-
over Earth’s history, from one dominated by prokaryotes to           riety of case studies.
one involving a mixture of prokaryotes and eukaryotes with
trophic structure. Changes in the biological pump are in turn
hypothesized to have caused important changes in the nutri-
                                                                     1   Introduction
ent and redox properties of the ocean. To explore these hy-
potheses, we present here a new box model including oxygen           The “biological pump” describes the production of organic
(O), phosphorus (P) and a dynamical biological pump. Our             matter at the surface of the ocean (an oxygen source), its
Biological Pump, Oxygen and Phosphorus (BPOP) model                  downward export/sinking flux, remineralization at depth (an
accounts for two – small and large – organic matter species          oxygen sink) and burial. This set of processes acts against
generated by production and coagulation, respectively. Ex-           the homogenization of tracer concentrations by the ocean cir-
port and burial of these particles are regulated by a reminer-       culation, maintaining large-scale tracer gradients (Sarmiento
alization length (zrem ) scheme. We independently vary zrem          and Gruber, 2006). In today’s world, the biological pump
of small and large particles in order to study how changes           plays a key role in transferring carbon from the atmo-
in sinking speeds and remineralization rates affect the ma-          sphere/surface ocean to the deep ocean and in so doing low-
jor biogeochemical fluxes and O and P ocean concentrations.          ers atmospheric CO2 and creates oxygen demand in deeper
Modeled O and P budgets and fluxes lie reasonably close to           waters (Lam et al., 2011; Kwon et al., 2009). Those deeper
present estimates for zrem in the range of currently measured        waters with the greatest oxygen demand relative to oxygen
values. Our results highlight that relatively small changes in       supply can be driven hypoxic (O2 < 60 mmol m−3 ), suboxic
zrem of the large particles can have important impacts on            (O2 < 5 mmol m−3 ) or even anoxic – as is being seen in
the O and P ocean availability and support the idea that an          parts of the ocean today (Keeling et al., 2010). By combin-
early ocean dominated by small particles was nutrient rich           ing surface oxygen production and organic carbon burial, the
due to the inefficient removal of P to sediments. The results        biological pump plays a role in determining the long-term
also suggest that extremely low oxygen concentrations in the         source of oxygen to the atmosphere. The biological pump
shelf can coexist with an oxygenated deep open ocean for re-         also provides a means of efficiently transferring organic mat-
alistic values of zrem , especially for large values of the small-   ter and the nutrients it contains to marine sediments if sinking
particle zrem . This could challenge conventional interpreta-        through the water column happens fast enough compared to
tions that the Proterozoic deep ocean was anoxic, which are          remineralization for the material to hit the bottom (Sarmiento
derived from shelf and slope sediment redox data. This sim-          and Gruber, 2006). Hence the biological pump plays a key
ple and computationally inexpensive model is a promising             part in balancing the input of phosphorus to the ocean with
tool to investigate the impact of changes in the organic mat-        a corresponding output flux of phosphorus buried in marine
ter sinking and remineralization rates as well as changes in         sediments.

Published by Copernicus Publications on behalf of the European Geosciences Union.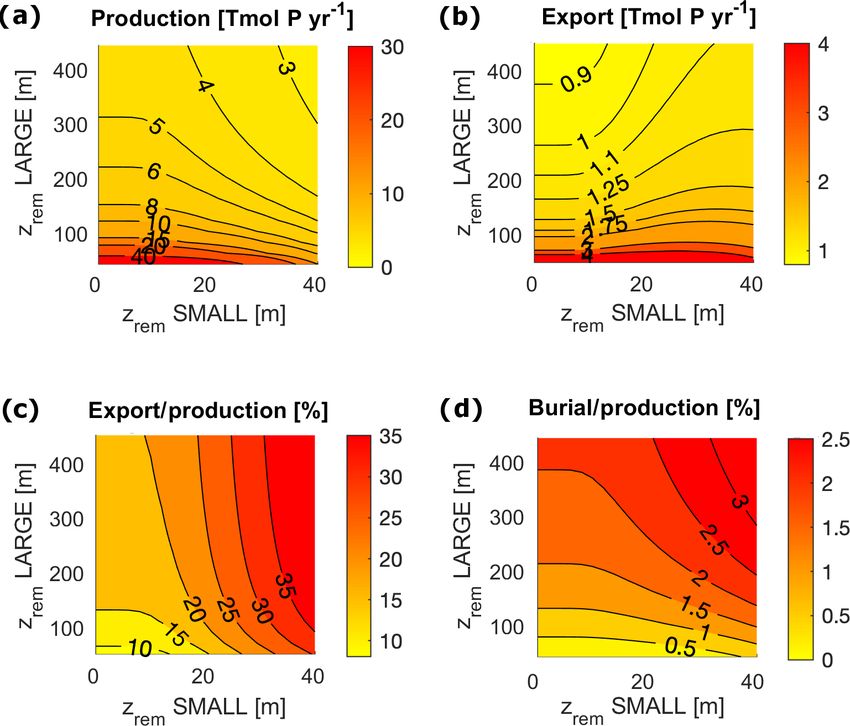
1866                                                                        E. Lovecchio and T. M. Lenton: BPOP-v1 model

   Through Earth’s history, the characteristics, efficiency and   Furthermore, GENIE only accounts for one organic carbon
impact of the biological pump are thought to have changed         species, overlooking processes of transformation of organic
dramatically due to the evolution of increasingly large and       material, such as coagulation and fragmentation, which con-
complex marine organisms (Ridgwell, 2011; Logan et al.,           tribute to modulating the efficiency of the organic matter ver-
1995; Boyle et al., 2018). Life in the ocean began as just        tical export and burial (Wilson et al., 2008; Karakaş et al.,
prokaryotes, presumably attacked by viruses, with slow sink-      2009; Boyd and Trull, 2007).
ing of the resulting tiny particles. Now the marine ecosys-          In this study, we take a more idealized approach, explor-
tem is a mix of prokaryotic cyanobacteria and heterotrophs        ing how changes in the properties of the biological pump
and size-structured eukaryotic algae, mixotrophs, and het-        may have affected the shelf sea and open ocean nutrient
erotrophs all the way up to large jellyfish, fish, and whales.    and redox state using a new Biological Pump, Oxygen and
Some of the resulting particles sink very fast (McDonnell and     Phosphorus (BPOP) box model. This model combines a box
Buesseler, 2010).                                                 representation of the marine O and P cycles with an inter-
   How changes in the biological pump have affected ocean         mediate complexity representation of the biological pump
nutrient and redox state at different times in Earth history is   transformations, including two classes of particulate organic
a subject of active research and hypothesis generation. Previ-    matter (POM). BPOP allows us to modify the properties of
ous work has highlighted the Neoproterozoic Era, spanning         two POM pools, whose abundance is regulated by the pro-
from 1000 to 541 million years ago, as being of particular        cesses of production and coagulation. We focus on changes
interest because it saw a shift of dominance from prokary-        in the characteristic depths at which the two POM pools
otes to eukaryotes and a series of dramatic shifts in the cli-    are remineralized, i.e. the particle remineralization length
mate, biogeochemical cycling and ocean redox state (Katz          scale (zrem ), and study the resulting equilibrium budgets and
et al., 2007; Brocks et al., 2017). A common paradigm has         fluxes. The model has a deliberately simplified treatment of
been to assume that a progressive rise of oxygen in the at-       redox carriers and is designed to focus on ocean P and ocean
mosphere (of uncertain cause) drove the oxygenation of the        redox steady states, not on longer-term controls on atmo-
deep ocean at this time through air–sea gas exchange and          spheric oxygen. In the following sections we describe the
mixing, but equally, increases in the efficiency of the biolog-   model, provide an evaluation of its performance in the con-
ical pump could have lowered ocean phosphorus concentra-          text of modern observations and flux estimates, and finally
tion and thus oxygenated the ocean (Lenton et al., 2014). Re-     present and discuss our model results.
cent data show a series of transient ocean oxygenation events
∼ 660–520 Ma, which get more frequent over time, suggest-
ing a complex interplay of processes on multiple timescales,
including changes in the biological pump and ocean phos-          2     Model description
phorus inventory (Lenton and Daines, 2018).
   During the Phanerozoic Eon there have been further             Here we describe the Biological Pump, Oxygen and Phos-
changes to the biological pump. In particular, a rise of eu-      phorus (BPOP) model. The model was implemented us-
karyotic algae from the early Jurassic onwards is hypothe-        ing MATLAB, and the equations are solved by the built-in
sized to have increased the efficiency of the biological pump     ode15s solver. BPOP can easily run on a single core, inte-
and thus oxygenated shallow waters (Lu et al., 2018) but pre-     grating 50 million years of time in less than a minute on an
sumably deoxygenated deeper waters, at least in the short         ordinary machine and is therefore computationally efficient.
term. In the oceanic anoxic events (OAEs) that occurred dur-      We refer to the user manual (see the Supplement) for further
ing the Mesozoic Era there were major increases in prokary-       information on how to run the model.
otic nitrogen fixation yet evidence for a eukaryote-dominated
biological pump (Higgins et al., 2012), raising interesting       2.1    Variables and circulation
questions as to whether this reinforced anoxia at depth.
   Previous modeling work has examined the impact of              The box model resolves explicitly for each relevant box the
changes in the organic matter remineralization length/depth       local concentrations of three types of tracers: molecular oxy-
(zrem ) in the 3-D GENIE intermediate complexity model            gen O2 (O), inorganic dissolved phosphorus (P) and sedi-
(Meyer et al., 2016; Lu et al., 2018). Both studies clearly       ment organic phosphorus (SedPorg ). The total budgets of P
demonstrated the important control of the zrem on ocean oxy-      and O, respectively PTOT and OTOT , are also independently
gen concentrations – as it gets larger the oxygen minimum         integrated from the net sources and sinks of the two tracers
zone shifts to greater depths. Furthermore, Lu et al. (2018)      over the entire model domain, for the purpose of checking
showed that an increase in zrem can explain an observed deep-     mass conservation. The entire set of state and diagnostic vari-
ening of the oxycline from the Paleozoic to Meso-Cenozoic         ables in the model and their units are listed in Table 1. In the
in the ocean redox proxy I/Ca. However, coarse 3-D mod-           following subsections we describe the geometry of the box
els such as GENIE do not really resolve shelf seas and their      model and discuss the physical and geochemical fluxes that
dynamics, which are distinct from those of the open ocean.        drive the dynamics of the tracers. Box properties are listed in

Geosci. Model Dev., 13, 1865–1883, 2020                                             www.geosci-model-dev.net/13/1865/2020/
E. Lovecchio and T. M. Lenton: BPOP-v1 model                                                                                                                          1867

Table 1. List of the state variables in the model and of their units.

                            Name            Description                                                                           Units
                            Pss             Inorganic phosphorus in surface shelf sea box                                         mmol m−3
                            Pds             Inorganic phosphorus in deep shelf sea box                                            mmol m−3
                            Pso             Inorganic phosphorus in surface open ocean box                                        mmol m−3
                            Pdo             Inorganic phosphorus in deep open ocean box                                           mmol m−3
                            O ss            Molecular oxygen in surface shelf box                                                 mmol m−3
                            O ds            Molecular oxygen in deep shelf box                                                    mmol m−3
                            O so            Molecular oxygen in surface open ocean box                                            mmol m−3
                            O do            Molecular oxygen in deep open ocean box                                               mmol m−3
                            O at            Oxygen mixing ratio in atmosphere (mol per mol)                                       –
                            SedPorg s       Organic phosphorus in the sediments of the shelf sea                                  mmol m−2
                            SedPorg o       Organic phosphorus in the sediments of the open ocean                                 mmol m−2
                            PTOT            Diagnostic variable: total P budget from sources and sinks only                       Tmol P
                            O TOT           Diagnostic variable: total O budget from sources and sinks only                       Pmol O2

Table 2. Parameters set that describes geometry of the box model.

            Name           Description                                                            Value             Units      Source
            Molatmo        Millimoles of air in atmospheric box                                   1.8 × 10²³        mmol       –
            1Zeu           Depth of the euphotic layer in shelf and open ocean                    100               m          (1)
            1Zds           Depth of the deep shelf sea box                                        100               m          (2)
            1Zdo           Depth of the deep open ocean box                                       3500              m          (3)
            Aocean         Total area covered by the ocean                                        361 × 1012        m2         –
            Pshelf         Fraction of the total ocean area currently covered                     0.07              –          Barrón and Duarte (2015)
                           by the shelf sea (≤ 200 m deep)
          Notes: (1) we assume a constant average euphotic layer depth of 100 m in both shelf and open sea; (2) the shelf sea is assumed to be 200 m deep in total,
          in line with the definition of shelf sea by Barrón and Duarte (2015); and (3) we assume an average open ocean depth of 3600 m (including euphotic layer).

Table 2, while the set of parameters adopted for the modeled                              (in millimoles of O2 per cubic meter per year) is positive
physical and geochemical fluxes can be found in Table 3.                                  when directed into the ocean and depends on the gas transfer
                                                                                          velocity KW , atmospheric pressure pat (here assumed con-
2.1.1   Box properties and physical fluxes of inorganic                                   stant) and Henry’s constant KHenry , as in
        tracers
                                                                                          AirSeai = KW · (O at · pat /KHenry − O i ) · Ai /V i ,                       (2)
The box model includes four ocean boxes, one atmospheric
                                                                                          where KW (in meter per year) is a function of the prescribed
box and two sediment boxes (Fig. 1a). The ocean and sed-
                                                                                          mean temperature Tmean and wind speed Wspeed (Sarmiento
iment boxes are equally split between shelf sea and open
                                                                                          and Gruber, 2006).
ocean, both including one surface ocean box and one deep
ocean box.                                                                                2.1.2     Initialization and boundary fluxes
   O and P are exchanged between the four ocean boxes
through advection and mixing, including an upwelling recir-                               The model is initialized with an even concentration of P (Pini )
culation between shelf sea and open ocean (Wollast, 1998).                                in all the ocean boxes, zero oxygen (Oini ) and zero SedPorg
For a generic tracer concentration C and in the ith box, the                              ((Porg )ini ). A constant input of P from rivers (Pin ) into the
physical exchange flux (in millimoles per cubic meter per                                 surface ocean replenishes the P ocean reservoir despite the
year) is represented by                                                                   burial flux (net sink of Porg ) into the sediments. Pin is in part
AdvMix(C)i =
                 X
                      MassFluxij /V i · (Cj − Ci ),      (1)                              delivered directly to the surface open ocean (Sharples et al.,
                    j                                                                     2017). At equilibrium, the organic phosphorus (Porg ) burial
where MassFluxij represents the volumetric flow between                                   flux balances Pin . Oxidative weathering determined by at-
the ith box and any adjacent box j , while V i is the volume                              mospheric oxygen O at constitutes a net sink flux for O. The
of the ith box.                                                                           weathering flux (per year) depends on a constant baseline
   For each surface box i, air–sea gas exchange allows O                                  flux W0 , and it scales like the square root of the oxygen mix-
fluxes between the ocean and the atmosphere (at). The flux                                ing ratio normalized to present values Omix0 (Lenton et al.,

www.geosci-model-dev.net/13/1865/2020/                                                                             Geosci. Model Dev., 13, 1865–1883, 2020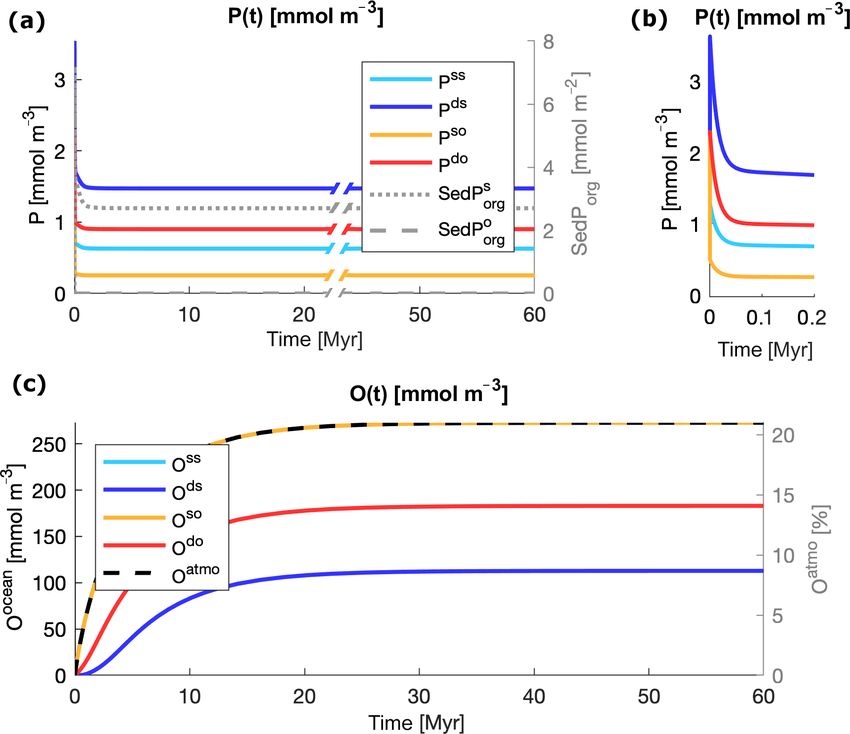
1868                                                                                                                 E. Lovecchio and T. M. Lenton: BPOP-v1 model

Table 3. Parameter set pertaining to the initial conditions of the model, circulation mass fluxes and boundary fluxes.

   Name           Description                                                                                    Value       Units                     Source
   Pini           Initial P concentration for all the ocean boxes                                                2.2         mmol m−3                  Watson et al. (2017)
   Oini           Initial O concentration for all the ocean and atmosphere boxes                                   0         mmol m−3                  –
   (Porg )ini     Initial Porg in all the sediment boxes                                                           0         mmol m−3                  –
   Upw            Upwelling cell mass fluxes                                                                       6         Sv (sverdrups)            (1)
   Mixvo          Vertical mixing in the open ocean                                                               40         Sv                        (2)
   Mixls          Lateral mixing at the surface                                                                  0.5         Sv                        (3)
   Mixld          Lateral mixing at depth                                                                        0.5         Sv                        (3)
   Mixvs          Vertical mixing in the shelf sea                                                                 1         Sv                        (4)
   spy            Seconds per year conversion factor (Sv to m3 yr−1 )                                    31 557 600          s yr−1                    –
   Pin            Total P river input                                                                     92 × 1012          mmol yr−1                 Slomp and Van Cappellen (2006)
   Popen          Fraction of river input delivered to the open ocean                                            0.4         –                         (5)
   OPRed          Oxygen to phosphorus Redfield ratio                                                           150          –                         Anderson and Sarmiento (1994)
   Tmean          Global mean temperature for the Schmidt number of oxygen                                    17.64          ◦C                        Sarmiento and Gruber (2006)
   Wspeed         Global mean wind speed for oxygen gas transfer velocity                                        7.5         m s−1                     Sarmiento and Gruber (2006)
   KHenri         Henry’s law constant                                                                  770 × 10−6           m3 atm mmol−1             –
   pat            Atmospheric pressure at sea level                                                                1         atm                       –
   Omix0          Today’s oxygen mixing ratio in atmosphere                                                    0.21          –                         –
   W0             Baseline oxidative weathering flux coefficient                                       9.752 × 10¹⁵          mmol yr−1                 (6)
 Notes: (1) Chavez and Messié (2009) estimate 5.5 Sv (sverdrups) in the four major upwelling systems alone; (2) compare to 38 Sv (Sarmiento and Gruber, 2006), 17 Sv of mixing flux in the
 Southern Ocean alone (Meyer et al., 2015), estimated open ocean downwelling 38.5 Sv and upwelling 34.5 Sv (Ganachaud and Wunsch, 2000); (3) cross-shelf mass exchange due to lateral
 recirculation, tides and mixing aimed at including exchange processes other than upwelling (Fennel et al., 2005; Cole et al., 2015; Wollast, 1998); (4) minimal assumption for vertical mixing in
 nearshore regions due to seasonal and eddy mixing; see also Sect. 3.2 Sensitivity to parameter choices; (5) up to 70 % of river outflow reaches the open ocean; see Sharples et al. (2017); and (6)
 calculated from the equilibrium solution given Pin .

                                                                                                       2018), following
                                                                                                                      q
                                                                                                       OxyWeath = W0 · O at /Omix0 .                                                               (3)

                                                                                                       2.2      Biological pump details

                                                                                                       The modeled tracer cycles are coupled with a set of biolog-
                                                                                                       ical transformations, i.e. the biological pump, governing the
                                                                                                       cycle of production, and remineralization and burial of Porg
                                                                                                       in the water column and in the sediments. Porg in the wa-
                                                                                                       ter column is resolved implicitly; at each time step all the
                                                                                                       produced Porg that does not reach the sediments is instanta-
                                                                                                       neously remineralized. In this sense, in our model no Porg can
                                                                                                       accumulate in the ocean water column, and we only calculate
                                                                                                       fluxes of water column Porg without treating Porg as a state
                                                                                                       variable. This scheme is similar to the one used to represent
                                                                                                       detrital POM in some modern ocean biogeochemical models
                                                                                                       (Moore et al., 2004). P and O biological fluxes are coupled
                                                                                                       with a fixed Redfield ratio OPRed . The next few paragraphs
                                                                                                       describe the cycle of production, coagulation, export, rem-
                                                                                                       ineralization and burial that constitute the biological pump
                                                                                                       representation. The full set of parameters used to resolve the
                                                                                                       Porg cycle is provided in Table 4.
Figure 1. Box model scheme with a representation of the physical
and boundary fluxes affecting inorganic tracers in the water column                                    2.2.1       Particle classes, production and coagulation
and atmosphere, where blue arrows indicate advective and mixing
fluxes and yellow arrows indicate air–sea gas exchange fluxes. The                                     The model includes two Porg classes that get produced, ex-
model includes seven boxes: surface shelf (ss), deep shelf (ds), sur-                                  ported and remineralized in the ocean water column, which
face open ocean (so), deep open ocean (do), atmosphere (at), shelf
                                                                                                       are small Porg (SPorg ) and large Porg (LPorg ). The use of two
sediments (s) and open ocean sediments (o).
                                                                                                       Porg classes is in line with modern ocean in situ observations,
                                                                                                       which reveal a bimodal distribution of the particle sizes and
                                                                                                       sinking speeds (Riley et al., 2012; Alonso-González et al.,

Geosci. Model Dev., 13, 1865–1883, 2020                                                                                            www.geosci-model-dev.net/13/1865/2020/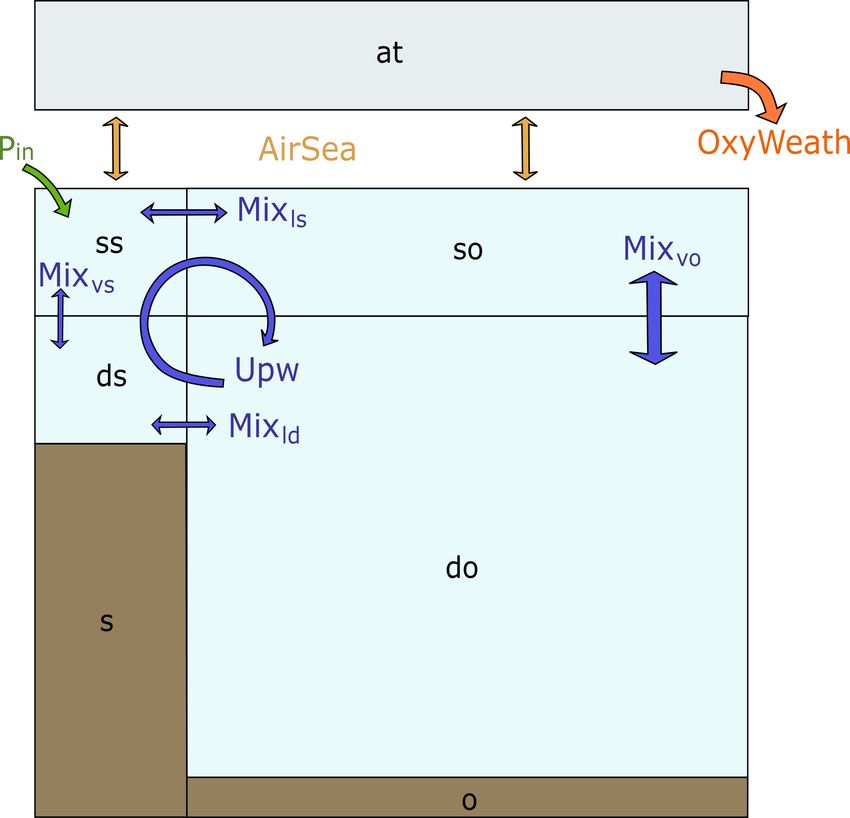
E. Lovecchio and T. M. Lenton: BPOP-v1 model                                                                                                                                  1869

Figure 2. Representation of the physical and biogeochemical fluxes affecting the Porg cycling in the model. Even though some processes
(such as burial as Ca–P) are here represented in detail only in one box, the set of biogeochemical processes regulating the Porg dynamics in
shelf sea and open ocean (both water column and sediments) is the same, as described in Sect. 2.2.

Table 4. Parameters set pertaining to the Porg cycle of the model and coupled biogeochemical fluxes.

   Name        Description                                                                 Value       Units                          Source
   Peff        P maximum uptake rate for production                                           0.8      yr−1                           (1)
   KP          Michaelis–Menten constant for P uptake                                         0.2      mmol m−3                       (2)
   KOs         Michaelis–Menten constant for aerobic remineraliza-                            0.2      mmol m−3                       (3)
               tion in the sediments
    w
   KO          Michaelis–Menten constant for aerobic remineraliza-                             15      mmol m−3                       (4)
               tion in the water column
   cgf         Coagulation fraction, determining the portion of small                        0.22      –                              (5)
               Porg production routed into large Porg
   rmr         Remineralization rate of sedimented Porg                                      0.36      yr−1                           (6)
   fean        Remineralization enhancement factor under anoxia                              1.25      –                              Slomp and Van Cappellen (2006)
   CaPr        Rate of formation of Ca–P mineral from sedimented                              0.5      (mmol m−2 )−1 yr−1             (7)
               Porg
   fsan        Ca–P formation dampening factor under anoxia                                   0.5      –                              Slomp and Van Cappellen (2006)
 Notes: (1) maximum P uptake rate, meant to account for environmental limitations of phytoplankton growth rate (such as light and temperature); the magnitude of the rate takes
 into account that we are not explicitly resolving phytoplankton concentrations (order of 10−2 mmol P); see also production in Gruber et al. (2006) and Yool and Tyrrell (2003);
 (2) measured values vary in the range from 0.01 mmol m−3 up to a few millimoles per cubic meter, varying for different phytoplankton types; see Lomas et al. (2014),
 Tantanasarit et al. (2013), Krumhardt et al. (2013), Lin et al. (2016) and Klausmeier et al. (2004); (3) measured half-saturation constant for oxygen uptake varies in the range of
 0.1–3 mmol m−3 (Ploug, 2001); (4) biogeochemical models commonly switch to anaerobic respiration below 4 mmol m−3 (Paulmier et al., 2009); measurements suggest a value
 close to 19 mmol m−3 (DeVries and Weber, 2017); (5) Cavan et al. (2017) showed that small particles are about 85 % of the total sinking particles abundance in the coastal region
 at export depth; the parameter was further tuned to bring the model closer to modern ocean conditions; (6) on the same order of magnitude as Gruber et al. (2006); (7)
 unmeasured – given the analogous adopted functional form, we assume Ca–P formation to happen on a timescale close to that of Porg coagulation in the water column in models
 with explicit particle pools (Gruber et al., 2006).

www.geosci-model-dev.net/13/1865/2020/                                                                                 Geosci. Model Dev., 13, 1865–1883, 2020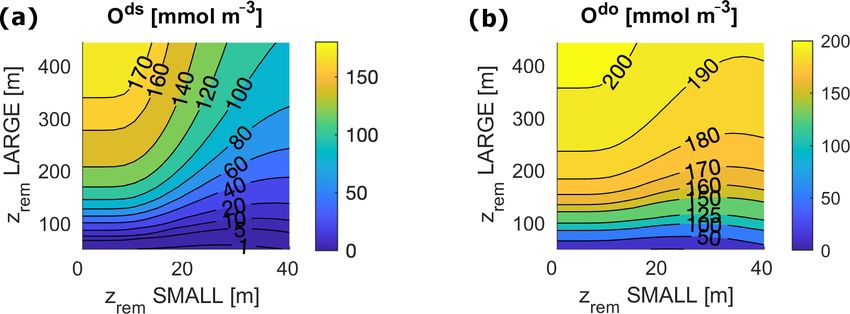
1870                                                                       E. Lovecchio and T. M. Lenton: BPOP-v1 model

2010). Moreover, it allows a better reproduction of the com-      the organic matter pool of reference, either small (S) or large
monly observed Martin power-law decay of the particle ex-         (L). This representation of the export flux is convenient, as it
port flux with the use of a remineralization length scheme of     does not depend on the specific choice of z0 (Boyd and Trull,
export and burial fluxes (Boyd and Trull, 2007).                  2007).
  Organic matter production happens only in the surface              The remineralization length zrem indicates the distance
ocean boxes through the uptake of P. This is regulated by         through which the particle flux becomes 1/e times (about
a maximum rate Peff and a Michaelis–Menten kinetics with          36 %) the flux at the reference depth (Buesseler and Boyd,
constant KP . Production (in millimoles of P per cubic meter      2009; Marsay et al., 2015). This quantity is expressed in me-
per year) in each ith box only generates SPorg , according to     ters and can be calculated as the ratio between the particle
                                                                  sinking speed and the remineralization rate of the particle
Prodi = Peff · (P i /(P i + KP )) · P i .                  (4)
                                                                  (Cavan et al., 2017). Consequently, zrem implicitly contains
LPorg is generated via the coagulation of SPorg at the sur-       information on several particle-inherent properties (among
face after production. As we do not explicitly solve for the      which are density, size, shape and organic matter liability)
concentrations of SPorg and LPorg , we assume that the coag-      as well as information about the surrounding environment,
ulation (in millimoles of P per cubic meter per year) of SPorg    e.g. the type of heterotrophs that feed upon the organic ma-
into LPorg in each box i is proportional to the rate of produc-   terial (McDonnell and Buesseler, 2010; Baker et al., 2017).
tion of small particles as follows:                               For simplicity, we assume that the remineralization length of
                                                                  small and large particles does not vary between shelf sea and
Coagi = cgf · Prodi .                                      (5)    open ocean boxes. We examine the potential impact of this
This is a necessary simplifying assumption compared to the        limitation in the Discussion section of the paper.
usual coagulation models, which define the flux as the square
of the particle concentration (Boyd and Trull, 2007; Gruber       2.2.4   Sediments and burial
et al., 2006), given the fact that our model does not resolve
                                                                  SPorg and LPorg accumulate in the sediments as SedPorg ,
this variable. Coagulation impacts the relative contribution
                                                                  which is calculated as a density per unit of area. The flux (in
of small and large particles to the export and burial fluxes by
                                                                  millimoles of P per square meter per year) into the sediment
subtracting from the local SPorg pool and adding to the LPorg
                                                                  box i depends on the organic matter fluxes into the overlay-
pool.
                                                                  ing deep ocean box j and on the remineralization length of
2.2.2   Physical fluxes of organic material                       the two pools as in

The implicit representation of the organic matter in the wa-      SedFlxi = Flx_SPorg j · exp −1Zj /zrem S
ter column implies that no organic matter is accumulated in
the ocean. In our baseline version of the model, correspond-                 + Flx_LPorg j · exp −1Zj /zrem L .               (7)
ing to the results presented in this paper, SPorg and LPorg
are redistributed throughout the water column exclusively by      The accumulated SedPorg is partially slowly remineralized
implicitly modeled gravitational sinking before being buried,     and partially irreversibly buried in a mineral form. Phospho-
accumulated in the sediments or remineralized. Even though        rus burial as mineral Ca–P is modeled as a function of the
the vertical export by downwelling and mixing (Stukel and         square of SedPorg that accumulates in the sediments and is
Ducklow, 2017) and the lateral organic matter redistribution      regulated by a constant rate coefficient CaPr . Ca–P forma-
(Lovecchio et al., 2017; Inthorn et al., 2006) may be impor-      tion happens at a lower rate under low-oxygen conditions
tant when working with suspended SPorg (zrem   S = 0), these      (CaP∗r = CaPr · f san with f san < 1), in agreement with ob-
fluxes are not currently accounted for in the model.              servations and previous models (Slomp and Van Cappellen,
                                                                  2006). The transition from aerobic and anaerobic conditions
2.2.3   Remineralization length scheme                            is controlled by a Michaelis–Menten type of function of the
                                                                  oxygen concentration in the deep ocean box j overlaying the
The export and sedimentation fluxes of Porg through the           sediment box i. The oxic and anoxic terms sum to the total
water column are represented by a remineralization length         formation term (in millimoles per square meter per year) as
scheme. In this representation, the vertical fluxes of organic    in
matter f (z) vary exponentially with depth. The shape of                                 2
the exponential depends on the value of the remineralization      CaPformi = SedPorg i ·
length (zrem ) of each organic matter species as follows:         h
                    −
                        z−z0                                        CaPr · O j / O j + KO s
f k (z) = f0k · e       zrem k   ,                         (6)                                               i
                                                                     + (CaPr · f san ) · 1 − O j / O j + KO s      .        (8)
where   f0kis the flux (in millimoles of P per square meter
per year) at the reference depth z0 , and the index k indicates

Geosci. Model Dev., 13, 1865–1883, 2020                                             www.geosci-model-dev.net/13/1865/2020/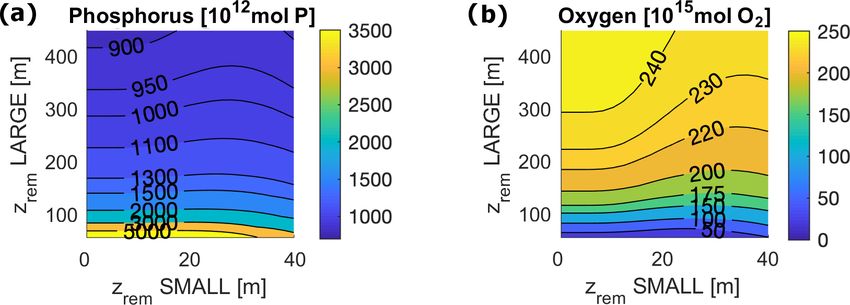
E. Lovecchio and T. M. Lenton: BPOP-v1 model                                                                              1871

  This flux is essential to balance the continuous P river in-   overlaying water column. Aerobic remineralization takes up
put, therefore preventing the ocean from overflowing with        oxygen from the overlaying deep water box j and happens
nutrients.                                                       at a rate rmr , while being limited by a Michaelis–Menten co-
                                                                 efficient. Anaerobic remineralization releases its product to
2.2.5   Remineralization in the water column and                 the atmosphere and happens at a faster rate rmr ∗ = rmr · fean
        sediments                                                with fean > 1, in agreement with recent observations and pre-
                                                                 vious models (Slomp and Van Cappellen, 2006). The release
At each time step, remineralization in the water column com-     of Porg from a sediment box i into the overlaying ocean box
pletely depletes the Porg that has not reached the sediments.    due to sediment remineralization (in millimoles of P per cu-
In the two surface boxes, remineralization of Porg that is not   bic meter per year) is therefore the sum of the two terms as
exported below the euphotic layer uses up part of the oxygen     in
that was released by production. For this reason, net oxygen
production in each surface box is proportional to the export     SedRemi = rmr · SedPorg i · O j / O j + KO s
of Porg below the euphotic layer. The overall loss of P due
to export (in millimoles of P per cubic meter per year) from        + (rmr · fean )
a surface box i to a deep box j via gravitational sinking, is

                                                                    · SedPorg i · 1 − O j / O j + KO s      /1Zd .         (11)
calculated as

VExpi = Flx_SPorg i · exp − (1Zeu /2)/zrem S                     2.3   Equations summary

         + Flx_LPorg i · exp − (1Zeu /2)/zrem L /1Zi , (9)       The dynamics of the 11 state variables in the model are reg-
                                                                 ulated by just as many equations. We summarize here the
where the fluxes per unit of area of SPorg and LPorg in the      major terms for P, O and SedPorg in the surface ocean (s),
surface boxes depend on production and coagulation as de-        deep ocean (d), atmosphere (at) and sediments, without dis-
scribed in Sect. 2.2.1.                                          tinguishing between coastal and open ocean boxes and as-
   At depth, the remineralization of Porg that does not reach    suming that all terms have been scaled with dimensions of
the sediments happens through both aerobic and anaero-           the reference boxes or number of moles (atmosphere). A full
bic processes, completely depleting the remaining Porg . The     set of equations including the explicit formulation of all the
amount of inorganic P released in each deep box j by water-      flux terms for each box can be found in the Appendix.
column remineralization (in millimoles of P per cubic meter
                                                                 dP s
per year) is therefore calculated as                                   = Pin + AdvMix(P )s − VExp                          (12)
                                                                  dt
                                                                 dP d

WcRemj = Flx_SPorg j · 1 − exp −1Zj /zrem S                            = AdvMix(P )d + WcRem + SedRem                      (13)
                                                               dt
   + Flx_LPorg i · 1 − exp −1Zj /zrem L        /1Zj .    (10)    dO s
                                                                       = AdvMix(O)s + VExp · OPRed + AirSea                (14)
                                                                  dt
In each deep ocean box i, aerobic remineralization uses          dO d
some of the available oxygen and is therefore limited                  = AdvMix(O)d − WcRemAer · OPRed
                                                                  dt
by Michaelis–Menten kinetics with a half-saturation constant
                                                                         − SedRemAer · OPRed                               (15)
K w O (DeVries and Weber, 2017). Anaerobic remineraliza-
tion takes up the entire remaining Porg that is not reminer-     dSedPorg
                                                                           = SedFlx − CaPform − SedRem · 1Zd               (16)
alized aerobically and releases a product, which bubbles up          dt
to the atmosphere, reacting with atmospheric oxygen. In our      dO at      X
                                                                        =−      AirSea − WcRemAna · OPRed
model, the reducing agent produced by anaerobic remineral-        dt
ization is methane gas, and it is only produced when the sed-             − SedRemAna · OPRed − OxyWeath,                  (17)
iments and the deep shelf water column have gone anoxic.
As we do not track other oxidizing agents such as SO4 , there    where Pin is the river input of P to the surface of the ocean
is nothing for the methane to be oxidized by until it reaches    and AdvMix indicates the advective and mixing physical
the surface ocean, and as the surface ocean is equilibrated      fluxes of the variable of interest (which differ for each box
with the atmosphere, the fact that we assume oxidation in        according to the circulation scheme); Exp is the export flux of
the atmosphere is a reasonable approximation. In each sedi-      Porg in P units; WcRem indicates the water column complete
ment box i, remineralization of SedPorg happens in a similar     remineralization of the organic material in P units, which is
way to remineralization in the water column, with an aero-       split into an anaerobic (Ana) and aerobic (Aer) component;
bic and an anaerobic component. However, remineralization        SedRem indicates the sediment remineralization of SedPorg
in the sediments is not instantaneous but rather happens at      in P units (also aerobic and anaerobic); AirSea represents the
a fixed rate which depends on the oxygenation state of the       air–sea flux exchange of O; OxyWeath is the O weathering

www.geosci-model-dev.net/13/1865/2020/                                             Geosci. Model Dev., 13, 1865–1883, 2020
1872 E. Lovecchio and T. M. Lenton: BPOP-v1 model
flux sink; SedFlx is the SedPorg accumulation flux as regu- that is on the order of a few tens of thousands of years, which
lated by the remineralization length scheme at the bottom of is the typical timescale of the P cycle.
the water column; and finally CaPform represents the sed-
iment burial flux of P in mineral form. For each box, flux 3.2 Modern ocean budgets and fluxes
terms are rescaled with the appropriate box geometry.
Modern estimates of the zrem S and zrem L vary depending on
2.4 Strategy: sensitivity studies for varying zrem the region of sampling and on the local community struc-
ture, with most of the measurements focusing on large or
In order to characterize the model, we analyze the equilib- heavy particles and most studies focusing on the open ocean
rium budgets and fluxes of the state variables for varying (Iversen and Ploug, 2010; Cavan et al., 2017; Lam et al.,
zrem values separately for SPorg and LPorg , respectively zrem S 2011). Furthermore, only a very limited number of measure-
and zrem L . We adopt a range of zrem values that fall close ments account for both microbial and zooplankton reminer-
to modern observations (Cavan et al., 2017; Buesseler and alization, the latter disregarded by lab measurements of zrem
Boyd, 2009; Marsay et al., 2015) and takes into consider- (Cavan et al., 2017). Considering the fundamental role of the
ation our future aim to apply the model to simulate the im- shelf sea in our model (always accounting for > 98 % of the
pact of the time evolution of the early biological pump (at the total burial), we evaluate modeled tracer budgets and fluxes
Neoproterozoic–Paleozoic transition). For this reason, we do for values of zrem L that lie around 76 m, as measured in situ
not push the range as far as what would be needed to consider by Cavan et al. (2017) for a modern shelf sea. We pose no re-
the impact of fast sinking rates typical of silicified or calci- strictions on zrem S due to the lack of precise measurements.
fied small phytoplankton (McDonnell and Buesseler, 2010; A summary of our evaluation is provided in Table 5.
Lam et al., 2011). In our sensitivity simulations, zrem S is in In the above-mentioned range of zrem , our model pre-
the range of 0–40 m, while zrem L varies in the range of 50– dicts equilibrium budgets of between 2250 and 2970 Tmol P
450 m. for phosphorus and an oxygen budget of between 100 and
107 Pmol O2 in the entire ocean, compared to the estimated
3 Evaluation total P reservoir of 3100 Tmol P (Watson et al., 2017) and es-
timated ocean O2 reservoir of between 225 and 310 Pmol O2
3.1 Timescales (Keeling et al., 1993; Duursma and Boisson, 1994). Due to
the relative size of the ocean boxes, it is important to under-
Starting from the initial values listed in Table 3, the modeled line that total budgets are strongly driven by the deep open
state variables evolve towards equilibrium for any pair of val- ocean budget and that the low-oxygen reservoir of our model
ues of zrem S and zrem L in the explored interval. Simple mass may be connected to an underestimation of the deep open
conservation checks show no hidden source or sink of tracers ocean oxygenation.
in the boxes of the model. Figure 3 illustrates an example of Deep shelf P and O concentrations lie in the ranges of 3.9–
evolution of the variables for zrem S and zrem L in the middle of 4.9 mmol m−3 and 3.8–9.2 mmol m−3 , respectively (Figs. 5
the interval of explored values for both particle types. In all and 6). Deep shelf nutrient concentrations are higher than
the ocean boxes, P shows an initial oscillation that evolves expected by about a factor of 2 compared to modern val-
on timescales of tens of thousands of years (Fig. 3a, b), as ues, possibly due to the fact that our model does not store
expected by the typical timescale of evolution of the tracer any Porg in the water column or due to an underestimation of
(Lenton and Watson, 2000). This is followed by a slower the vertical supply of nutrients to the surface shelf (e.g. via
drift, which depends on the dynamics of the deep water oxy- mixing). Limiting deep P concentrations via lower reminer-
gen content, as the release and burial of P in the sediments alization or higher burial rates, however, also results in sen-
depend on the level of oxygenation of the deep ocean and es- sibly lower production rates. In the deep open ocean, P and
pecially of the deep shelf sea. P reaches complete equilibrium O concentrations fall in the ranges of 1.9–2.5 mmol m−3 and
as soon as the deep ocean boxes become stably oxygenated. 76–83 mmol m−3 , respectively. For any combination of zrem S
The timescales of the evolution of O are slower and lie on the and zrem L , O levels in surface ocean boxes lie between 273
order of tens of millions of years (Lenton and Watson, 2000). and 274 mmol m−3 , a good approximation of average mod-
Oxygen in the deep shelf overcomes hypoxia after the first ern surface values (Garcia et al., 2018b). In general, the deep
few millions of years and then slowly evolves towards equi- shelf always shows the highest P values and lowest O con-
librium on the same timescale of O in the other ocean boxes. centrations compared to the other ocean regions, while, as
The dynamics of SedPorg are also strongly driven by level of expected, the surface shelf sea is richer in P compared to the
oxygenation of the deep shelf sea. The dynamical response of surface open ocean.
the model to changes in the biological pump is rapid subse- In order to compare the modeled fluxes to modern esti-
quent to the model equilibrating considering the given initial mates, we converted our results into carbon (C) units assum-
conditions. For example, step changes in the zrem values of ing a C : P Redfield ratio of 106. However, recent studies
the particles result in a transition time to a new equilibrium found a substantially higher mean C : P ratio for the modern
Geosci. Model Dev., 13, 1865–1883, 2020 www.geosci-model-dev.net/13/1865/2020/E. Lovecchio and T. M. Lenton: BPOP-v1 model 1873
Figure 3. Evolution of the state variables from the initial conditions listed in Table 2 and remineralization lengths roughly in the middle of
the interval of explored values, zrem S = 20 m and zrem L = 250 m. (a) Evolution of inorganic phosphorus P in the water column (left axis)
and of organic phosphorus in the sediments SedPorg (right axis). (b) A zoomed-in view of the dynamics of P in the first 200 000 years.
(c) Evolution of oxygen in the water column (left axis) and atmosphere (right axis). In (c) the two lines O ss and O so are overlapping; the
two variables evolve closely due to the coupling of the surface ocean with the atmosphere via air–sea gas exchange.
Table 5. Summary of the model evaluation provided in Sect. 3. Modern observations and estimates are compared to model results obtained
for zrem L in the range of measured values for a modern shelf sea (Cavan et al., 2017).
Quantity Model Modern values or estimates Units Source
Total ocean P 2250–2970 3100 Tmol P Watson et al. (2017)
Total ocean O2 100–107 225–310 Pmol O2 Duursma and Boisson (1994); Keeling et al. (1993)
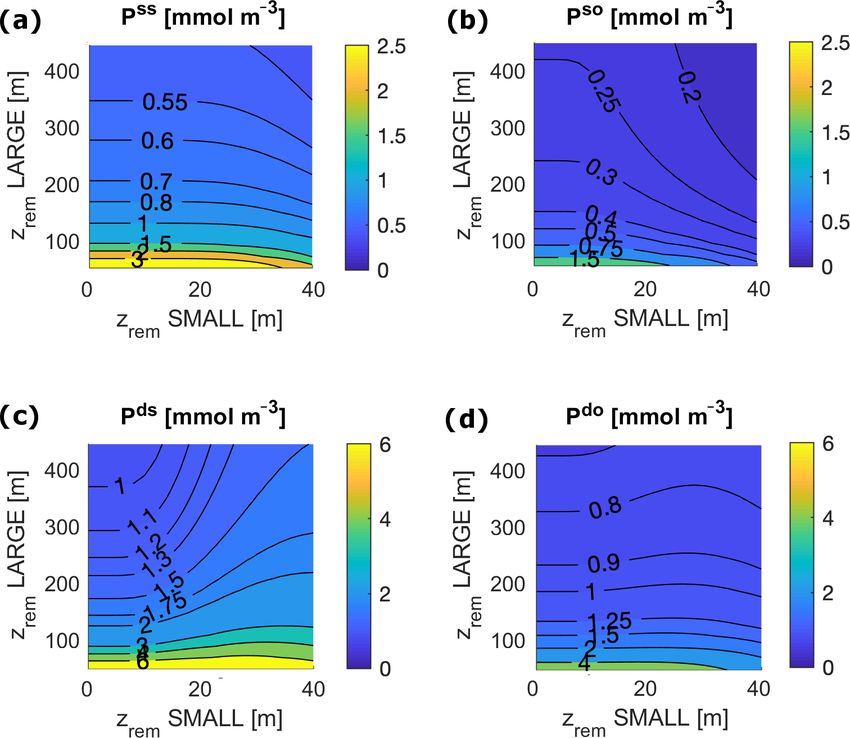
P ss 1.4–2 1–1.5 mmol m−3 Garcia et al. (2018a); Sarmiento and Gruber (2006)
P ds 3.9–4.9 2.2 mmol m−3 Garcia et al. (2018a); Watson et al. (2017)
P so 0.4–0.9 0.2–2 mmol m−3 Garcia et al. (2018a); Sarmiento and Gruber (2006)
P do 1.9–2.5 1–3 mmol m−3 Garcia et al. (2018a); Sarmiento and Gruber (2006)
O ss 273–274 200–350 mmol m−3 Garcia et al. (2018b)
O ds 3.8–9.2 0–80 mmol m−3 Garcia et al. (2018b)
O so 273 200–350 mmol m−3 Garcia et al. (2018b)
O do 76–83 40–200 mmol m−3 Garcia et al. (2018b)
Production (Prod) 11–30 35–80 Gt C yr−1 Carr et al. (2006)
Export 3.4–3.8 4–20 Gt C yr−1 Henson et al. (2011)
Export production 11 %–33 % 2 %–20 % of total Prod Boyd and Trull (2007)
Burial 0.3 %–1 % 0.4 % of total Prod Sarmiento and Gruber (2006)
Shelf sea production 16 %–27 % 20 % of total Prod Barrón and Duarte (2015); Wollast (1998)
Shelf sea export 16 %–27 % 29 % of total export Sarmiento and Gruber (2006)
Shelf sea burial 100 % 91 % of total burial Sarmiento and Gruber (2006)
www.geosci-model-dev.net/13/1865/2020/ Geosci. Model Dev., 13, 1865–1883, 20201874 E. Lovecchio and T. M. Lenton: BPOP-v1 model
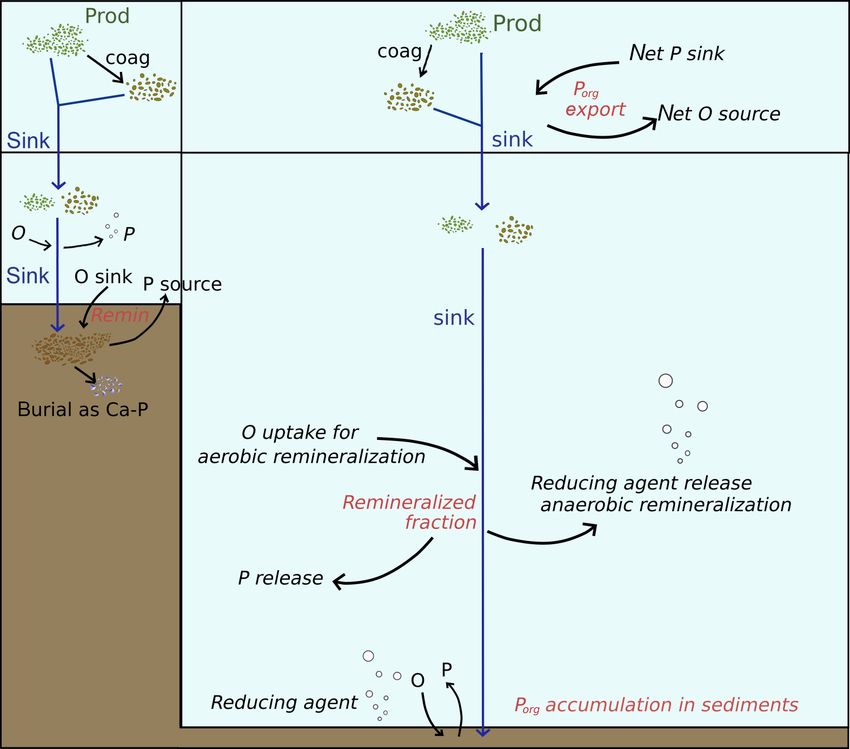
Figure 4. Total ocean budgets of (a) P and (b) O at equilibrium for
varying zrem S and zrem L .
ocean (Martiny et al., 2014); therefore our derived C fluxes
may be a conservative estimate. Modeled biological fluxes in
C units, such as production and export, fall just below the low
end of present estimates (Fig. 7). Our model predicts a to-
tal primary production of between 11 and 30 Gt C yr−1 , and
an export below the euphotic layer ranges between 3.4 and
3.8 Gt C yr−1 . These must be compared to an expected value
Figure 5. Local P concentration in each ocean box for varying
of production of between 35 and 80 Gt C yr−1 (Carr et al.,
zrem S and zrem L for the following: (a) surface shelf sea, ss; (b)
2006) and an estimated export flux of at least 4 Tmol C yr−1 surface open ocean, so; (c) deep shelf sea, ds; and (d) deep open
(Henson et al., 2011). Despite the absolute fluxes being at the ocean, do. Surface ocean boxes, as well as deep ocean boxes, are
low end of the present estimates, modeled export production plotted on the same scale.
(the export to production ratio) and the burial to production
ratio compare well to range of present estimates. The mod-
eled export corresponds to between 11 % and 33 % of total
production, strongly depending on zrem S , compared to an ex- 4 Results
pected range of 2 %–20 % (Boyd and Trull, 2007). Buried
Porg corresponds to between 0.3 % and 1 % of total produc- 4.1 Budgets and fluxes sensitivity to changes in zrem
tion, compared to an expected 0.4 % (Sarmiento and Gruber,
2006). Around the lowest values of zrem L adopted in the present
In terms of the shelf contribution to the total fluxes, model study, i.e. in the range of 50–100 m, our model shows a strong
results also fall close to present estimates. Modeled pro- sensitivity of the total and local ocean P and O budgets to
duction in the surface shelf sea represents between 16 % small changes in zrem L (Fig. 4). This is true for any zrem S ,
and 27 % of total production (expected 20 %) (Barrón and with minor differences between low and high zrem S values.
Duarte, 2015; Wollast, 1998). The fraction of modeled ex- For smaller zrem L , the model shows a sharp increase in P
port and burial that happens in the shelf region represent, re- concentrations in all the ocean boxes and a substantial de-
spectively, [16 %, 27 %] and nearly 100 % of the total ocean crease in O levels at depth (Figs. 5 and 6), which are cou-
fluxes, compared to estimated modern values of 29 % and pled with high levels of production and remineralization and
91 % (Sarmiento and Gruber, 2006). Our overestimation of low rates of sedimentation (Fig. 7). Essentially, slow sinking
the shelf contribution to the burial fluxes may be due to the and/or rapid remineralization results in inefficient removal of
underestimation of the zrem of open-ocean particles com- P to shelf sea sediments, requiring the ocean concentration of
pared to observations (Cavan et al., 2017; Lam et al., 2011), P to rise considerably for P output to balance (fixed) P input
i.e. our choice of using the same value of zrem S and zrem L to the ocean.
for both the coastal and the open ocean box. This simplify- Our model results show that for any pair of values of zrem S
ing assumption limits the capacity of Porg to reach the deep and zrem L in the entire explored range, the biological pump is
sediment layer in the open ocean. We explore potential limi- able to oxygenate the surface ocean (surface O levels lie close
tations of this choice in the Discussion section. to 273 mmol m−3 ) and, for most values, also to maintain the
deep ocean above the level of hypoxia (Fig. 6). The model
shows a substantial difference between the deep shelf and the
deep open ocean; while the latter is substantially oxygenated
(O > 50 mmol m−3 ) for nearly any values of zrem S and zrem L ,
the deep shelf is hypoxic or even suboxic for a broad range
of small values of zrem L , especially close to modern shelf
zrem L observations. Considering the wide spatial extension
Geosci. Model Dev., 13, 1865–1883, 2020 www.geosci-model-dev.net/13/1865/2020/E. Lovecchio and T. M. Lenton: BPOP-v1 model 1875
tude the modern observed values. Considering all of the
ocean boxes, P concentrations vary in the range of roughly
0.2 and 9 mmol m−3 , while O levels lie between 0.5 and
205 mmol m−3 . Production in carbon units lies in the inter-
val [7.6, 70.7 Gt C yr−1 ].
4.2 Budgets and fluxes contribution by particle class
The relative role of small and large particles in modeled bi-
Figure 6. O concentrations at equilibrium for varying zrem S and ological and physical fluxes depends on a combination of
zrem L for the following: (a) deep shelf sea, ds; (b) deep open ocean, their inherent properties (zrem ) and coagulation. In our sim-
do. Surface ocean boxes (not shown) have nearly constant values of
ple model, coagulation of SPorg into LPorg after production in
O for any set of zrem due to the air–sea gas exchange, which strongly
couples them to the atmosphere.
surface boxes affects a constant fraction (cgf = 0.22) of the
produced particles. This fraction was determined by model
tuning to modern ocean conditions and lies close to modern
ocean observations of the large-particle fraction (15% of the
total particles) at export depth (Cavan et al., 2017).
For zrem L > 100 m, LPorg efficiently removes P from the
water column, limiting production. The contribution of SPorg
to the total export below the euphotic layer, however, is
strongly dominated by the value of zrem S , with a null con-
tribution to export for all values of zrem S < 10 m and increas-
ing values above it. This trend is reflected in the deep water
small-particle fraction (Fig. 8c, d). Small particles contribute
up to 73 % to export in both ocean boxes and up to 60 % to
the sediment accumulation in the shelf sea, with the high-
est contribution to sediment accumulation being reached for
large zrem S and low zrem L . Our model highlights therefore the
different role of large and small particles in the determination
of the equilibrium budgets and fluxes. Coagulation into large
(fast sinking and less liable) particles is essential to maintain
high enough sedimentation and burial rates, therefore allow-
ing O accumulation in the system. At the same time, small
Figure 7. Biological pump fluxes in P units for the entire ocean for (slow sinking and more liable) particles tune the total magni-
varying zrem S and zrem L in the following cases: (a) Porg surface tude of export and remineralization below the euphotic layer,
production; (b) Porg export through the euphotic layer depth; (c)
affecting the distribution of oxygen and nutrients throughout
export / production, i.e. export to production ratio; and (d) burial to
the water column.
production ratio.
5 Discussion
of our boxes, we expect these low oxygen levels to indicate
the development of local anoxia in the deep shelf. 5.1 Model limitations and robustness
In a limited interval of small zrem S values (roughly zrem S <
6 m), model results depend only on the LPorg properties 5.1.1 General limitations
due to the rather irrelevant contribution of SPorg to export
and remineralization. For larger zrem values (zrem S > 6 m BPOP consists of a simple box model with four ocean boxes,
and zrem L > 100 m), model results show a strong interdepen- two sediment boxes and one atmospheric box. As with every
dence of equilibrium budgets and absolute fluxes on both box model, BPOP only allows a very rough and fundamen-
zrem S and zrem L . Interestingly, in this range of values, ex- tal representation of the topography and circulation of the
port production depends very strongly on the small particle ocean as well as of the exchange fluxes between ocean, atmo-
properties, ranging between 10 % for low zrem S and 30 % for sphere and sediments. Even though this may be a limitation
high zrem S , an overall trend that also affects the ratio of deep in the context of the study of the well-known modern (and fu-
remineralization to surface production (Fig. 7). ture) ocean, such a computationally inexpensive model can
It is also important to notice that, for any couple of zrem S be a useful tool to for a first exploration of a large variety
and zrem L , modeled tracer concentrations and fluxes fall in of projected conditions. In the context of understanding past
a range of values that never exceeds by orders of magni- ocean changes, often characterized by a limited availability
www.geosci-model-dev.net/13/1865/2020/ Geosci. Model Dev., 13, 1865–1883, 20201876 E. Lovecchio and T. M. Lenton: BPOP-v1 model
of observational data, the use of such a simple model consti- ing to high production and particle concentrations (and vice
tutes instead an effective and honest approach to understand- versa). We reserve this improvement as our first step for fur-
ing global shifts in budgets and fluxes. Furthermore, BPOP ther model developments, which will include an explicit Porg
explicitly distinguishes between the well-sampled shelf sea representation.
and the less known open ocean of deep time; therefore al- Modeled particles get remineralized through the water col-
lowing the relation of shelf data with large-scale open ocean umn according to their characteristic zrem . Even though for
conditions. simplicity we do not use a continuous spectrum of zrem , the
The model deliberately simplifies the redox carriers and use of two particle classes is in line with observations show-
processes represented, neglecting denitrification and iron ing two distinct peaks in the observed distribution of the
and sulfate reduction. Including additional oxidants and/or sinking speeds of the particles (Riley et al., 2012; Alonso-
methane consumption in deeper water column would be ex- González et al., 2010). Furthermore, this simplification still
pected to intensify anoxia results at depth. However, our cur- allows us to closely approximate the empirical particle flux
rent results suggest that the model is underestimating the curve as a function of depth, also known as Martin’s curve
ocean total oxygen budget overall, mostly driven by the deep (Boyd and Trull, 2007).
open ocean reservoir. This suggests that neglecting these ad- We assume that zrem S and zrem L do not vary between the
ditional processes in our simple box model does not lead to shelf sea and the open ocean. However, modern ocean obser-
an overestimation of oxygen accumulation at depth. Includ- vations show cross-shore changes in the phytoplankton com-
ing additional state variables and processes could also lead to munity structure and sinking speeds (Barton et al., 2013).
more complex dynamical behaviors (Wallmann, 2010). Our simplifying assumption may therefore cause the overes-
We include anaerobic remineralization of Porg as being timation of the relative contribution of the shelf sea to the to-
faster than aerobic degradation, but in reality this is not the tal burial flux of Porg . Despite this, we believe that this choice
case for carbon – which is remineralized at a similar or is still convenient in the context of the current model, as it
slower rate under anoxic vs. oxic conditions (Burdige, 2007; allows us to reduce the number of parameters in such a sim-
Hedges et al., 1999; Dale et al., 2015). Hence, in reality, un- ple box model representation of the biological pump of the
der anoxic conditions, there is preferential regeneration of ocean.
phosphorus and organic C : P burial ratios rise considerably, Observations suggest that hard-shelled phytoplankton
altering the long-term steady state of atmospheric oxygen types, especially calcified cells, contribute substantially to
(Van Cappellen and Ingall, 1996). We do not consider these the vertical export and burial of the organic material thanks
aspects here because to do so would require adding state vari- to extremely large zrem despite their small size (Lam et al.,
ables for organic carbon (as distinct from organic phospho- 2011; Iversen and Ploug, 2010). In the present study we fo-
rus) and because our focus here is on changes in ocean phos- cus on an interval of zrem S and zrem L values that are most
phorus and ocean redox under an unchanged oxygen steady likely to resemble the biological pump conditions of the
state. In future work we intend to elaborate the model in or- Neoproterozoic–early Paleozoic ocean, before the evolution
der to explore long-term effects on atmospheric oxygen. of such phytoplankton types. However, the model allows the
exploration of different ranges of zrem S and zrem L values and
5.1.2 Limitations connected to the biological pump the tuning of the rate of coagulation in order to explore the
representation influence of these phytoplankton classes.
Even though bacterial remineralization is thought to be the
In our model we adopt a very simplified representation of dominant pathway for organic matter recycling on a global
the biological pump, including two particle classes, “small” scale, especially at low latitudes (Rivkin and Legendre,
and “large”, generated by production and coagulation, as- 2001), modern ocean coastal environments are also charac-
suming that, on average, zrem S < zrem L . This scheme resem- terized by high grazing rates. The evolution of zooplankton
bles the one commonly used in ocean biogeochemical mod- and increasingly large grazers may have had a different im-
els (Gruber et al., 2006; Jackson and Burd, 2015). Our model pact on the effective zrem S and low zrem L , given additional
does not include a dissolved organic matter (DOM) pool for Porg transformations such as particle fragmentation due to
reasons mostly connected to the implicit representation of sloppy feeding (Cavan et al., 2017; Iversen and Poulsen,
the biological pump and the complete remineralization of 2007). These processes can limit the large-particle burial
the non-sedimented organic material at each integration step. rates, while resulting in the deep production of small par-
For the same reason, we do not resolve particle Porg con- ticles, suspended particulate organic matter (s-POM) and
centrations, and therefore we model the coagulation flux as DOM. Our model does not currently account for particle
a constant fraction of production. A more physical represen- fragmentation, however the process could be easily consid-
tation of coagulation would require this flux to scale with the ered in future model developments. In this context, new pro-
square of the particle concentrations (Boyd and Trull, 2007). cesses such as the sedimentation and burial of large grazers
Such a further development could potentially lead to increase should also be considered.
large particle export for high surface P concentrations lead-
Geosci. Model Dev., 13, 1865–1883, 2020 www.geosci-model-dev.net/13/1865/2020/E. Lovecchio and T. M. Lenton: BPOP-v1 model 1877
5.1.3 Sensitivity to parameter choices higher rates of formation of mineral Ca–P (CaPr ) result in
a general increase in O levels and decrease in nutrient avail-
We discuss here the model sensitivity to changes in a set of ability due to larger sedimentation and burial rates. However,
significant parameters adopted to describe its geometry, cir- we find again no substantial change in the model behavior
culation and biological processes. Overall, none of the sen- nor in the relative contribution to budgets and fluxes of each
sitivity experiments showed significant changes in the model modeled ocean box.
results and conclusions; trends in budgets and fluxes obtained Furthermore, we have tested the impact of having sedi-
varying zrem S and zrem L and our main results regarding the ment remineralization rates that vary with the zrem of the
relative deep shelf and open ocean oxygenation remain un- particles, under the assumption that the liability of small and
changed. large particles may be different. In our experiment, we in-
Among the geometrical box model parameters, a key value creased the remineralization rmr rate linearly with zrem by
is represented by the percentage of shelf sea area (Pshelf ). An 40 % of our baseline value (rmr 0 ), with rmr 0 being found
increase (e.g. doubling) in Pshelf results in an overall decrease at the center of the interval of explored values of zrem =
in the total budget of P and increase in O due to the larger ra- [0, 450 m]. Under these conditions, we obtained a higher de-
tio of burial to production, which is facilitated by a larger coupling between the influence of zrem S and zrem L on bud-
extension of the surface of shallow water. Interestingly, deep gets and fluxes, both being more strongly driven by the small
shelf anoxia is enhanced for larger Pshelf ; i.e. anoxia is ob- particle properties for large values of zrem L .
served for a wider range of zrem S and zrem L values, while the
deep ocean tends to be more oxygenated. Despite a doubling 5.2 Model applications
of Pshelf , however, model results largely remain in the same
range of those found for modern Pshelf . 5.2.1 Past changes in the biological pump
We explored the effect of varying the physical circulation
parameters. Changes in upwelling (Upw), have an important The evolution of larger and heavier cells during the Neo-
impact on the budgets of the modeled ocean. An increase in proterozoic and across the Neoproterozoic–Paleozoic tran-
Upw induces a lowering of P levels, especially in the deep sition is hypothesized to have caused significant changes in
shelf, due to their recirculation towards the surface and con- the nutrient and redox state of the ocean (Lenton and Daines,
sequent uptake by production. This is coupled with an overall 2018). Our new model can be used to assess the impact of
larger equilibrium O budget due to higher storage in the deep this evolution in both the shelf and the open ocean. Our
open ocean and consequent recirculation into the deep shelf. first model results highlight that for small zrem L , i.e. for an
Deep shelf suboxia is still possible but for a more limited early biological pump with reduced capacity of export and
range of zrem L values. Changes in vertical mixing in the open burial, nutrient levels and production rates are particularly
ocean (Mixvo ) affect the overall P and O budgets mostly for high. At the same time, an increase in zrem S alone, fueling
high zrem L . For lower Mixvo , the O budget decreases due to higher remineralization rates at depth, can induce anoxia in
lower O storage at depth, while P increases. Changes in verti- the deep shelf while still maintaining the deep open ocean
cal mixing on the shelf (Mixvs ), instead, have a minor impact substantially oxygenated. The possibility of a coexistence of
on the total budgets and fluxes of the model, while locally an anoxic deep shelf with an oxygenated deep open ocean
modulating shelf oxygen and nutrient concentrations. Lateral has important implications for the interpretation of deep time
mixing fluxes (Mixls , Mixld ) were included in our model for redox proxy data, which come almost exclusively from shelf
means of generalization and in order to account for the in- and slope environments yet have been widely used to infer
fluence of non-upwelling margins, with a lower value than in deep ocean anoxia for most of the Proterozoic Eon (Lenton
previous studies (Fennel et al., 2005). Changes in Mixls and and Daines, 2017). We plan to use our model to further ex-
Mixld result in significant changes in the deep ocean storage plore these changes from a time-frame perspective, introduc-
of tracers and open ocean production, with little impact on ing time-varying boundary conditions (such as changes in
the budget of the other ocean boxes. However, in this case Pin ) and parameter properties.
also, our main conclusions remain unaffected. Phytoplankton evolution as well as the development of
We explored the impact of changing the portion of nutri- heavier and larger marine organisms continued throughout
ents delivered directly to the open ocean, Popen . Even large the Phanerozoic (Katz et al., 2007). BPOP can also be used to
changes in this parameter do not significantly affect the re- explore the role of the biological pump in the onset of OAEs
sults of the model, indicating that the relative levels of P in the course of the Mesozoic Era, likely induced by en-
and O at equilibrium are determined by the internal physi- hanced productivity due to an upwelling intensification (Hig-
cal and biogeochemical dynamics of the model, rather than gins et al., 2012). During the Mesozoic Era, the evolution
by boundary conditions. of dinoflagellates and calcareous and silica-encased phyto-
Lastly, we explored the model sensitivity to the choice of plankton also likely impacted the export and burial rates in
key biogeochemical parameters representing rates of trans- a significant way (Katz et al., 2004). By extending the range
formation. Both increasing coagulation (cgf ) and the use of of explored values of zrem S and zrem L or possibly including
www.geosci-model-dev.net/13/1865/2020/ Geosci. Model Dev., 13, 1865–1883, 2020You can also read