Breeding Colony Dynamics of Southern Elephant Seals at Patelnia Point, King George Island, Antarctica - MDPI
←
→
Page content transcription
If your browser does not render page correctly, please read the page content below
remote sensing
Technical Note
Breeding Colony Dynamics of Southern Elephant
Seals at Patelnia Point, King George Island, Antarctica
Katarzyna Fudala 1,2          and Robert Józef Bialik 1, *
 1    Institute of Biochemistry and Biophysics, Polish Academy of Sciences, Pawińskiego 5A,
      02-106 Warsaw, Poland; fudala.katarzyna@ibb.waw.pl
 2    Faculty of Animal Breeding, Bioengineering and Conservation, Warsaw University of Life Sciences—SGGW,
      Nowoursynowska 166, 02-787 Warsaw, Poland
 *    Correspondence: rbialik@ibb.waw.pl

 Received: 23 July 2020; Accepted: 9 September 2020; Published: 11 September 2020

 Abstract: During the 2019 breeding season (October-December), a battery-powered DIJ Inspire
 2 drone was used to investigate a breeding southern elephant seal colony located at Patelnia Point
 (ASPA 128, King George Island, South Shetland Islands, maritime Antarctica). Twelve unmanned
 aerial vehicle (UAV) missions conducted 50–70 m above ground level (AGL) were completed to
 monitor the breeding ground with a maximum of 0.348 km2 . The missions were planned in Pix4D
 Capture software. A drone, with the support of ground cameras and observations, was used to derive
 population counts, map harems, and track the phenology of the southern elephant seals. Based on
 data obtained from the UAV missions, orthophotomaps were created in PIX4D Mapper and then
 analyzed in QGIS. Calculated values of body size parameters such as body length and orthogonal
 body surface area were used to determine the age and sex of individuals. Analysis of the ranges of
 the harems on particular days, supported by an analysis of land conditions that generate physical
 barriers to the movement of animals, allowed zones in which the transformations of groups of harems
 took place to be determined. The hypothesized hermeticity of the designated zones was supported
 by statistical tests. The use of drones allows for comprehensive population analyses of the breeding
 colonies of elephant seals such as censuses of pups and adult individuals, determination of the sex
 ratio, and spatial analysis of the distribution of breeding formations. In addition, it allows for a more
 accurate result than ground counting.

 Keywords: Mirounga leonina; southern elephant seal; Antarctica; King George Island; harem structures;
 unmanned aerial vehicle (UAV); ground photogrammetry; wildlife monitoring

1. Introduction
     The southern elephant seal is the most studied pinniped species in Antarctica [1] and is divided
into four genetically distinct populations: those from South Georgia, the Valdes Peninsula, Kerguelen,
and Macquarie Island [2,3]. The first three populations are stable or increasing [4], while the last
population is decreasing [5]. Hindell et al. [4] recognized 17 subpopulations within these four
populations. The statuses of three subpopulations are unknown including that from the South
Shetland Islands.
     Southern elephant seals on the South Shetland Islands have been found breeding only on King
George Island [6], Livingston Island [7], and Nelson Island [8]. On the western shore of Admiralty
Bay (Antarctic Specially Protected Area (ASPA) No. 128, Figure 1C), counts have been performed
irregularly over the last 45 years, with the greatest continuity from 1988–2000 [9]. At Stranger Point
(ASPA No. 132, Figure 1B), censuses were conducted only between 1980 and 1988 [10] and in 1999 [11].
Further research focused mainly on the sex structure and physiology of southern elephant seals at

Remote Sens. 2020, 12, 2964; doi:10.3390/rs12182964                      www.mdpi.com/journal/remotesensing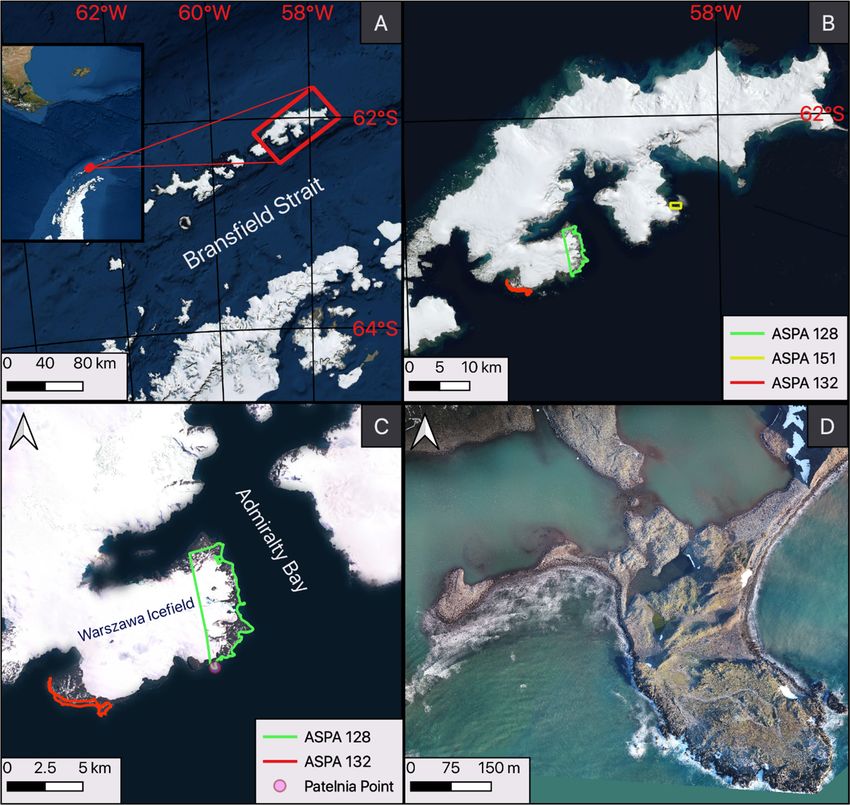
Remote Sens. 2020, 12, 2964                                                                                       2 of 18
  Remote Sens. 2020, 12, x FOR PEER REVIEW                                                                    2 of 18

   [11]. Further research focused mainly on the sex structure and physiology of southern elephant seals
Stranger Point [12–15] and in two additional areas on King George Island (ASPA Nos. 128 and 151,
   at Stranger Point [12–15] and in two additional areas on King George Island (ASPA Nos. 128 and 151,
Figure 1B), where southern elephant seals are known to occur during the breeding period.
   Figure 1B), where southern elephant seals are known to occur during the breeding period.

       Figure
     Figure 1. 1. Locationofofthe
               Location         thestudy
                                    studyareas:
                                          areas: (A)
                                                  (A) Antarctic
                                                      Antarctic Peninsula;
                                                                Peninsula;(B)
                                                                           (B)King
                                                                               KingGeorge
                                                                                    GeorgeIsland; (C)
                                                                                            Island;   western
                                                                                                    (C) western
       shore of Admiralty Bay; and (D) Patelnia Point.
     shore of Admiralty Bay; and (D) Patelnia Point.

         Importantly,
      Importantly,    sexsex ratios
                          ratios    strongly
                                 strongly      influence
                                            influence  thethe population
                                                           population       viability
                                                                        viability      of polygynous
                                                                                   of polygynous         species,
                                                                                                     species,   andand
                                                                                                                     such
   such   data may   be  used as an early  indicator  of population   decline  [16]. For  example,  the
data may be used as an early indicator of population decline [16]. For example, the lack of male southernlack  of male
   southern elephant seals on Marion Island was hypothesized to be a reason for the population decline
elephant seals on Marion Island was hypothesized to be a reason for the population decline [17].
   [17]. There are significant differences in the harem sex ratio among populations; for instance, on Sea
There are significant differences in the harem sex ratio among populations; for instance, on Sea Lion
   Lion Island, the ratio is 1♂:14♀ [18]; on Kerguelen Island, the ratio is 1♂:30♀ [19]; and at Stranger Point
Island, the ratio is 1♂:14♀ [18]; on Kerguelen Island, the ratio is 1♂:30♀ [19]; and at Stranger Point
   (ASPA No. 132), the ratio is 1♂:38♀ [10]. McMahon and Bradshaw [20] highlighted that the probability
(ASPA No. 132), the ratio is 1♂:38♀ [10]. McMahon and Bradshaw [20] highlighted that the probability
   of pup survival depends on the age of the females and their previous breeding experience. The
of pup survival depends on the age of the females and their previous breeding experience. The survival
   survival probability is also dependent on the environment in which the pups are born. The same
probability
   researchersis also  dependent
                 suggested          on theand
                              that larger     environment
                                                 more stableinharems
                                                                which the
                                                                        have pups  are born.better
                                                                               significantly    The same     researchers
                                                                                                       breeding   [20].
suggested    that  larger  and  more  stable   harems   have  significantly   better  breeding
   Since such data are lacking for the colony located at Patelnia Point, we propose improving the[20]. Since   such  data
areobservations
    lacking for the    colony  located  at Patelnia  Point, we  propose   improving      the observations
                   of southern elephant seals in that location by using select remote sensing methods, i.e., of southern
elephant
   unmanned sealsaerial
                  in thatvehicle
                           location  by using
                                  (UAV)         select
                                           flights and remote   sensing
                                                         time‐lapse       methods, which
                                                                     photography,      i.e., unmanned     aerial vehicle
                                                                                               should facilitate    the
(UAV)    flights and
   determination     oftime-lapse
                        the numberphotography,
                                     of individuals,which    should
                                                      population   agefacilitate theharem
                                                                        structure,     determination
                                                                                             density and oflocation
                                                                                                            the number
                                                                                                                     in
of association
   individuals,    population
                 with            ageparticularly
                       land cover,    structure, inharem
                                                     nearlydensity  and location
                                                             inaccessible  locations.in association with land cover,
particularly in nearly inaccessible locations.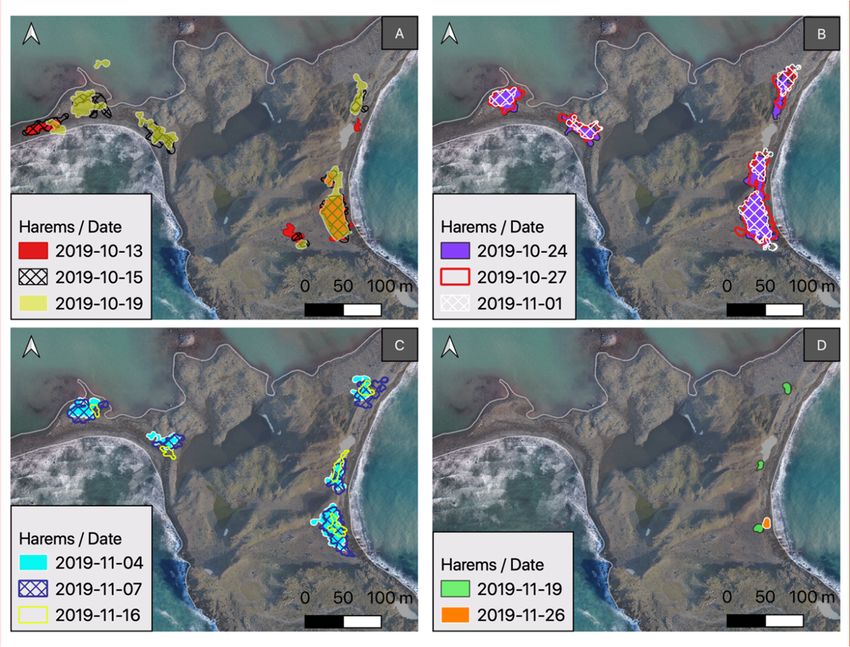
Remote Sens. 2020, 12, 2964                                                                           3 of 18

      Remote sensing methods are well-developed tools used in ecology [21,22] at both low [23] and
high [24] latitudes. In Antarctica, UAV flights have mainly been used to assess the population size
of penguins and pinnipeds [24–28]. Ground photogrammetry [29] and satellite images [30,31] have
also been successfully used in Antarctica and on sub-Antarctic islands to support regular ecological
monitoring and animal identification. Goebel et al. [28] was one of the first researchers to use
drones to estimate the size of individual leopard seals (Hydrurga leptonyx) and suggested that aerial
photogrammetry can also be used to estimate the mass of the animals. On the other hand, Adame
et al. [32] used UAVs to categorize (sex and age) California sea lions (Zalophus californianus) and
claimed that traditional, boat-based counts may underestimate abundance and influence categorization
uncertainty. Lowry [33] and Hodgson et al. [34] argued that, in contrast to ground count data, data from
manned [33] and unmanned [34] aerial images provide a permanent record. Such material may be
re-examined years after collection for error checking and re-counting of monitored individuals using
new detection methods that are likely to emerge in the future [33,34].
      In this study, the use of drones was supplemented by ground counting by observers and ground
photogrammetry. Thus, the goals were to (1) derive population counts, map harems, and track the
phenology of the southern elephant seal breeding colony at Patelnia Point, western shore of Admiralty
Bay, based on data from UAV missions; (2) propose a tool that allows more efficient measurements of
the seals’ body size via drone and, based on these measurements, estimates of the age and phenological
cycle stage of females; and (3) trace the spatial relationships between harems on consecutive days,
taking the terrain conditions into account.

2. Materials and Methods

2.1. Study Area
     King George Island (Figure 1A), which is nearly 90% covered by an icecap [35], is the largest
of the South Shetland Islands and is located approximately 125 km north of the Antarctic Peninsula.
The island is separated from the peninsula by Bransfield Strait. ASPA No. 128, which was established
to protect breeding colonies of birds and pinnipeds, is located on the western shore of Admiralty
Bay, which is in the central part of the island. The southern boundary of the area is called Patelnia
Point (58◦ 280 28”W, 62◦ 140 03”S, Figure 1D), where the southern elephant seals’ breeding colony has
been observed since 1978 [36]. Patelnia is located approximately 9 km from the Arctowski Polish
Antarctic Station along the straight line through the Warszawa Icefield (Figure 1C). However, as shown
in Figure 1D, although the location has the characteristics of a peninsula and is surrounded by the
waters of Bransfield Strait, its noticeable glaciers and weather conditions make it very difficult to access.
Notably, the first southern elephant seal bull usually appears at Patelnia Point in September, when the
waters of Admiralty Bay are covered with patches of sea ice and temperatures remain well below 0 ◦ C,
with average values of −3.9 ◦ C and −1.7 ◦ C in September and October (according to measurements
from 2013–2017), respectively [37].

2.2. Unmanned Aerial Vehicle (UAV) Flight Parameters
     Twelve missions were carried out autonomously from October 13 until December 6, 2019, using a
quadcopter Inspire 2 with a Zenmuse X5S 20.8 MP camera (DJI MFT 15 mm/1.7 ASPH lens with a
30-mm-equivalent focal length; DJI, Shenzhen, Guangdong, China). The mission path was programmed
in Pix4D Capture (Pix4D S.A., Prilly, Switzerland). The flights were at least 50 m above ground level
(AGL) and usually performed at 65 m to follow the environmental guidelines for the operation of
UAVs over mammals on land in Antarctica recommended by Mustafa et al. [38] and Harris et al. [39].
This flight height allowed images with an average of 1.38 cm pixels to be obtained and, according to
Mustafa et al. [26], provides a 100% detection rate for southern elephant seals. The largest mission area
over Patelnia was 0.348 km2 , with a total flight time of 75 min. Flight specifications, which varied due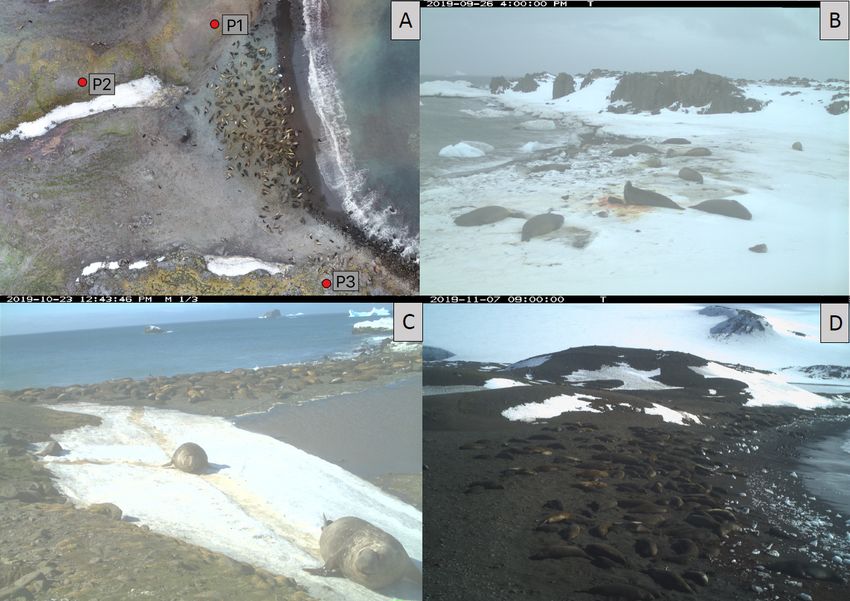
Remote Sens. 2020, 12, 2964                                                                                    4 of 18

to weather conditions, sea water tides, or ice cover of the water surface, are presented for each mission
in Table 1.

                              Table 1. Unmanned aerial vehicle (UAV) flight specifications.

                                                                                                       Ground
                                                      Number of
                                                                                                      Sampling
   Mission       Mission Date           Area           Images           Flight          Image
                                                                                                       Distance
    No.             (2019)            Coverage          Taken          Altitude        Overlap
                                                                                                     (GSD)—Pixel
                                                     (Calibrated)
                                                                                                      Resolution
       1           October 13         0.104 km2        910 (729)         50 m          85–75%           1.04 cm
       2           October 15         0.237   km2     1375 (1231)        75 m          85–75%           1.57 cm
       3           October 19         0.200 km2       1218 (984)         65 m          85–75%           1.36 cm
       4          October 24 *        0.203 km2        890 (741)         65 m          85–75%           1.39 cm
       5           October 27         0.253 km2       1217 (1074)        65 m          85–75%           1.50 cm
       6          November 1          0.181 km2       1211 (865)         65 m          85–75%           1.34 cm
       7          November 4          0.203 km2       1217 (963)         65 m          85–75%           1.32 cm
       8          November 7          0.192   km2     1261 (890)         65 m          85–75%           1.39 cm
       9         November 16          0.179   km2     1425 (863)         65 m          85–70%           1.42 cm
      10         November 19          0.224   km2     1410 (1009)        65 m          85–75%           1.39 cm
      11         November 26          0.338   km2     1399 (1184)        65 m          85–70%           1.44 cm
      12          December 6          0.348   km2     1702 (1181)        65 m          80–75%           1.37 cm
      * A Zenmuse X5S was used for the mission on that day; however, during mission planning in Pix4D Capture,
      a Zenmuse X4S was chosen, which affected image overlap and ultimately changed the ground sampling distance
      (GSD, pixel resolution).

2.3. Time-Lapse Photography and Ground Counts
     Three HP2X Hyperfire 2 cameras (Reconyx, USA) were used for continuous monitoring of the
largest harem with high-definition images. The first camera (P1, Figure 2) was mounted before the
haul-out in August 2019. Notably, the tripod was destroyed by weather conditions on October 8; a new
location was chosen for mounting this trap, and two additional locations were chosen on October
15. These cameras were active until the end of the breeding season. The locations of cameras and
example photos taken by the cameras are presented in Figure 2. The devices were installed in an area
located at a higher ground level than the breeding ground. Two different camera recording modes were
selected, namely, P1 and P3 recorded with a time-lapse interval of 0.5 h, which provided continuous
documentation of harem dynamics and registration of shoreline conditions. The P2 camera set in
motion sensor recording mode documented the area preceding the main harem. Thus, it was possible
to determine the stages important for phenological cycle chronology and the number of individuals,
especially during the harem’s initiation and formation periods. Counting based on one selected ground
camera image was performed by three independent observers. For data verification, ground counts
of individuals were made by at least two observers in the field. The ground counting performed
by independent observers was repeated until the difference between the results did not exceed 5%.
The results presented in Table 2 are the average values of these counts. Ground observations were
made on September 14 and 23; October 1, 11, 17, and 24; November 1, 16, and 26; and December 6.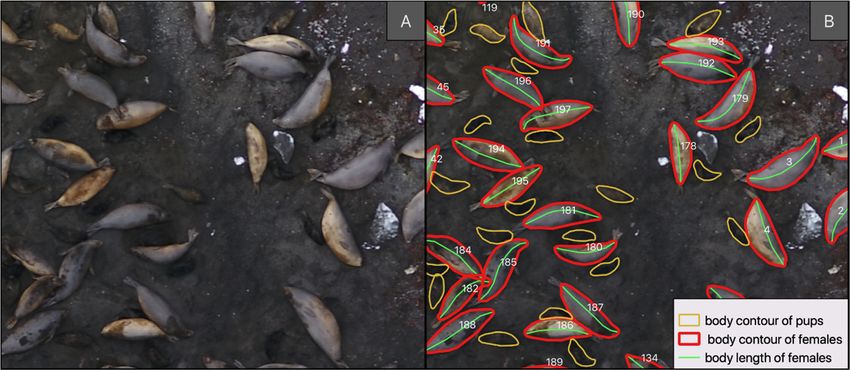
Remote Sens. 2020, 12, 2964 5 of 18
Remote Sens. 2020, 12, x FOR PEER REVIEW 5 of 18
Figure
Figure 2. 2. Locationsofofthe
Locations thecameras
camerasaround
around the
the main
main harem
haremin inthe
thestudy
studyarea
area(A);
(A);the first
the parturition
first parturition
recorded
recorded ononSeptember
September26 26 by
by camera
cameraP1P1(B); two
(B); bulls
two registered
bulls on October
registered 23 by23
on October camera P2 (C);P2
by camera and(C);
view of the entire harem on November 7 by camera P3
and view of the entire harem on November 7 by camera P3 (D).(D).
Table
Table Numbers
2. 2. Numbersofofadult
adultfemales
females(F),
(F),pups
pups (P),
(P), and males
males(M)
(M)inindifferent
differentzones.
zones.Blue
Blue represents
represents thethe
results
results from
from ground
ground counting.
counting.
Data
Data ZoneII
Zone Zone
Zone IIII Zone
ZoneIIIIII Zone
ZoneIV IV Patelnia
Patelnia
F P M F P M F P M F P M F P M
F P M F P M F P M F P M F P M
October 1 53 11 3 0 0 3 0 0 0 0 0 0 53 11 6
October 1 53 11 3 0 0 3 0 0 0 0 0 0 53 11 6
October 11 140 85 4 6 1 1 0 0 0 33 1 1 179 87 13
October
October11
15 140
202 85
153 49 6
24 41 41 250 70 20 5333 201 31 179 184
305 87 13
24
October15
October 19 259
202 182
153 96 42
24 154 44 3125 247 22 6753 920 23 400
305 260184 15 24
October 284 256 68 46 38 34 35 3124 52 6467 619 32 428 386 21
October19
24 259 182 42 15 31 400 260 15
265 166 7 49 36 4 35 31 4 57 38 2 406 271 17
284 256 8 46 38 3 35 31 5 64 61 3 428 386 21
October
% Error24 6.7 35.2 12.5 6.1 5.3 25.0 035 031 20.0 10.9 37.7 33.3 5.1
265 166 7 49 36 4 4 57 38 2 406 29.8
271 19.017
October
% Error 27 273
6.7 267
35.2 9
12.5 46
6.1 37
5.3 3
25.0 360 340 420.0 68
10.9 66 37.7 33.34 423
5.1 40529.8 2219.0
October 27 1 218
273 253
267 93 47
46 46
37 43 3536 3634 24 6168 6466 34 363
423 412405 17 22
November
216 177 4 50 38 3 36 13 1 60 50 3 362 278 11
218 253 3 47 46 4 35 36 2 61 64 3 363 412 17
% Error 1
November 0.9 30.0 25.0 6.0 17.4 25.0 2.8 63.9 50.0 1.6 21.9 0 0.3 32.5 35.3
216 177 4 50 38 3 36 13 1 60 50 3 362 278 11
November
% Error 4 180
0.9 210
30.0 8
25.0 44
6.0 47
17.4 4
25.0 36
2.8 35
63.9 3 50.0 581.6 63 21.9 20 318
0.3 41832.5 2035.3
November 7 145 199 1 42 47 6 24 32 2 45 66 5 318 411 15
November 4 180 210 8 44 47 4 36 35 3 58 63 2 318 418 20
34 118 6 15 38 7 2 101 2 3 28 2 59 395 18
November
November 716 145 199 1 42 47 6 24 32 2 45 66 5 318 411 15
34 70 5 15 12 4 2 100 3 2 26 3 53 388 15
% Error16 34
0 118
40.7 6
16.7 15
0 38
68.4 42.9 7 02 101 2 3
1.0 33.3 33.3 7.1 33.3 28 2 59 395
10.2 1.8 16.7 18
November
November 26 34
4 70
30 53 15
1 12
16 34 42 100 1 3
121 12 9726 13 1053 329388 13 15
% Error 0 40.7 16.7 0 68.4 42.9 0 1.0 33.3 33.3 7.1 33.3 10.2 1.8 16.7
December 6 0 9 6 0 13 0 0 50 7 0 51 5 0 316 28
November 26 4 30 3 1 16 3 4 121 1 1 97 1 10 329 13
December 6 0 9 6 0 13 0 0 50 7 0 51 5 0 316 28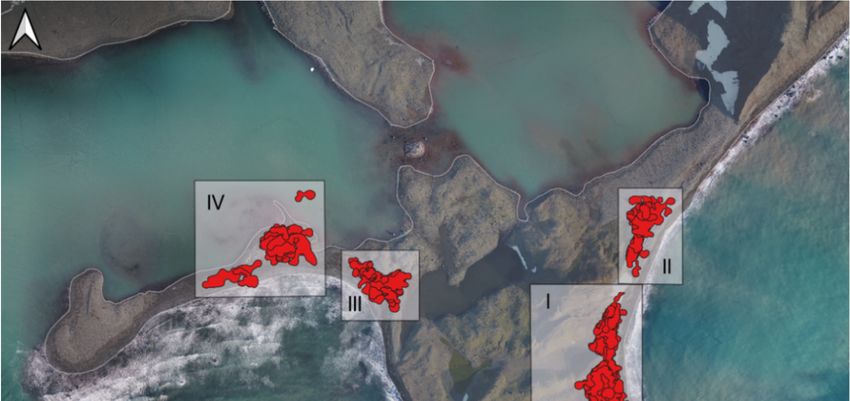
files, and then the number of individual southern elephant seals in each harem was calculated
manually using QGIS software (QGIS version 3.10.1, OSGeo). Then, for each individual on each day,
the body contour area was calculated with the QGIS Geometry function $area, and body length (from
nose tip to tail tip) was calculated with the QGIS Geometry function $length. An example of obtaining
individual parameters is presented in Figure 3. Virtual measurements of body length were performed
Remote Sens. 2020, 12, 2964 6 of 18
separately for each individual due to variation in body positioning. Eleven ground control surfaces
(GCSs, i.e., stones and boxes) with known dimensions located in different parts of Patelnia Point were
used
2.4. to determine
Image Processingtheandaccuracy
StatisticalofAnalysis
our measurements. For each day, the length and width of GCSs
were measured from the obtained orthomosaic, and then, the root mean square error (RMSE) was
Pix4D Mapper
determined, which(Pix4D S.A.,m.
was 0.012 Prilly, Switzerland) was used to prepare orthomosaics as GeoTIFF files,
and then the number of individual
To show the statistically significant southern elephantin
differences seals in surface
body each harem
area was
and calculated
body length manually
in each
using QGIS software (QGIS version 3.10.1, OSGeo). Then, for each individual
zone between the consecutive days and differences in body surface area and body length between on each day, the body
contour area was calculated with the QGIS Geometry function $area, and body
zones for different days and to compare calculation precision among the three independent observers length (from nose
tip to tail tip) was calculated with the QGIS Geometry function $length. An
as suggested by Krause et al. [40], one‐way analysis of variance (ANOVA) was performed separatelyexample of obtaining
individual parameters
for each dataset. Threeis presented
types of in Figure 3.tests,
post‐hoc Virtual measurements
namely, Tukey’s, of body length
Tamhane’s, were
and performed
Fisher’s least
separately for each individual due to variation in body positioning. Eleven
significant difference, were carried out, depending on adherence to ANOVA test assumptions. ground control surfacesTo
(GCSs, i.e.,variance
check the stones and boxes) withof
homogeneity known dimensions
the analyzed data,located in different
Levene’s test was parts
used,of Patelnia
and Point
to check were
whether
used
thesetodata
determine the accuracy
were normally of our measurements.
distributed, the Shapiro–Wilk For test
eachwasday,performed.
the length and width of aGCSs
In addition, Chi‐
were measured from the obtained orthomosaic, and then, the root mean
squared test was used to check group equality, which is required to select a post‐hoc test. square error (RMSE)
Detailswasof
determined, which was 0.012 m.
the statistical analysis are presented in Table A1 in Appendix A.
Figure3.3. Selected
Figure Selected area
areaof
of the
the main
main harem
haremon
onOctober
October24
24(A);
(A);the
thesame
samearea
areashowing
showingthe
themethod
methodused
used
forimage
for imageprocessing
processing(B).
(B).
According
To show theto the definition
statistically adopted
significant in this paper,
differences a harem
in body surfaceof area
southern elephant
and body lengthseals is a group
in each zone
of individuals
between consisting days
the consecutive of at least two females,
and differences in one
body unweaned pup,and
surface area andbody
one bull, and
length for which
between the
zones
distance
for between
different females
days and does not
to compare exceed three
calculation bodyamong
precision lengthstheofthree
the concerned
independent female, and the
observers as
distance between
suggested by Krausetheetmale and one-way
al. [40], the female group of
analysis does not exceed
variance three body
(ANOVA) lengths of separately
was performed the concerned for
male,dataset.
each unless Three
phototypes
analysis clearly tests,
of post-hoc indicates thatTukey’s,
namely, the male chases another
Tamhane’s, male from
and Fisher’s least his area of
significant
influence. To
difference, standardize
were carried out, thedepending
harem’s contouring
on adherence scheme, the following
to ANOVA rules for establishing
test assumptions. To check the an
outline were
variance adopted:ofthe
homogeneity the line constituting
analyzed the contour
data, Levene’s of an
test was individual
used, and to check reproductive
whether theseformation
data
recognized
were normallyas adistributed,
harem contains a margin allowing
the Shapiro–Wilk test wasanimals located
performed. In on the edge
addition, of the group
a Chi-squared to
test
potentially
was used to rotate 360 degrees
check group equality,around
whichthe axis of their
is required body,a where
to select post-hoc thetest.
tip Details
of the nose
of theisstatistical
the pivot
point. Objects
analysis such as in
are presented rocks
TableorA1blocks of ice, inaccessible
in Appendix A. to animals as a potential laying ground are
excluded from the
According outline
to the margin.
definition The high
adopted variability
in this paper, a and
haremdynamics of theelephant
of southern harem as a spatial
seals unit,
is a group
to individuals
of which specific individuals
consisting are assigned,
of at least two females,led one
us to designatepup,
unweaned zonesandinone which
bull, the
andindividuals
for which
the distance between females does not exceed three body lengths of the concerned female, and the
distance between the male and the female group does not exceed three body lengths of the concerned
male, unless photo analysis clearly indicates that the male chases another male from his area of
influence. To standardize the harem’s contouring scheme, the following rules for establishing an
outline were adopted: the line constituting the contour of an individual reproductive formation
recognized as a harem contains a margin allowing animals located on the edge of the group to
potentially rotate 360 degrees around the axis of their body, where the tip of the nose is the pivot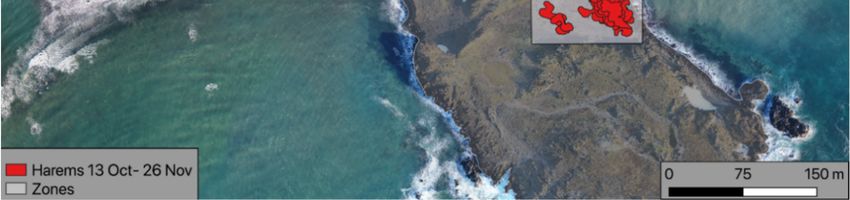
Remote Sens. 2020, 12, 2964 7 of 18
point. Objects such as rocks or blocks of ice, inaccessible to animals as a potential laying ground
are excluded from the outline margin. The high variability and dynamics of the harem as a spatial
unit, to which specific individuals are assigned, led us to designate zones in which the individuals
belonging to the land division unit were relatively invariable. After overlapping the contours of the
harems made according to the previously adopted rules based on the definition of a harem from all
days, four distinct zones with harem transformations and potential exchange of individuals were
selected. Terrain conditions (especially terrain obstacles obstructing the migration route of animals)
and field observations were considered. The zone boundary covered an area of approximately three
female body lengths (median value from our measurements) from the external outline of the harem
included in the zone. All zones were considered individually. To facilitate graphical visualization of
the designated zones they are presented as rectangles.
3. Results
According to the data from the ground cameras, the first bull appeared at the shore on September
11 and was followed by another challenger, which was recognized in a photo on September 13. The first
female came ashore on September 14, and after four days of female absence, the presence of another
female on September 18 was noted. On September 19, three females were present in the main harem,
and from that date, their number increased. The first pup was born on September 26. Until October 1,
only one harem was formed, which reached 50 females on that day.
Localizations of all harems within the area of Patelnia Point during the period from October 13
to November 26 are summarized in Figure 4. As stated in the Section 2, all harems were divided
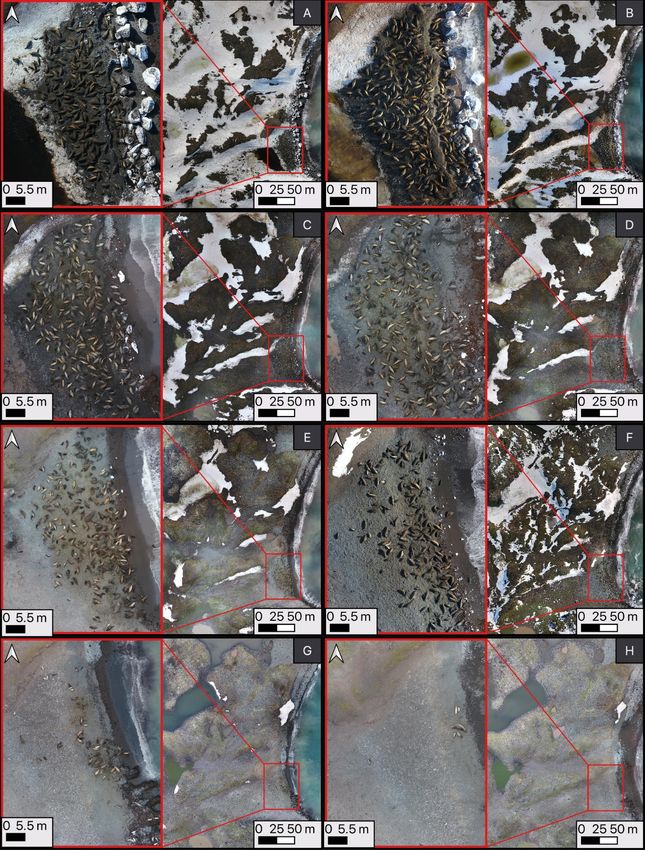
into zones (Figure 5). Figure 6 shows aerial images of the largest harem at Patelnia Point, which was
formed in Zone I. In the initial period of harem formation, the coastline was covered with blocks of
ice, which made it difficult for females to reach land. Figure 7 compares the numbers of females and
pups against the total number of individuals (females and pups) in the same period for the entire
Patelnia Point area. The percentage of females in the main harem relative to the total number in the
whole area decreased from 54% on October 15 to 40% on November 7. In contrast, the percentage of
pups decreased from 70% on October 15 to 25% on November 7. The maximum numbers of females
for the main harem and the entire area were observed on October 24, at 221 and 428 individuals,
respectively (Table 2, Figure 7). The maximum number of pups in the main harem also occurred on
October 24, at 196 individuals, while in the entire area, there were 418 individuals on November 4
(Table 2, Figure 7). In addition, we calculated the average sex ratio for the whole area, which varied
from 1♂:27♀on October 19 to 1♂:16♀on November 4.
The result of the precision test (Figure 8) revealed no significant differences in the calculation
of body length or body surface area for southern elephant seals on November 1 among the three
independent observers. Moreover, the presented results allow for clear sex distinction, as males
involved in reproduction are clearly larger than females. The results obtained for orthogonal projection
of the body surface area and the length of the females of southern elephant seals showed statistically
significant differences in body surface area in each zone between consecutive days (p-value < 0.05,
Figure 9) and statistically significant differences in body length between zones for different days
(p-value < 0.05, Figure 10). With regard to Zone I, statistically significant decreases in body surface area
were recognized between October 15 and 19, October 19 and 27, October 24 and 27, and November 1
and 4, while for Zone II, differences were observed between October 13 and 15, October 15, 19 and 27,
October 24 and November 4, and November 1 and 4. For Zone III, statistically significant decreases in
body surface area were observed between October 15 and November 1 and October 19, 24, 27 and
November 4, while for Zone IV, statistically significant decreases were observed between October 15
and 27, October 15 and November 1, and October 19 and November 4. In the case of body length,
a statistically significant difference (p-value < 0.05, Figure 10) occurred on October 13 between Zone I
and Zone II; on October 15 between Zone III and Zones I and II; on October 19 between Zone II and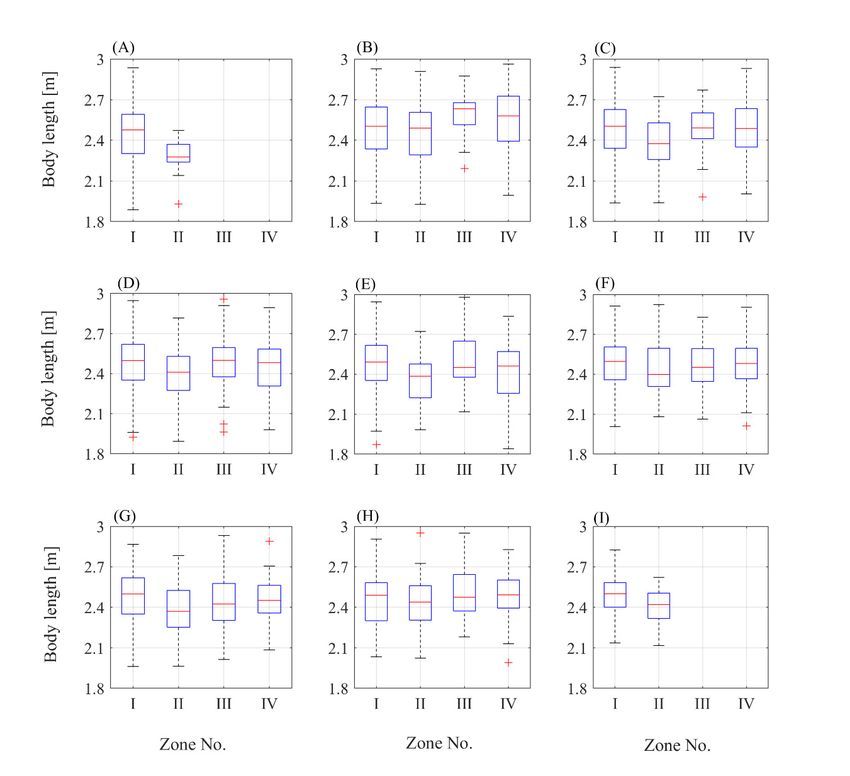
Remote Sens. 2020, 12, 2964 8 of 18
Zones I, III, IV; on October 27 between Zone II and Zones I and III; on November 4 between Zone I and
ZoneRemote
Remote Sens.
II; andSens.
on2020,
2020,12,
12,xxFOR
November FORPEER
16 REVIEW
PEER REVIEW Zone I and Zone II.
between 88 of
of 18
18
Figure 4. Localizations
Figure
Figure 4.4.Localizations
Localizationsofofallall
of harems
all haremswithin
harems within the
withinthe area
thearea
areaofofPatelnia
of Patelnia
Patelnia Point
Point
Point divided
divided
divided intointo
into fourfour
four mainmain
main periods
periods
periods
of time:
of (A) (A)
of time:
time: formation;
(A) formation;(B)(B)
formation; haul-out;
(B) haul‐out;(C)
haul‐out; (C)weaning;
(C) weaning;
weaning; andand(D)
and (D)breakup.
(D) breakup.
breakup. TheThe
The base
base
base map
map map
waswas
was obtained
obtained
obtained for for
for
November
November
November20, and
20, the
andharem
20, and the
the haremin the
harem intop
in theleft
the topcorner
top left on October
left corner
corner on
on October19 was
October 19 identified
19 was
was on sea
identified
identified on ice,
on sea which
sea ice,
ice, covered
which
which
covered
the cove the
thecove
on that
covered day.on
cove onthat
thatday.
day.
Figure
Figure 5.5.5.
Figure Division of
ofharems
Divisionof
Division haremsinto
harems intozones
into zonesat
zones Patelnia
atat
PatelniaPoint.
Point.
Patelnia Point.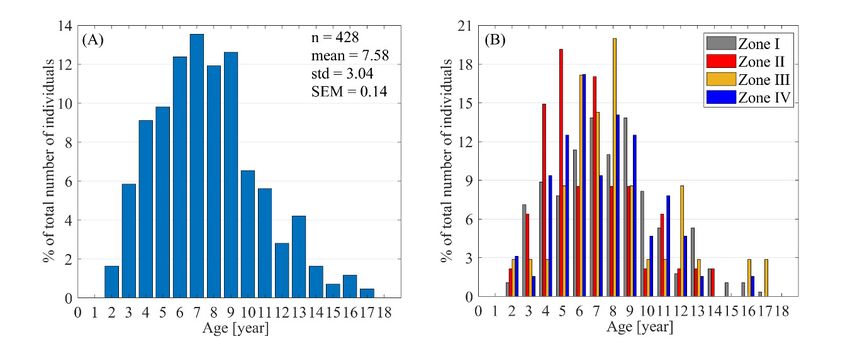
Remote Sens. 2020, 12, 2964                                                                                       9 of 18
   Remote Sens. 2020, 12, x FOR PEER REVIEW                                                                   9 of 18

         Figure
      Figure 6. 6.Aerial
                   Aerialimages
                           images of
                                  of Patelnia
                                     Patelnia Point
                                              Pointwith
                                                     withmagnification  of the
                                                            magnification      main
                                                                           of the   harem
                                                                                  main     on (A)
                                                                                        harem  onOctober 15; (B)15;
                                                                                                  (A) October
         October  19; (C)  October 24; (D) October  27; (E) November  1; (F) November  7; (G) November
      (B) October 19; (C) October 24; (D) October 27; (E) November 1; (F) November 7; (G) November      16; and16;
         (H) November
      and (H) November 26.26.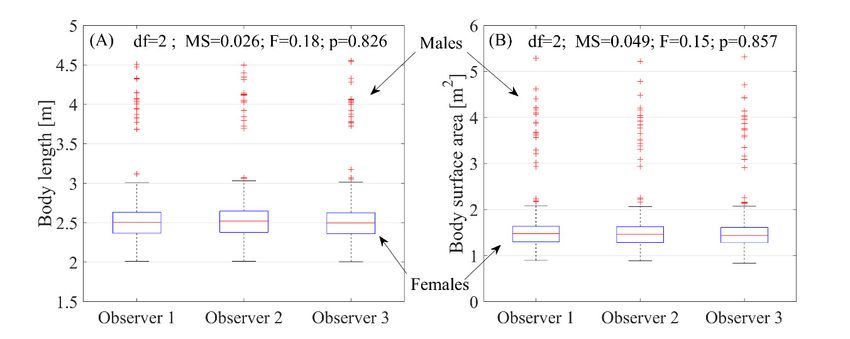
Figure 7. Number of females and pups in the entire area of Patelnia Point and in the main harem.

      The result of the precision test (Figure 8) revealed no significant differences in the calculation of
body   length or body surface area for southern elephant seals on November 1 among
    Remote Sens. 2020, 12, 2964
                                                                                                                               the three
                                                                                                                            10 of 18
independent        observers. Moreover, the presented results allow for clear sex distinction,
         Remotesensing 2020, 8, x FOR PEER REVIEW                                                                     2 of 2
                                                                                                                                as males
involved in reproduction are clearly larger than females. The results obtained for orthogonal
projection of the body surface area and the length of the females of southern elephant seals showed
statistically significant differences in body surface area in each zone between consecutive days (p‐
value < 0.05, Figure 9) and statistically significant differences in body length between zones for
different days (p‐value < 0.05, Figure 10). With regard to Zone I, statistically significant decreases in
body surface area were recognized between October 15 and 19, October 19 and 27, October 24 and
27, and November 1 and 4, while for Zone II, differences were observed between October 13 and 15,
October 15, 19 and 27, October 24 and November 4, and November 1 and 4. For Zone III, statistically
significant decreases in body surface area were observed between October 15 and November 1 and
October 19, 24, 27 and November 4, while for Zone IV, statistically significant decreases were
observed between October 15 and 27, October 15 and November 1, and October 19 and November 4.
In the case of body length, a statistically significant difference (p‐value < 0.05, Figure 10) occurred on
October 13 between Zone I and Zone II; on October 15 between Zone III and Zones I and II; on
October 19 between Zone II and Zones I, III, IV; on October 27 between Zone II and Zones I and III;
on November Figure  47.between
                 Figure Number
                         7. Number  ofZone
                                       of    I and
                                       females
                                          females andZone
                                                and  pups inII;
                                                     pups    the
                                                             theand   on
                                                                  entire
                                                                 entire    November
                                                                         area
                                                                        area ofof Patelnia
                                                                                Patelnia  16   between
                                                                                            Point
                                                                                         Point andand      Zone
                                                                                                        inmain
                                                                                                   in the the mainI harem.
                                                                                                                    and Zone II.
                                                                                                               harem.

         Reference
         1.    Fudala, K.; Bialik, R.J. Breeding Colony Dynamics of Southern Elephant Seals at Patelnia Point, King
               George Island, Antarctica. Remote Sens. 2020, 12, 2964.

         Publisher’s Note: MDPI stays neutral with regard to jurisdictional claims in published maps and institutional
         affiliations.

                               © 2020 by the authors. Submitted for possible open access publication under the terms
                               and conditions of the Creative Commons Attribution (CC BY) license
                               (http://creativecommons.org/licenses/by/4.0/).

          Figure 8. Observer precision in measurements of body length (A) and body surface area (B). The test
      Figure 8. Observer precision in measurements of body length (A) and body surface area (B). The test
         was carried out for November 1.
      was carried out for November 1.
Remote Sens. 2020, 12, x FOR PEER REVIEW 11 of 18
Remote Sens. 2020, 12, 2964 11 of 18
Figure 9. Average body surface area with one standard deviation (whisker) for Zone I (A); Zone II (B);
Zone III (C); and Zone IV (D).
Figure 9. Average body surface area with one standard deviation (whisker) for Zone I (A); Zone II
(B); Zone III (C); and Zone IV (D).Remote Sens. 2020, 12, x FOR PEER REVIEW 12 of 18
Remote Sens. 2020, 12, 2964 12 of 18
Figure 10. Body length of females on different days: (A) October 13; (B) October 15; (C) October 19;
Figure 10. Body
(D) October length
24; (E) of 27;
October females on different
(F) November days: (A) 4;
1; (G) November October 13; (B)7;October
(H) November 15; (C) October
and (I) November 16. 19;
(D) October 24; (E) October 27; (F) November 1; (G) November 4; (H) November 7; and (I) November
The line in the middle of the box indicates the median, the box edges represent the first and third
16.quantiles,
The linethe in whiskers correspond
the middle to the
of the box minimumthe
indicates andmedian,
maximum thevalues, and crosses
box edges represent
represent the outliers.
first and third
quantiles, the whiskers correspond to the minimum and maximum values, and crosses represent
Finally, an additional advantage of obtaining such observations and measurements of female
outliers.
southern elephant seals using drones is the ability to assess their age. Several expressions are available
in the literature that combine the length and age of females [41]. However, based on one of the simplest,
Finally, an additional advantage of obtaining such observations and measurements of female
BL = 1.67*age0.20 , we can determine the relationship between body length (BL) and age. Figure 11
southern
shows the elephant seals using
age distribution drones
of females is the ability
at Patelnia to assess
Point (Figure theirtheage.
11A) and Several
division expressions
of the number are
available in the literature
of individuals into zones that
based combine the length
on age (Figure 11B).and
Onagethisof females
basis, [41]. However,
we concluded that thebased on one of
average
theage
simplest, BL = 1.67*age 0.20, we can determine the relationship between body length (BL) and age.
of females for October 27 was 7.58 ± 3.04 years. Unfortunately, the other available models have
Figure 11 shows
asymptotic the agefor
limitations; distribution
example, when of females
using BL at=Patelnia Point (Figure 11A)
2.57exp(−exp(−0.65(age + 0.23)))
and[41],
the division
the ages of the
number of individuals
of females whose lengths into zones
exceed 2.57based on age
m cannot (Figure 11B).
be determined. On this basis,
Nevertheless, therewe concluded
is still significantthat the
potential
average ageinof such estimation
females methods.
for October 27 was 7.58 ± 3.04 years. Unfortunately, the other available models
have asymptotic limitations; for example, when using BL = 2.57exp(‐exp(−0.65(age + 0.23))) [41], the
ages of females whose lengths exceed 2.57 m cannot be determined. Nevertheless, there is still
significant potential in such estimation methods.Remote Sens. 2020, 12, 2964 13 of 18
Remote Sens. 2020, 12, x FOR PEER REVIEW 13 of 18
Figure 11. Age
Figure11. Age distribution
distributionof of females
females at at Patelnia
PatelniaPoint
Pointcalculated
calculatedbased
basedon
onthe
thepower
powermodelmodelof
offemale
female
body
bodylength
length and
and age: BL BL ==1.67*age
1.67*age 0.20 for October 27 (A), where BL stands for female body length,
0.20 for October 27 (A), where BL stands for female body length, and
and normalized
normalized classclass categorization
categorization of female
of female age age based
based on the
on the power
power model
model for four
for all all four zones
zones (B).(B).
4. Discussion
4. Discussion
The utility of drones in monitoring animal populations has been repeatedly confirmed, and our
The utility of drones in monitoring animal populations has been repeatedly confirmed, and our
analysis shows that when counting southern elephant seals, as in other recently investigated
analysis shows that when counting southern elephant seals, as in other recently investigated species
species [34,42,43], the use of UAVs was more accurate than ground counting by humans. However,
[34,42,43], the use of UAVs was more accurate than ground counting by humans. However, the sizes
the sizes and locations of harems can be very highly dynamic, suggesting that counting them at 10-day
and locations of harems can be very highly dynamic, suggesting that counting them at 10‐day
intervals, as in the previous seasons [9], may not provide a complete view, potentially leading to a loss
intervals, as in the previous seasons [9], may not provide a complete view, potentially leading to a
of information about the maximum number of individuals.
loss of information about the maximum number of individuals.
A different temporal distribution of the phenological cycle was noticeable in the main (I) zone
A different temporal distribution of the phenological cycle was noticeable in the main (I) zone
compared with the other three zones. In the main zone, where the largest harem occurred and in which
compared with the other three zones. In the main zone, where the largest harem occurred and in
the number of females was approximately 50% of the total number of females in the analyzed area,
which the number of females was approximately 50% of the total number of females in the analyzed
the first parturition took place on September 26, while the maximum number of females assessed based
area, the first parturition took place on September 26, while the maximum number of females
on photos from the mission occurred on October 24. The maximum occurred on October 27 in Zones III
assessed based on photos from the mission occurred on October 24. The maximum occurred on
and IV and on November 1 in Zone II. When considering the entire area of observation, the maximum
October 27 in Zones III and IV and on November 1 in Zone II. When considering the entire area of
occurred on October 24, consistent with the results published by Muller-Schwarze et al. [44] (October 24),
observation, the maximum occurred on October 24, consistent with the results published by Muller‐
Galimberti and Sanvito [45] (October 25), and Carlini et al. [11], who suggested that the haul-out peak
Schwarze et al. [44] (October 24), Galimberti and Sanvito [45] (October 25), and Carlini et al. [11], who
for King George Island was on October 28.
suggested that the haul‐out peak for King George Island was on October 28.
To
Totrace
tracethe thespatial
spatialrelationships
relationshipsbetween
betweenharems
haremson onconsecutive
consecutivedays, days,taking
takinginto
intoaccount
accountthe the
terrain conditions, the area of Patelnia Point was divided into zones. Female
terrain conditions, the area of Patelnia Point was divided into zones. Female southern elephant seals southern elephant seals
differed
differedsignificantly
significantlyinin body
bodylength
length between
betweenthese zones
these on particular
zones on particulardays.days.
ZoneZoneI differed from Zone
I differed from
IIZone
on October 13, 19, and 27 and November 4 and 16. ANOVA confirmed
II on October 13, 19, and 27 and November 4 and 16. ANOVA confirmed the differences the differences between Zone II
and Zone Zone
between III on October
II and Zone 15, 19,
IIIand 27. In contrast,
on October 15, 19, weanddid27.not
In detect statistically
contrast, we did not significant differences
detect statistically
in female body
significant length among
differences in femaleconsecutive
body length daysamong
in particular
consecutive zones,days
which suggests no
in particular significant
zones, which
exchange of individuals between zones. The analysis of glacier ranges
suggests no significant exchange of individuals between zones. The analysis of glacier ranges from 1978/1979 [46,47] clearly
from
shows that in this period, Zones II, III, and IV were covered with ice from
1978/1979 [46,47] clearly shows that in this period, Zones II, III, and IV were covered with ice fromthe Windy Glacier; therefore,
there was noGlacier;
the Windy possibility of harem
therefore, formation
there was noin this or preceding
possibility of haremyears. This excludes
formation in this orsimple philopatry
preceding years.
(i.e., an elephant seal’s experience and potential return to places where harems
This excludes simple philopatry (i.e., an elephant seal’s experience and potential return to places were found in previous
years)
whereas a possible
harems were explanation for theyears)
found in previous difference. The periods
as a possible explanationof deglaciation (exposure
for the difference. The from ice)
periods
for Zones II, III, and IV were similar. These zones were partially uncovered
of deglaciation (exposure from ice) for Zones II, III, and IV were similar. These zones were partially in 1989 and completely
uncovered
uncoveredin in2001
1989[46,47].
and completely uncovered in 2001 [46,47].
Our
Ourresults
resultsalso alsorevealed
revealedclear
clear(statistically
(statistically significant)
significant) differences
differences in infemale
femalebodybodysurface
surface area
area
between
between consecutive days in different zones. The most common noticeable difference wasbetween
consecutive days in different zones. The most common noticeable difference was between
October
October 19 19 and
and 27, 27, which
which waswas observed
observed for for three
three zones
zones (I,
(I, II,
II, and
and IV),
IV), and
and between
between October
October 19,19, 24,
24,
and 27 and November 4 (Zones I, II, and III). Later, there were no statistically
and 27 and November 4 (Zones I, II, and III). Later, there were no statistically significant differences. significant differences.
Our observations suggest that this parameter is associated with a reduction in female body surface
area due to subsequent parturition and lactation. According to Carlini et al. [13], females on KingRemote Sens. 2020, 12, 2964 14 of 18
Our observations suggest that this parameter is associated with a reduction in female body surface
area due to subsequent parturition and lactation. According to Carlini et al. [13], females on King
George Island stay in the breeding ground from parturition to departure at 22 days, and during
this time, they lose approximately 221 +/−37 kg of body weight, which is 35% of their body mass
at the beginning of lactation. Thus, the first parturition took place on September 26 in the study
area. Based on Carlini’s [13] results, this suggests that the first females left the harem on October 18,
assuming that their young survived. This was confirmed by our results, which suggest that between
October 19 and 27, most females were in the period of body mass reduction due to lactation. On the
other hand, the peak number of pups was observed on November 4, suggesting that the majority
of females had already given birth, and in the following days, they returned to sea without being
included in the statistics. On this basis, it can be deduced that females with a smaller body surface area
do not lead to underestimation in the statistical analyses. Moreover, a significant increase is visible,
for example, for Zone II between November 4 and 7. We believe that monitoring the body surface area
of female individuals allows us to assess the degree of development for particular zones, and this type
of monitoring should be conducted in future studies. It should be emphasized, however, that the first
UAV mission, based on which we were able to calculate the length and body surface area of females,
occurred approximately 10 days later than the beginning of harem formation, if we consider at least
Zones III and IV. Therefore, the monitoring may not have been sufficient to completely meet the goals
posed in the current paper, leaving an open question in this area.
5. Conclusions
The following statements summarize our findings:
1. This paper confirmed that counting southern elephant seals using UAVs is more accurate than
counting by humans, and it is therefore strongly recommended that drones be used to monitor
breeding colonies of southern elephant seals.
2. The body surface area of southern elephant seals can be used to assess the development of a
particular zone, as it is associated with body mass lost due to parturition and latency in females.
3. Harems are highly dynamic and unstable groups (in the sense of spatial changes and individuals
movement), so the situation considered here is temporary. To better understand reproductive
dynamics, all interactions between existing harems and their transformations should also be
taken into account. For this reason, it is better to consider the belonging of an individual to a
certain hermetic area (zone) than to a specific harem. Zones provide an opportunity to determine
the phase of the phenological cycle.
4. Based on body length measurements of female southern elephant seals, we suggest assessing
the age of such females using the well-known power equation that links body length and age.
Our calculations showed that the mean age of females involved in breeding at Patelnia was
7.58 years with a standard deviation equal to 3.04 years.
Author Contributions: Conceptualization, K.F. and R.J.B.; methodology, K.F. and R.J.B.; investigation, K.F. and
R.J.B.; data curation, K.F. and R.J.B.; writing, K.F. and R.J.B.; resources, K.F.; project administration, R.J.B.;
All authors have read and agreed to the published version of the manuscript.
Funding: This research received funding from the Ministry of Science and Higher Education of Poland, grant no.
6812/IA/SP/2018.
Acknowledgments: We appreciate the support provided by the Arctowski Polish Antarctic Station. We are
particularly grateful to Arctowski Station staff for their help in collecting data. Special thanks are due to Pix4D
S.A. as most of the images were analyzed with the support of Pix4DMapper (Professor License). Lastly, we would
like to thank four anonymous reviewers for their helpful comments.
Conflicts of Interest: The authors declare no conflict of interest.Remote Sens. 2020, 12, 2964 15 of 18
Appendix A
Table A1. Details of the statistical analysis.
Investigated ANOVA
Factor Levene’s Test Post-Hoc Test
Characteristics df F p
Body Length 8 0.941 0.481 0.178 none
Zone I
Body Surf. 8 9.778 0.000 0.083 Tukey’s
Body Length 8 1.725 0.092 0.340 none
Zone II
Body Surf. 8 3.403 0.001 0.268 Tukey’s
Body Length 6 1.735 0.114 0.935 none
Zone III
Body Surf. 6 7.198 0.000 0.991 Tukey’s
Body Length 6 2.339 0.031 0.093 Tukey’s
Zone IV
Body Surf. 6 5.673 0.000 0.010 Tamhane’s
Body Length 1 7.117 0.008 0.059 LSD
October 13
Body Surf. 1 5.258 0.023 0.628 LSD
Body Length 3 3.007 0.031 0.317 LSD
October 15
Body Surf. 3 1.543 0.203 0.375 none
Body Length 3 3.053 0.028 0.404 LSD
October 19
Body Surf. 3 0.730 0.534 0.493 none
Body Length 3 1.887 0.131 0.841 none
October 24
Body Surf. 3 0.488 0.691 0.332 none
Body Length 3 5.981 0.001 0.646 LSD
October 27
Body Surf. 3 3.767 0.011 0.291 LSD
Body Length 3 0.391 0.760 0.853 none
November 1
Body Surf. 3 0.790 0.500 0.670 none
Body Length 3 2.978 0.032 0.297 LSD
November 4
Body Surf. 3 1.141 0.333 0.229 none
Body Length 3 1.142 0.333 0.591 none
November 7
Body Surf. 3 0.154 0.927 0.043 none
Body Length 3 5.131 0.004 0.007 Tamhane’s
November 16
Body Surf. 3 3.326 0.027 0.308 LSD
Body Length 3 2.335 0.099 0.266 none
November 26
Body Surf. 3 1.943 0.150 0.863 none
References
1. Rogers, A.D.; Frinault, B.A.V.; Barnes, D.K.A.; Bindoff, N.L.; Downie, R.; Ducklow, H.W.; Friedlaender, A.S.;
Hart, T.; Hill, S.L.; Hofmann, E.E.; et al. Antarctic Futures: An Assessment of Climate-Driven Changes in
Ecosystem Structure, Function, and Service Provisioning in the Southern Ocean. Annu. Rev. Mar. Sci. 2020,
12, 87–120. [CrossRef] [PubMed]
2. Slade, R.W.; Moritz, C.; Hoelzel, A.R.; Burton, H.R. Molecular population genetics of the southern elephant
seal Mirounga leonina. Genetics 1998, 149, 1945–1957. [PubMed]
3. Corrigan, L.J.; Fabiani, A.; Chauke, L.F.; McMahon, C.R.; De Bruyn, M.; Bester, M.N.; Bastos, A.D.S.;
Campagna, C.; Muelbert, M.M.; Hoelzel, A.R. Population differentiation in the context of Holocene climate
change for a migratory marine species, the southern elephant seal. J. Evol. Biol. 2016, 29, 1667–1679.
[CrossRef] [PubMed]
4. Hindell, M.A.; McMahon, C.R.; Bester, M.N.; Boehme, L.; Costa, D.; Fedak, M.A.; Guinet, C.;
Herraiz-Borreguero, L.; Harcourt, R.; Hückstädt, L.A.; et al. Circumpolar habitat use in the southern
elephant seal: Implications for foraging success and population trajectories. Ecosphere 2016, 7, 01213.
[CrossRef]Remote Sens. 2020, 12, 2964 16 of 18
5. McMahon, C.R.; Bester, M.N.; Burton, H.R.; Hindell, M.A.; Bradshaw, C.J. Population status, trends and a
re-examination of the hypotheses explaining the recent declines of the southern elephant seal Mirounga
leonina. Mammal Rev. 2005, 35, 82–100. [CrossRef]
6. Aguayo, A.L. Census of pinnipedia in the South Shetland Islands. In Antarctic Ecology; Holdgate, M.W., Ed.;
Academic Press: London, UK, 1970; pp. 395–397.
7. Gil-Delgado, J.A.; Villaescusa, J.A.; Diazmacip, M.E.; Velázquez, D.; Rico, E.; Toro, M.; Quesada, A.;
Camacho, A. Minimum population size estimates demonstrate an increase in southern elephant seals
(Mirounga leonina) on Livingston Island, maritime Antarctica. Polar Biol. 2012, 36, 607–610. [CrossRef]
8. Carlini, A.R.; Poljak, S.; Casaux, R.; Daneri, G.A.; Gasco, M. Southern elephant seals breeding at Nelson
Island, South Shetland Islands. Pol. Polar Res. 2003, 24, 143–147.
9. Salwicka, K.; Rakusa-Suszczewski, S. Long-term monitoring of Antarctic pinnipeds in Admiralty Bay (South
Shetlands, Antarctica). Acta Thériol. 2002, 47, 443–457. [CrossRef]
10. Vergani, D.F.; Stanganelli, Z.B. Fluctuations in Breeding Populations of Elephant Seals Mirounga leonina
at Stranger Point, King George Island 1980–1988. In Antarctic Ecosystems; Kerry, K.R., Hempel, G., Eds.;
Springer: Berlin/Heidelberg, Germany, 1990.
11. Carlini, A.R.; Polijak, S.; Daneri, G.A.; Márquez, M.E.I.; Plötz, J. Dynamics of male dominate of southern
elephant seals (Mirounga leonine) during breeding season at King George Island. Pol. Polar Res. 2002,
23, 153–159.
12. Carlini, A.R.; Márquez, M.E.I.; Soave, G.; Vergani, D.F.; De Ferrer, P.A.R. Southern elephant seal, Mirounga
leonina: Composition of milk during lactation. Polar Biol. 1994, 14, 37–42. [CrossRef]
13. Carlini, A.R.; Daneri, G.A.; Márquez, M.E.I.; Soave, G.E.; Poljak, S. Mass transfer from mothers to pups and
mass recovery by mothers during the post-breeding foraging period in southern elephant seals (Mirounga
leonina) at King George Island. Polar Biol. 1997, 18, 305–310. [CrossRef]
14. Daneri, G.; Carlini, A. Fish prey of southern elephant seals, Mirounga leonina, at King George Island.
Polar Biol. 2002, 25, 739–743. [CrossRef]
15. Daneri, G.A.; Carlini, A.R.; Marschoff, E.R.; Harrington, A.; Negrete, J.; Mennucci, J.A.; Márquez, M.E.I.
The feeding habits of the Southern elephant seal, Mirounga leonina, at Isla 25 de Mayo/King George Island,
South Shetland Islands. Polar Biol. 2014, 38, 665–676. [CrossRef]
16. Gerber, L.R. Including behavioral data in demographic models improves estimates of population viability.
Front. Ecol. Environ. 2006, 4, 419–427. [CrossRef]
17. Skinner, J.D.; Van Aarde, R.J. Observations on the Trend of the Breeding Population of Southern Elephant
Seals, Mirounga leonina, at Marion Island. J. Appl. Ecol. 1983, 20, 707. [CrossRef]
18. Galimberti, F.; Boitani, L. Demography and breeding biology of a small localized population of Southern
elephant seals (Mirounga leonina). Mar. Mammal Sci. 1999, 15, 159–178. [CrossRef]
19. Van Aarde, R.J. Harem structure of the southern elephant seal Mirounga leonina at Kerguelen Island.
Revue d’Ecologie 1980, 34, 41–44.
20. McMahon, C.R.; Bradshaw, C.J. Harem choice and breeding experience of female southern elephant seals
influence offspring survival. Behav. Ecol. Sociobiol. 2004, 55, 349–362. [CrossRef]
21. Anderson, K.; Gaston, K.J. Lightweight unmanned aerial vehicles will revolutionize spatial ecology.
Front. Ecol. Environ. 2013, 11, 138–146. [CrossRef]
22. Pettorelli, N.; Nagendra, H.; Rocchini, D.; Rowcliffe, M.; Williams, R.; Ahumada, J.; De Angelo, C.;
Atzberger, C.; Boyd, D.S.; Buchanan, G.; et al. Remote Sensing in Ecology and Conservation: Three years on.
Remote. Sens. Ecol. Conserv. 2017, 3, 53–56. [CrossRef]
23. Vermeulen, C.; Lejeune, P.; Lisein, J.; Sawadogo, P.; Bouché, P. Unmanned Aerial Survey of Elephants.
PLoS ONE 2013, 8, e54700. [CrossRef] [PubMed]
24. Zmarz, A.; Rodzewicz, M.; Dabski,
˛ M.; Karsznia, I.; Korczak-Abshire, M.; Chwedorzewska, K.J. Application
of UAV BLOS remote sensing data for multi-faceted analysis of Antarctic ecosystem. Remote Sens. Environ.
2018, 217, 375–388. [CrossRef]Remote Sens. 2020, 12, 2964 17 of 18
25. Korczak-Abshire, M.; Zmarz, A.; Rodzewicz, M.; Kycko, M.; Karsznia, I.; Chwedorzewska, K.J. Study of
fauna population changes on Penquin Island and Turret Point oasis (King George Island, Antarctica) using
an unmanned aerial vehicle. Polar Biol. 2019, 42, 217–224. [CrossRef]
26. Mustafa, O.; Braun, C.; Esefeld, J.; Knetsch, S.; Maercker, J.; Pfeifer, C.; Rummler, M.C. Detecting Antarctic
seals and flying seabirds by UAV. ISPRS Ann. Photogramm. Remote. Sens. Spat. Inf. Sci. 2019, 141–148.
[CrossRef]
27. Pfeifer, C.; Barbosa, A.; Mustafa, O.; Peter, H.U.; Brenning, A.; Rummler, M.C. Using fixed wing UAV
for Detecting and mapping the distribution and abundance of penquins on the South Shetlands Islands.
Antarctica. Drones 2019, 3, 39. [CrossRef]
28. Goebel, M.E.; Perryman, W.L.; Hinke, J.T.; Krause, D.J.; Hann, N.A.; Gardner, S.; Leroi, D.J. A small
unmanned aerial system for estimating abundance and size of Antarctic predators. Polar Biol. 2015, 38,
619–630. [CrossRef]
29. Hinke, J.T.; Barbosa, A.; Emmerson, L.; Hart, T.; Juáres, M.A.; Korczak-Abshire, M.; Milinevsky, G.; Santos, M.;
Trathan, P.N.; Watters, G.M.; et al. Estimating nest-level phenology and reproductive success of colonial
seabirds using time-lapse cameras. Methods Ecol. Evol. 2018, 9, 1853–1863. [CrossRef]
30. McMahon, C.R.; Howe, H.; Hoff, J.V.D.; Alderman, R.; Brolsma, H.; Hindell, M.A. Satellites, the All-Seeing
Eyes in the Sky: Counting Elephant Seals from Space. PLoS ONE 2014, 9, e92613. [CrossRef]
31. LaRue, M.; Ainley, D.G.; Pennycook, J.; Stamatiou, K.; Salas, L.; Nur, N.; Stammerjohn, S.; Barrington, L.
Engaging ‘the crowd’ in remote sensing to learn about habitat affinity of the Weddell seal in Antarctica.
Remote. Sens. Ecol. Conserv. 2019, 6, 70–78. [CrossRef]
32. Adame, K.; Pardo, M.A.; Salvadeo, C.; Beier, E.; Elorriaga-Verplancken, F.R. Detectability and categorization
of California sea lions using an unmanned aerial vehicle. Mar. Mammal Sci. 2017, 33, 913–925. [CrossRef]
33. Lowry, M.S. Count of California sea lion (Zalophus californianus) pups from aerial color photographs and
from the ground: A comparison of two methods. Mar. Mammal Sci. 1999, 15, 143–158. [CrossRef]
34. Hodgson, J.C.; Mott, R.; Baylis, S.; Pham, T.; Wotherspoon, S.; Kilpatrick, A.D.; Segaran, R.R.; Reid, I.;
Terauds, A.; Koh, L.P. Drones count wildlife more accurately and precisely than humans. Methods Ecol. Evol.
2018, 9, 1160–1167. [CrossRef]
35. Blindow, N.; Suckro, S.; Rückamp, M.; Braun, M.; Schindler, M.; Breuer, B.; Saurer, H.; Simões, J.C.; Lange, M.
Geometry and status of the King George Island ice cap (South Shetland Islands, Antarctica). Ann. Glaciol.
2010, 51, 103–109. [CrossRef]
36. Krzemiński, W. Southern elephant seal (Mirounga leonina L.) of Admiralty Bay (King George Islands). Its
numbers and activity during the moulting season in summer 1978/1979. Pol. Polar Res. 1981, 2, 143–152.
37. Plenzler, J.; Budzik, T.; Puczko, D.; Bialik, R.J. Climatic conditions at Arctowski Station (King George Island,
West Antarctica) in 2013–2017 against the background of regional changes. Pol. Polar Res. 2019, 40, 1–27.
38. Mustafa, O.; Barbosa, A.; Krause, D.J.; Peter, H.-U.; Vieira, G.; Rümmler, M.-C. State of knowledge: Antarctic
wildlife response to unmanned aerial systems. Polar Biol. 2018, 41, 2387–2398. [CrossRef]
39. Harris, C.M.; Herata, H.; Hertel, F. Environmental guidelines for operation of Remotely Piloted Aircraft
Systems (RPAS): Experience from Antarctica. Biol. Conserv. 2019, 236, 521–531. [CrossRef]
40. Krause, D.J.; Hinke, J.T.; Perryman, W.L.; Goebel, M.E.; Leroi, D.J. An accurate and adaptable photogrammetric
approach for estimating the mass and body condition of pinnipeds using an unmanned aerial system.
PLoS ONE 2017, 12, e0187465. [CrossRef]
41. Bell, C.M.; Burton, H.R.; Lea, M.-A.; Hindell, M.A. Growth of female southern elephant seals Mirounga
leonina at Macquarie Island. Polar Biol. 2005, 28, 395–401. [CrossRef]
42. Hodgson, J.C.; Baylis, S.; Mott, R.; Herrod, A.; Clarke, R.H. Precision wildlife monitoring using unmanned
aerial vehicles. Sci. Rep. 2016, 6, 22574. [CrossRef]
43. Sorrell, K.; Clarke, R.H.; Holmberg, R.; McIntosh, R.R. Remotely piloted aircraft improve precision of
capture–mark–resight population estimates of Australian fur seals. Ecosphere 2019, 10, 02812. [CrossRef]
44. Muller-Schwarze, D.; Waltz, E.C.; Trivelpiece, W.; Volkman, N.J. Breeding status of southern elephant seals at
King George Island. Antarct. J. U. S. 1978, 13, 157–158.
45. Galimberti, F.; Sanvito, S. Modeling female haul-out in southern elephant seals (Mirounga leonina).
Aquat. Mamm. 2001, 27, 92–104.You can also read