Briefing on Solvency II - London, 30 November 2015 - Munich Re
←
→
Page content transcription
If your browser does not render page correctly, please read the page content below

plainpicture/fStop/Ralf Hiemisch
Briefing on Solvency II

London, 30 November 2015

                           Solvency II – Analysts’ briefing   1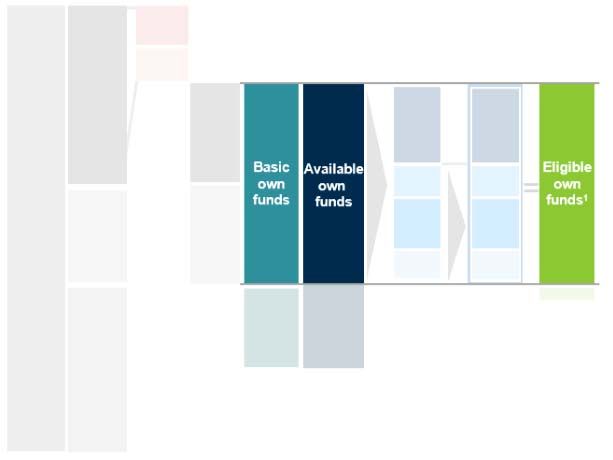
Agenda

Overview and implementation                                                                      2

Impact on Munich Re
Solvency II balance sheet and own funds                                                         11
Solvency capital requirement                                                                    26
Solvency II capitalisation ratio and target capitalisation                                      33

Impact on the insurance industry                                                                39

                                                             Solvency II – Analysts’ briefing        2
Overview and implementation
Munich Re well prepared for the introduction of
Solvency II and business opportunities it presents
Solvency II framework
Risk-based supervision Certified full internal model deeply embedded in
risk and business management – Full Group
internal model approved without terms & conditions
Insurers’ business models are
adequately reflected
Focus on profitable underwriting and liability-driven
investments – well diversified risk profile clearly
recognised
Changing capital requirements
through final calibration
Capitalisation remains very strong –
SII ratio (end of 2014) has even increased
High degree of transparency Extensive reporting to the regulator, the capital
markets and the public
Uniform regulatory framework enhances
comparability across the industry
Active participation in efforts to harmonise
Solvency II terminology
Business opportunities for reinsurers,
driver of product innovation
Market-leader position in structuring complex tailor-
made solutions
Munich Re welcomes Solvency II standards for risk-based capitalisation
Solvency II – Analysts’ briefing 3Overview and implementation – Current status of Solvency II
The road to Solvency II on the final straight
Solvency II regime becomes fully applicable on 1 January 2016
Preparatory phase 2014–2015 successfully concluded
Level 1, 2 and 3 documents finalised and mainly approved
Currently being transposed into national law
Further regulatory requirements (ComFrame, HLA, ICS) being prepared
Issues outstanding/under discussion Review
National interpretations (e.g. audit review of Review of ultimate forward rate in 2016
solvency position) Review of standard formula by 2018
Equivalence not yet decided for several countries Annual review of long-term-guarantee measures
Application and approval of dynamic volatility
adjustment in internal models
New regulatory framework implemented – ongoing developments not expected
to significantly affect Munich Re’s Solvency II capitalisation ratio
Solvency II – Analysts’ briefing 4Overview and implementation – Status of Solvency II implementation at Munich Re
Holistic, principle-based approach of Solvency II
has been followed by Munich Re
1 Quantitative requirements 2 Qualitative requirements 3 Disclosure
Group internal model Risk management deeply Reporting to the public
successfully used since 2002 rooted in Munich Re Risk report (included
Model reflects diversified Key functions implemented in Annual Report)
business model of global Internal policies finalised Solvency II reporting
reinsurance – standard ORSA1 embedded in business as from 2017:
formula primarily developed planning process since 2012 Solvency & Financial
for primary insurance Condition Report
Strong operational and
Full internal model includes security & continuity Quantitative Reporting
operational risk management (e.g. Internal Templates (QRTs)
Improved Solvency II Control System) Reporting to the regulator
capitalisation ratio underlines
prudent model calibration Regular Supervisory
Report/Internal Risk Report
Additional QRTs
(quarterly/annual)
ORSA Report
Three pillars of Solvency II deeply entrenched in Munich Re’s management approach
1 ORSA: Own risk and solvency assessment. Solvency II – Analysts’ briefing 5Overview and implementation – Internal model application process
Approval process started well after model results were
used in relevant management processes at Munich Re
2009 2010 2011 2012 2013 2014 2015
Approval of Internal model “Trial” application Official application Full Group
New Re‘s recognised by submitted to submitted to BaFin internal model
internal model S&P via BaFin 2 in May 2015 approved
by FINMA1 in M-Factor without
Switzerland terms &
conditions
Pre-application process
Review of all individual risk categories / on-site visits by regulators /
written feedback including follow-up
Preparation of application package
Full package consisting of
approximately 15,000 pages
Informal model change phase
No further BaFin review for
models already fulfilling all
requirements
Extensive review of internal model by BaFin and other European regulators
ensures high quality of model results
1 Swiss regulator. 2 German regulator. Solvency II – Analysts’ briefing 6Overview and implementation – Internal model application process
Munich Re Group’s internal model captures all relevant
risks globally
Application of Munich Re Group’s internal model
Internal model covers all risks
of Munich Re Group (“full
internal model”)
Use of internal models at entity
level for selected companies in
Europe (MR-AG, MR of Malta,
DKV, ERGO Property-casualty,
ERGO Direkt and New Re
according to SST1)
Use of standard
model for other European legal
entities
Majority of capital is in legal
entities using internal models
Group internal model Internal model applied to legal entities
Efficient allocation of capital within Munich Re Group remains key under Solvency II
1 Swiss Solvency Test. Solvency II – Analysts’ briefing 7Overview and implementation – Application of Solvency II methodology at Munich Re
Main features of application of Solvency II
methodology at Munich Re
Own funds (OF) / Solvency capital requirement (SCR)
Munich Re Group’s own funds and SCR based on consolidated accounts – no use of lower, statutory
capital requirements via deduction and aggregation method (e.g. US subsidiaries)
High quality of Munich Re Group’s own funds
SCR based on full internal model
Conservative approach adopted (e.g. for loss-absorbing capacity of deferred taxes, treatment of
government bonds)
Profit and loss attribution (reflecting changes in own funds) used for validation of internal model and
value-based management
Application of transitionals and LTG measures
Currently no optional long-term-guarantee measures considered (e.g. transitionals, volatility adjustment
(VA), matching adjustment (MA)) – final decision to be taken at year-end 2015
Grandfathering
Grandfathering partly used for subordinated liabilities
Straight-forward implementation reflects high maturity of Munich Re’s internal model
Solvency II – Analysts’ briefing 8Overview and implementation – Application of Solvency II methodology at Munich Re
EIOPA risk-free interest rates applied
without optional elements
Illustration of long-term-guarantee measures Application at Munich Re
Rate
EIOPA risk-free interest rates
Swap rates adjusted for credit risk (CRA) up to last
liquid point (LLP)
Extrapolation: Risk-free interest rates extrapolated
With MA
With VA
to ultimate forward rate (UFR) starting from LLP
Swap rates plus extrapolation
EIOPA risk-free interest rates Euro (current LLP Convergence UFR
expectation) 20 years 40 years 4.2%
Observed Extrapolation
data
0 10 20
LLP 30 40 50 60
Maturity 70
Impact of ultimate forward rate
Actual discount rate based on risk-free spot rates
Adjustments bps1
UFR affects risk-free spot rates only from LLP on
2012 2013 2014 Potential changes in UFR expected to have very
Credit risk adjustment (CRA) –20 –10 –10 limited effect
Volatility adjustment (VA) 40 20 18
Possible reduction of UFR with very limited impact on Munich Re’s SII ratio due to
diversity of business models within Munich Re Group
1 End of year. Solvency II – Analysts’ briefing 9Overview and implementation – Summary of main changes
Positive effects on solvency ratio from transposition
into Solvency II world
Impact Impact on
on eligible solvency capital
Available Eligible own funds requirement
financial own
ressources funds Fungibility and
transferability
restrictions
ERGO Life/Health
= SII ratio Surplus funds
(‘free RfB’)
Application of
Economic EIOPA risk-free
risk Solvency interest rates
capital/1.75 capital
requirement Loss-absorbing
capacity of
deferred taxes
Capitalisation of Munich Re remains very strong under Solvency II regime
Solvency II – Analysts’ briefing 10Agenda
Overview and implementation
Impact on Munich Re
Solvency II balance sheet and own funds
Solvency capital requirement
Solvency II capitalisation ratio and target capitalisation
Impact on the insurance industry
Solvency II – Analysts’ briefing 11Solvency II balance sheet and own funds – SII calculation scheme
From top-down AFR approach to bottom-up own funds
calculation
Old world – Top-down approach New world (SII) – Bottom-up approach
AFR derived from IFRS equity via Eligible own funds derived from SII excess of
economic adjustments assets over liabilities in a very granular process
SII balance
sheet
Excess of
assets
over
liabilities
Eligible
own
IFRS AFR = funds
equity
Calculation of own funds based on full Solvency II balance sheet
Solvency II – Analysts’ briefing 12Solvency II balance sheet and own funds – SII calculation scheme
Consistent methodology for the calculation and
disclosure of the SII ratio
Available Required Solvency II
capital capital capitalisation ratio
SII balance sheet
audited
Solo2
deductions
Excess of
assets Group3
deductions
over
liabilities EAoL
(EAoL) after Tier 1 Tier 1
deductions unrestricted unrestricted
Basic SII ratio6
Subord. Subord. own Eligible
Tier 1
Assets Tier 1 own =
Classification
liabilities liabilities funds restricted
in SII
balance
with OF1
character
with OF
character (BOF) Available
restricted
= funds
Solvency
capital
own funds (EOF)
sheet Tier 2 require- EOF
Limits
Other items (AvOF) ment
approved Tier 2 (SCR)
Tier 3 SCR
Liabilities Ancillary
in SII balance 5 5
sheet
OF4
(AOF) Tier 3
Clearly defined system for calculation of eligible own funds
New concept of tiering requires quality assessment of own funds
Components and quality of own funds highly complex but transparent
1 Own funds. 2 E.g. foreseeable dividends and distributions, own shares, ring-fenced funds, matching adjustment portfolio.
3 Non-available own funds items (e.g. non available surplus funds) and deduction of own funds from participations in other financial
sectors. 4 Off-balance sheet items that can be called up to absorb losses, e.g. letters of credit (subject to supervisory approval).
5 EOF/SCR for other financial sectors. 6 MR Group reports SII ratio including other financial sectors according to aligned ‘SII capital Solvency II – Analysts’ briefing 13
market disclosure concept’.Solvency II balance sheet and own funds – Own funds structure at Munich Re Group
Reconciliation of BOF to EOF: SII methodology less
complex at Munich Re Group
Own funds as at 31 December 2014
No ancillary own funds
Basic own funds equal
Available own funds
No tiering effects
Available own funds equal
Eligible own funds1
No “ring-fenced funds”
or “matching adjustment portfolio”
No “other items approved”
by supervisory authorities
Munich Re Group’s own funds have a straight-forward structure
1 For ‘SII ratio including other financial sectors’, EOF need to be increased by EOF related to other financial sectors. Solvency II – Analysts’ briefing 14Solvency II balance sheet and own funds – Reconciliation AFR to own funds
Continuity in capital resources despite
new methodology
Reconciliation AFR to own funds as at 31 December 2014 €bn
Comments
Available financial resources (AFR) 38.8
Recognition of surplus funds and
Foreseeable share buy-backs2 other valuation adjustments
–0.3
Various valuation differences between
Surplus funds (‘free RfB’) 2.0 SII methodology and former AFR
approach pretty much level out (including
recognition of surplus funds);
Other valuation adjustments (AFR vs. SII) –1.7 management reserve margin RI P-C1
included in the AFR but not in SII own
Optional long-term-guarantee measures – funds
Optional long-term-guarantee measures
Restrictions3 –0.8
Currently not considered
SII basic own funds (BOF) 38.0 Restrictions
Non-available own funds items formerly
Restrictions from tiering 0.0 recognised in higher capital
requirements
Own funds for FCIIF and IORP4 0.2 Restrictions from tiering
High quality of SII capital resources
SII eligible own funds (EOF) 38.2 allows full consideration of BOF as EOF
1 ~€2bn after tax. 2 Outstanding from share buy-back 2014/2015. 3 Deduction of non-available own funds items of –€0.5bn (e.g. non
available surplus funds) and deduction of own funds from participations in other financial sectors. 4 Own funds for other financial Solvency II – Analysts’ briefing 15
sectors (financial, credit institutions and investment firms and institutions for occupational retirement provision).Solvency II balance sheet and own funds – SII balance sheet
Main differences between Solvency II and
IFRS balance sheets
Balance sheet item SII IFRS
Goodwill and intangible assets No recognition, Amortised cost
i.e. valued at zero
Property, loans Fair value Amortised cost
Subordinated liabilities Fair value Amortised cost
Technical provisions Technical provision (discounted) Nominal value
= Best estimate (in exceptional cases
+ Risk margin discounted values)
Surplus funds (‘free RfB‘) Treated as own funds Treated as liabilities
Other assets / other liabilities Mostly fair value Amortised cost
Solvency II balance sheet is a full fair-value balance sheet
Solvency II – Analysts’ briefing 16Solvency II balance sheet and own funds – Comparison SII and IFRS balance sheet
From IFRS to Solvency II excess of assets over
liabilities
€bn Assets/Liabilities (clustered)
as at 31.12.2014 SII IFRS Comments
No recognition of goodwill
Goodwill and intangible assets1 0.0 3.6 –3.6 and intangible assets in SII –3.6
Investments including loans,
deposits with cedants, cash 243.2 230.3 12.9
Full fair values in SII lead to
higher balances
Subordinated liabilities –5.0 –4.4 –0.6
Net deferred tax assets / Different valuation methods produce
liabilities1 –3.6 –1.9 –1.7 difference in deferred taxes 6.1
Other assets and other liabilities1 –6.4 –8.8 2.4 For example discounting effects in SII
SII: Risk margin and additional policyholder
Technical accounts1
–193.5 –186.6 –6.9 participation due to higher fair values of
without surplus funds assets are partly offset by reserve discounting
Surplus funds (‘free RfB’) are own funds in SII
Surplus funds 0.0 –2.0 2.0 and are therefore not classified as liabilities 2.0
SII EAoL versus IFRS equity 34.8 30.3 4.5 +4.5
Fair values, risk margin and surplus funds are the main differences
1 IFRS balances reflect reclassifications in order to facilitate comparison to IFRS equity / Eligible own funds reconciliation. Solvency II – Analysts’ briefing 17Solvency II balance sheet and own funds – Reconciliation of IFRS equity to own funds
Reconciliation of IFRS equity with eligible own funds
includes both well-known and new elements
Reconciliation of IFRS equity to eligible own funds as at 31 December 2014; €bn
Structure according to ‘SII capital market disclosure concept’ defined by Allianz, Talanx and Munich Re
IFRS equity 30.3
Goodwill and intangible assets –3.6
Valuation adjustments 6.1 +4.5
Surplus funds (‘free RfB’) 2.0
Excess of assets over liabilities 34.8
Subordinated liabilities 5.0
Foreseeable dividends,
distributions and own shares1 –1.0
Restrictions2 –0.8
Basic own funds 38.0
Ancillary own funds 0.0
Restrictions from tiering 0.0
Own funds for FCIIF and IORP3 0.2
Eligible own funds 38.2
1 Foreseeable distributions from share buy-backs (–€0.3bn) and own shares (–€0.7bn). 2 Deduction of non-available own funds items of
–€0.5bn (e.g. non-available surplus funds) and deduction of own funds from participations in other financial sectors. 3 Own funds for Solvency II – Analysts’ briefing 18
other financial sectors (financial, credit institutions and investment firms and institutions for occupational retirement provision).Solvency II balance sheet and own funds – Tiering of group own funds
SCR limits do not lead to restrictions from tiering –
89% tier 1 capital
SCR limits EOF 31.12.2014 €bn
Tier 1: 85% Tier 1: 4%
T1u T1r, T2, T3
! fully eligible subject to limits
! unrestricted restricted (1.5)
(32.5) Undated subordinated
liability1
Tier 1 T1
unrestricted 50% SCR TOTAL
€38.2bn
SCR
EOF
Tier 1 T1 r
restricted 20% T1
Tier 3: 2% Tier 2: 9%
(T2+T1rcut)+T3 (3.5)
Tier 2 (0.7)
50% SCR
Net deferred Dated subordinated
T3 tax asset liabilities2
Tier 3
15% SCR
High quality of capital provides Munich Re with flexibility and capacity
1 MR AG undated subordinated liability nominal €1,349m according to MR’s own assessment accounted for under transitional arrangements
– “grandfathering”. 2 Mainly MR AG dated subordinated liabilities nominal €900m, €1,000m and £450m according to MR’s own Solvency II – Analysts’ briefing 19
assessment; nominal £300m according to MR’s own assessment accounted for under transitional arrangements – “grandfathering”.Solvency II balance sheet and own funds – Concept of economic earnings
Profit and loss attribution explains change in Solvency II
eligible own funds – Focus on economic earnings
Expected return Operating Total Expected return existing business
existing business economic economic Risk-free interest on economic capital
earnings earnings resources and unwind of risk margin
New
business New business value
value
Value of new business written in
reporting period, valued at end of
period, after capital costs
Operating
variances Operating variances existing
existing business Experience variances and
business assumption changes; reflect positive
or negative deviations from prior
Other year’s business valuation
operating
Other operating variances
variances
Model changes, etc.
Economic Economic effects
effects
Changes in economic capital resources
from development of capital market
parameters on assets and liabilities
Other non-
Other non-operating earnings
operating
earnings Overall tax effect and other items
Note: All operating economic earnings components as well as economic effects are reported before tax. Solvency II – Analysts’ briefing 20Solvency II balance sheet and own funds – Movement analysis profit and loss attribution
Group economic earnings split
into three major components
Group economic earnings 2014 €bn
Pleasing new business value and existing business development
Operating economic earnings 1.5 especially in RI Life and RI Property-Casualty; model enhancements
in RI Life and ERGO Life operations with negative effect
Economic effects 2.2
Positive FX effects and gains in equities mainly in RI are partly
Interest rate –0.9 offset by overall negative impact of lower interest rates (negative
ERGO effect exceeded positive impact for RI and MH)
Equity 0.4
Credit 0.3
Currency 1.8
Other1 0.6
Overall tax effect and other items
Other non-operating earnings –0.6
Total economic earnings 3.2
Economic earnings supported by sound technical result
and good asset-liability management
1 Primarily related to illiquid investments: property, infrastructure, forestry, hedge funds, private equity. Solvency II – Analysts’ briefing 21Solvency II balance sheet and own funds – Profit and loss attribution by business unit
Profit and loss attribution provides consistent reporting
of economic performance across business units
Munich Re (Group) FY 2014 ERGO ERGO
RI RI Life/Health P-C ERGO Munich MR
€bn Life P-C Germany Germany Intl. Health (Group)
Operating economic earnings 0.2 1.6 –0.4 0.2 –0.1 0.1 1.5
Expected return existing business 0.1 0.3 0.1 0.0 0.1 0.0 0.7
New business value 0.6 0.5 0.2 0.2 0.0 0.1 1.5
Operating variances existing business 0.2 0.8 –0.3 0.0 –0.1 0.0 0.5
Other operating variances –0.7 0.0 –0.5 0.0 0.0 0.0 –1.2
Economic effects 1.0 2.3 –1.3 0.3 –0.2 0.1 2.2
Other non-operating earnings –0.2 0.1 –0.1 –0.2 –0.1 0.0 –0.6
Total economic earnings 1.1 3.9 –1.8 0.3 –0.4 0.2 3.2
Capital measures –2.6
Changes in other own funds items –
Change in SII EOF 0.6
Former MCEV concept now integrated in group-wide SII-based performance metric
Solvency II – Analysts’ briefing 22Solvency II balance sheet and own funds – Profit and loss attribution by business unit
Economic earnings Reinsurance Life
Munich Re (Group) FY 2014 RI Main sources of
€bn Life operating economic earnings
Operating economic earnings 0.2 Overall, the FY 2014 new business value fits well into
Munich Re’s long and successful track record
Expected return existing business 0.1 [cf. MCEV report, page 8]
Operating variances include experience variances
New business value 0.6 somewhat higher than expected reflecting aggregates
in mortality and morbidity [cf. Analysts‘ conference
Operating variances existing business 0.2 presentation 2015, p. 71]. Assumption changes have
been updated to reflect both past evidence and
Other operating variances –0.7 expected future experience
[cf. MCEV report, page 9]
Economic effects 1.0 Other operating variances allow for model changes
resulting from the continuous revision of valuation
Other non-operating earnings –0.2 models
[cf. MCEV report, page 9]
Total economic earnings 1.1
Pleasing new business value generation, but negative effects from model updates
Solvency II – Analysts’ briefing 23Solvency II balance sheet and own funds – Profit and loss attribution by business unit
Economic earnings Reinsurance Property-Casualty
Munich Re (Group) FY 2014 RI Main sources of
€bn P-C operating economic earnings
Operating economic earnings 1.6 Operating economic earnings driven by good underlying
profitability. Favourable major loss development vs.
Expected return existing business 0.3 expectation contributes €0.8bn [cf. Analysts‘ conference
presentation 2015, page 6; 69; 102]
New business value 0.5 Unchanged reserving discipline reflected in new
business value usually facilitates reserve releases
Operating variances existing business 0.8 of ~4% without challenging the prudency level;
corresponding NBV adjusted for prudency margin
Other operating variances 0.0 €1.1bn [cf. Analysts‘ conference presentation 2015,
p. 19]. Besides, new business value benefits from major
losses below expectation for current development year
Economic effects 2.3
[cf. Analysts‘ conference presentation 2015, page 102]
Other non-operating earnings 0.1 Operating variances contain the effect of favourable
actual vs. expected comparison which allow ultimate
reductions for prior years (€0.9bn adjusted for
Total economic earnings 3.9
commission effects) [cf. Analysts‘ conference
presentation 2015, page 19; 21]
Favourable developments in large losses and reserve releases
slightly above expectation
Solvency II – Analysts’ briefing 24Solvency II balance sheet and own funds – Profit and loss attribution by business unit
Economic earnings ERGO
ERGO ERGO Main sources of
Munich Re (Group) FY 2014 Life/Health P-C ERGO
€bn Germany Germany Intl. operating economic earnings
Operating economic earnings –0.4 0.2 –0.1 NBV Life/Health lower than last year [cf.
MCEV report, page 17] while P-C‘s NBV
Expected return existing business 0.1 0.0 0.1 remained stable
Operating variances existing business:
New business value 0.2 0.2 0.0 especially German life primary business
impacted negatively by various effects,
Operating variances existing e.g. with regard to profit sharing, lapses
–0.3 0.0 –0.1
business and expenses, with variances in profit
Other operating variances –0.5 0.0 0.0 sharing as main driver among these
experience variances. International life
primary business produced negative
Economic effects –1.3 0.3 –0.2
assumption changes [cf. MCEV report,
page 15]
Other non-operating earnings –0.1 –0.2 –0.1
Other operating variances negative as
a result of various model refinements
Total economic earnings –1.8 0.3 –0.4
predominantly in German life primary
business [cf. MCEV report, page 15]
Challenges from low-yield environment reflected in ERGO Life/Health Germany,
while property-casualty business remains profitable
Solvency II – Analysts’ briefing 25Agenda
Overview and implementation
Impact on Munich Re
Solvency II balance sheet and own funds
Solvency capital requirement
Solvency II capitalisation ratio and target capitalisation
Impact on the insurance industry
Solvency II – Analysts’ briefing 26Solvency capital requirements – Integration in business decisions
Munich Re’s long-standing internal risk model was
already substantially compliant with SII requirements
Munich Re’s internal model originally developed for internal corporate management
Internal model developed in recent decades as a foundation for value-based management
The model reflects risks on both the asset and the liability side of the balance sheet on an economic
valuation basis
Internal model covers all risk categories (e.g. including operational risk) within entire Munich Re Group on
the basis of consolidated accounts (“full internal model”)
Internal model recognised by S&P in determining the target rating capital (“M-factor”).
Munich Re’s Enterprise Risk Management is assessed as “very strong” by S&P, the highest level
in the industry.
Final adoption of internal model when entering Solvency II
No major changes in the SCR or internal management due to the following modifications:
Use of EIOPA risk-free interest rates
Consideration of fungibility and transferability restrictions
Treatment of loss-absorbing capacity of deferred taxes
Internal risk model well integrated into management and business decisions
Solvency II – Analysts’ briefing 27Solvency capital requirements – Reconciliation as at 31.12.2014
New risk disclosure mirrors Solvency II model
characteristics
Risk capital – Breakdown by risk category €bn Main drivers for differences Impact on SII-SCR
Risk category ERC ERC/1.75 SII-SCR Transition from swap rates Life and Health
Prop.Casualty 1
10.0 5.7 5.7 to EIOPA risk-free interest
rates Market
Life and Health 9.0 5.1 4.8
Implementation of SII rules Market
Market 12.5 7.1 8.8 on fungibility and
Credit2 6.7 3.8 4.6 transferability (Group) Diversification
Operational risk 1.7 1.0 1.0 Transition to pre-tax Life and Health
Other3 – – 0.2 disclosure of risk categories Market
and introduction of loss-
absorbing capacity of Credit
Simple sum 39.9 22.7 25.1 deferred taxes Tax
Diversification –13.0 –7.3 –9.1
Tax – – –2.2 The SII-SCR numbers are based on the approved
internal model. The SCR calculation is based on
VaR99.5%.
Total risk capital 26.9 15.4 13.8
Moderate decrease of disclosed SCR, mainly driven by consideration of
loss- absorbing capacity of deferred taxes
1 Credit(re)insurance included.
2 Default and migration risk.
3 Capital requirements for other financial sectors, e.g. institutions for occupational retirement provisions. Solvency II – Analysts’ briefing 28Solvency capital requirements – Reconciliation as at 31.12.2014
Breakdown of SII-SCR by business field
Risk capital – Breakdown by risk category €bn Reconciliation as at 31.12.2014 €bn
Risk category Group RI ERGO MH Div.
ERC/1.75 15.4
ERC/ SII- SII- SII- SII- SII-
1.75 SCR SCR SCR SCR SCR Property-
Casualty +0.0
Prop.-Casualty 5.7 5.7 5.6 0.3 0.0 –0.2 Life and
Health –0.3
Life and Health 5.1 4.8 3.6 2.1 0.3 –1.2
Market 7.1 8.8 5.5 5.0 0.0 –1.7 Market +1.7
Credit 3.8 4.6 2.8 1.9 0.0 –0.1 Credit +0.8
Operational risk 1.0 1.0 0.8 0.4 0.1 –0.3
Op Risk +0.0
Other – 0.2 – – – –
Other +0.2
Simple sum 22.7 25.1 18.3 9.7 0.4 –3.5
Diversifi-
Diversification –7.3 –9.1 –7.1 –2.6 –0.1 – cation –1.8
Tax –2.2 –1.9 –0.5 0.0 – Tax –2.2
Total SCR 15.4 13.8 9.3 6.6 0.3 –2.5 SII-SCR 13.8
Solvency II – Analysts’ briefing 29Solvency capital requirements – Breakdown by risk category as at 31.12.2014: Property-Casualty
Munich Re benefits from strong diversification between
natural catastrophe risks
Munich Re (Group) – Nat cat exposure (net of retrocession)1 €bn SCR Property-Casualty €bn
AggVaR (return period 200 years)
(pre-tax) 5.7 5.7
4
Atlantic Hurricane
3 Storm Europe
ERC/1.75 SII-SCR
Earthquake Los Angeles
2 Basic losses 3.2
Major losses2 5.1
Diversification –2.6
1
Total 5.7
0
2014 2015 2014 2015 2014 2015
Atlantic Storm Earthquake Top nat cat exposures
Hurricane Europe Los Angeles
No changes in Property-Casualty risk module
1 Exposures relate to the full year, e.g. 2015 relates to the period from 1.1.2015 to 31.12.2015.
2 Natural catastrophes, man-made (including terrorism and casualty accumulation) and major single losses. Solvency II – Analysts’ briefing 30Solvency capital requirements – Breakdown by risk category as at 31.12.2014: Life/Health
Decrease in Life/Health SCR mainly driven by transition
from swap rates to EIOPA risk-free interest rates
SCR Life/Health €bn ERGO Life/Health Impact on SII-SCR
Final model adoptions:
5.1
Treatment of Surplus Funds
4.8
Consistent use of Risk Margin
ERC/1.75 SII-SCR Refined modelling of the “ZZR” for
German life primary business
2.4 Use of EIOPA risk-free interest rates
Longevity
3.1
“Pre-tax” disclosure
3.0
Mortality
2.9
Reinsurance Life
2.5
Morbidity Model used in Q4 2014 was already
2.4
Solvency II-compliant
0.5 SII-SCR
Health ERC/1.75 Implementation of EIOPA risk-free
0.5
interest rates has a modest effect on
overall life reinsurance SCR
Solvency II – Analysts’ briefing 31Solvency capital requirements – Breakdown by risk category as at 31.12.2014: Market
Market risk categories affected differently
by model adoptions
Risk category Group RI/MH ERGO Div. Explanation
Year-end 2014 ERC/ SII- SII- SII- SII-
€bn 1.75 SCR SCR SCR SCR
Minor increase due to conversion to pre-tax
Equity 3.3 3.4 2.6 0.8 ±0.0 calculation
General interest rate 3.0 3.8 1.8 3.9 –1.9 Transition to risk margin and conversion to pre-tax
calculation partially offset by application of EIOPA risk-
Credit spread 3.0 3.1 1.7 2.0 –0.6 free interest rates
Real estate 1.3 1.3 0.8 0.5 ±0.0
Implementation of SII fungibility and transferability
Currency 1.5 3.5 3.4 0.2 –0.1 rules
Simple sum 12.1 15.1 10.3 7.4 –2.6
Diversification –5.0 –6.3 –4.8 –2.4 – Improved diversification due to SCR increase
Total SCR 7.1 8.8 5.5 5.0 –1.7
Pre-tax disclosure and conservative treatment of SII availability restrictions
lead to increases in different risk categories
Solvency II – Analysts’ briefing 32Agenda
Overview and implementation
Impact on Munich Re
Solvency II balance sheet and own funds
Solvency capital requirement
Solvency II capitalisation ratio and target capitalisation
Impact on the insurance industry
Solvency II – Analysts’ briefing 33Solvency II capitalisation ratio and target capitalisation – Capital management
Capitalisation in the Solvency II regime
remains very comfortable …
Sound capitalisation according to all metrics Attractive shareholder participation1 €bn
Medium
Cash
yield2 11.2% 7.8% 5.4% 6.0% 9.6% ~7%
Eligible own funds of
Low High
high quality
Quality of
Capital
2.7
2.4 2.3
175%
SII ratio well over 220% Share
buy-back
140% 220%
Internal 1.5 1.6
Sub- Above
optimal model target
AA 1.1
Substantial capital buffer Dividend
A AAA supporting AA rating
Rating
agencies
Medium
2010 2011 2012 2013 2014 2015e
German GAAP earnings largely
Low High protected by equalisation reserve Almost €20bn returned to shareholders
HGB
flexibility since 2006
… enabling ongoing active capital management
1 Cash-flow view.
2 Total payout (dividend and buy-back) divided by average market capitalisation. Solvency II – Analysts’ briefing 34Solvency II capitalisation ratio and target capitalisation – Reconciliation
Reconciliation of economic earnings to German GAAP
(HGB) result
Reconciliation of economic earnings to HGB result €bn
0.6 6.8 –3.6
3.2
0.5 –1.4
3.2 –0.3 3.2 –0.5 0.3 3.0
2.0
Economic Change
Economic Effectin
1 Effect 2 in Change
Change Effect 3 in IFRS Total
total Income
Income and IFRS Result
IFRS Difference Other Distributable
HGB Div.-proposal
Tax Net income
Change Distributable
HGB
Earnings 2014 goodwill
earnings valuation surplus recognised
recognised expenses
and 2014
result between accounting earnings
result FY 2016
reducing (Plan
of earnings
result
income and recognised 31.12. (to be paid 2017) 31.12.
2014 and adjustments1 funds1 income
expensesand expenses
directly in 2014 IFRS differences before
2016 effect2
04/2017) equali- 2014
2017
intangible expenses
(IFRS) recognised
equity results of equali- of equali- sation
assets1 2014 directly subsidiaries sation sation reserves
in IFRS and their reserves reserves
equity dividend
payments
Please refer to slide 18 to Munich
Re AG
1 Based on rough estimates. 2 Assuming a tax rate of 33% for Munich Re AG. Solvency II – Analysts’ briefing 35Solvency II capitalisation ratio and target capitalisation – SII ratio as at 31.12.2014
Significant improvement in Munich Re’s SII ratio
Ratio based on AFR and ERC €bn Ratio based on AFR and ERC/1.75 €bn
Available Available
financial 37.2 financial 37.2
resources1 138% resources1 242%
Economic 26.9 SCR = 15.4
risk capital ERC/1.75
SII ratio2 €bn
Eligible
own funds 38.2
277%
Solvency capital
13.8
requirement
Pro-forma Q3 2015 SII ratio expected to be around 260%
1 After dividend of ~€1.3bn announced for 2014 to be paid in April 2015 and outstanding share buy-backs of ~€0.3bn.
2 Ratio after dividend of ~€1.3bn for 2014 to be paid in April 2015: 268%. Solvency II – Analysts’ briefing 36Solvency II capitalisation ratio and target capitalisation – Target Capitalisation
Despite more favorable ratio: Target capitalisation range
kept stable because of higher confidence level
Munich Re actions SII ratio %
>220%
Above target capitalisation
Capital repatriation
Increased risk-taking 277% SII ratio
Holding excess capital to meet
external constraints
175% – 220% Ratio based on
242%
Target capitalisation 220% AFR and ERC/1.75
Optimum level of capitalisation
140% – 175%
Below target capitalisation 175%
Tolerate (management decision) or
take if necessary management action
(e.g. risk transfer, scaling-down of
140%
activities; raising of hybrid capital)Solvency II capitalisation ratio and target capitalisation – Sensitivities
Sensitivities of SII ratio …
SII ratio – Sensitivity %
Ratio as at
31.12.14
277
Interest rate
+100bps
322
Interest rate
–100bps
235
Spread
+100bps
239
Equity
markets +30%
290
Equity
markets –30%
265
FX –10% 273
Atlantic
Hurricane1
260
175 220
… underline robustness of capital position
1 Based on 200 year event. Solvency II – Analysts’ briefing 38Agenda
Overview and implementation
Impact on Munich Re
Solvency II balance sheet and own funds
Solvency capital requirement
Solvency II capitalisation ratio and target capitalisation
Impact on the insurance industry
Solvency II – Analysts’ briefing 39Impact on the insurance industry
Overarching impact of Solvency II:
Focus on capital management
1 Increasing number of capital 2 Strong impact of asset- 3 Trade-off between customer
management dimensions liability management (ALM) needs and capital impact
Solvency II another highly Development of robust ALM Capital requirements integral
complex and volatile techniques vital for companies part of product development,
dimension in addition to local to prosper under Solvency II profitability assessment and
GAAP, tax, rating and IFRS Integration of Solvency II monitoring
(as applicable) interest-rate adjustments 1 Companies will be nudged
Impact of business decisions a further challenge towards risk and value-based
immediately visible through Trade-off between hunt for management
economic measurement yield and keeping capital However, customers and
approach under Solvency II requirements under control, policyholders expect insurance
Differences in underlying especially in Life business companies to offer products
principles may lead to Removal of artificial investment which satisfy their needs /
conflicting management restrictions allows greater wishes, e.g. long-term-
impulses – in extreme cases freedom but “prudent person guarantee products
“capital eats strategy” principle” requires close
alignment of investments with
policyholder interests
Capital management will become a multi-faceted exercise under Solvency II and
be a core factor in strategic discussions in areas such as new product development
1 Credit adjustment, volatility adjustment, matching adjustment, interest-rate transitional (as applicable). Solvency II – Analysts’ briefing 40Impact on the insurance industry
Solvency II plays to Munich Re’s strengths
Observations … … and implications
Reinsurance on par with traditional capital Reinsurance will be used as an additional
management instruments (e.g. equity, debt) capital management instrument
Knowledge of individual client situation key Analytical capabilities needed to analyse clients
to developing tailor-made solutions and evaluate solutions
World-wide move towards risk-based supervision Experience gained in Europe can be transferred
similar to Solvency II (e.g. China, Mexico) to other countries – advantage for global players
Evolution of reinsurance inspired by Solvency II and similar regimes
Know your Illustrative
client
Co-creation / strategic partnerships
KPI optimisation
SCR relief
Short-term Medium-term Long-term
Solvency II – Analysts’ briefing 41Impact on the insurance industry
Impact on competitiveness: Solvency II fully
crystallising the value of the reinsurance business model
Risk transfer – illustrative Counterparty default by rating and no. of reinsurers1
Primary insurer's Reinsurer's € Number of reinsurers
portfolio portfolio Capital
strength #1 #2 #3 #4 #5
Risk capital Capital relief Additional risk capital
€m AAA 8 7 6 6 6Impact on the insurance industry
Solvency II as an additional driver in some of
Munich Re’s strategic business initiatives
Cyber risks Automation and digitalisation of
Energy and technology (e.g. processes (e.g. automated
technical performance guarantees) underwriting platform)
Non-damage BI White labelling
Weather and climate New New business Risk-sharing with pension funds
(re-)insurance models
Project cost insurance
products
Product design in Life and Health
based on enhanced data analytics
Key
development
areas
New risk-
Consultancy (e.g. Motor and related New clients
Corporate finance/capital
Property Consulting services) services and demands management solutions
Project risk rating (e.g. Capital Partners)
Virtual simulation of e.g. construction Public-sector business development
Predictive and preventive services Sharing economy/mobility
~ €400m1 premium generated by innovative products
1 Approximation – not fully comparable with IFRS figures. Solvency II – Analysts’ briefing 43Backup
Glossary
A
AOF Ancillary own funds. Off-balance-sheet items that can be called upon to absorb losses, e.g. letters of credit
(subject to supervisory approval).
B
BOF Basic own funds. Own funds consisting of EAoL after deductions, subordinated liabilities treated as own funds
character and other items approved.
C
Capital measures Changes in own funds, for example due to dividends, shares bought back, hybrid capital raised or repaid or changes in
foreseeable capital distributions (dividends and share buy-backs).
Change in other own funds Part of PLA, e.g. change in non-available Own funds items, change in restrictions from tiering.
items
ComFrame Common Framework for the Supervision of Internationally Active Insurance Groups: ComFrame is a set of international
supervisory requirements developed by IAIS (International Association of Insurance Supervisors) focusing on the
effective group-wide supervision of internationally active insurance groups (IAIGs).
D
Diversification The diversification measures the balancing effects between different risk sources within a portfolio, taking account of
dependencies which assess the extent to which events could occur simultaneously.
Dynamic volatility adjustments The level of the volatility adjustment changes during calculating the capital requirements. In scenarios where the credit
spreads widen/narrow, the basic risk-free interest rates are increased/decreased reducing the overall spread risk. The
dynamic volatility adjustment can only be applied in internal models. Munich Re does not intend to apply the dynamic
volatility adjustment.
Solvency II – Analysts’ briefing 44Backup
Glossary
E
EAoL Excess of assets over liabilities. Obtained by deducting total liabilities from total assets in the Solvency II balance
sheet.
Economic earnings Change in economic capital resources in the reporting period, adjusted for capital measures, especially dividend
payouts and share buy-backs, as well as changes in other own funds items. Economic earnings are part of Profit and
loss attribution.
Economic effects Changes in economic capital resources from development of capital market parameters on assets and liabilities.
Assets and liabilities are measured consistent to SII balance sheet.
EOF Eligible own funds. Part of own funds eligible to cover Solvency capital requirements after consideration of potential
limits from tiering; numerator of Solvency II capitalisation ratio.
Equivalence Solvency II includes provisions for assessment of the solvency regimes and systems of group supervision of countries
outside the EU. The purpose of these assessments is to determine whether the regimes and systems assessed are
equivalent to the comparable provisions of Solvency II.
ERC Economic risk capital: Based on Munich Re internal model: 175% times VaR 99.5%.
Expected return Risk-free interest on economic capital resources and unwind of risk margin.
existing business
Solvency II – Analysts’ briefing 45Backup
Glossary
F
FCIIF Credit institutions, investment firms, financial institutions, alternative investment fund managers, financial institutions.
Own funds for FCIIF and IORP are not part of BOF but EOF.
G
Grandfathering Now referred to as „transitional arrangements“. Please see below.
G-SIIs Global systematically important insurers.
H
HLA Higher loss absorbency: The higher loss absorbency requirement developed by IAIS will be a globally comparable
group capital requirement that applies to all global systemically important insurers (G-SIIs).
I
ICS International Capital Standards: The ICS is part of ComFrame and will apply to all internationally active insurance
groups (IAIGs) and G-SIIs.
IORP Institutions for occupational retirement provision: Own funds for FCIIF and IORP are not part of BOF but EOF.
Solvency II – Analysts’ briefing 46Backup
Glossary
L
LTG measures Long-term-guarantee measures: volatility adjustment, matching adjustment, transitional measures for the risk-free
interest rates and transitional measures for technical provisions.
M
Matching adjustment (MA) Adjustment based on spread between interest rate of specific asset portfolio and risk-free interest rates in which asset
and liability cash flows are closely matched; Portfolio-specific – used to calculate best estimate of the respective
liabilities.
M-Factor “M-Factor” reflects S&P’s view of the robustness of the insurer’s economic capital model.
N
New business value Value of new business (NBV) written in reporting period, valued at end of period, after capital costs.
Non-available own funds items Due to restrictions in fungibility and transferability (i.e. availability), certain own funds items of solo entities (e.g. surplus
funds, subordinated liabilities, deferred tax assets) cannot be taken to cover the Group SCR. Such “non available own
funds" may be included in the group own funds only up to the contribution of the related undertaking to the group SCR.
Formerly those restrictions were covered within the calculation of SCR.
Solvency II – Analysts’ briefing 47Backup
Glossary
O
Operating variances existing Experience variances and assumption changes; reflect positive or negative deviations from prior year’s business
business valuation.
Other valuation adjustments Various valuation differences between SII methodology and former AFR approach; e.g. transition to EIOPA
(AFR vs SII) yield curve, etc.
Other items approved Certain items in the SII balance sheet approved by the supervisor classify as BOF.
Other non-operating earnings Overall tax effect and other items.
Other operating variances Model changes, etc.
ORSA Own risk and solvency assessment: The ORSA can be defined as the entirety of the processes and procedures
employed to identify, assess, monitor, manage, and report the short and long-term risks a (re)insurance undertaking
faces or may face and to determine the own funds necessary to ensure that the undertaking’s overall solvency needs
are met at all times over the planning time horizon.
P
Profit and loss attribution (PLA) Analysis of changes in own funds: economic earnings, capital measures and change in other own funds items.
Reflection of risk and value drivers of major business units.
Q
QRT Quantitative Reporting Template.
Solvency II – Analysts’ briefing 48Backup
Glossary
R
Restrictions from tiering When calculating EOF, certain limits regarding the tiers have to be considered. The maximum limits regulate how much
capital of a specific tier is at least required to cover solvency requirements. If a limit is reached the entity has to deduct
own funds of a specific tier. This is not applicable to Tier 1 unrestricted items. SII limits do currently not lead to
deductions of own funds at Munich Re.
Ring-fenced funds (RFF) RFF have a reduced capacity to fully absorb losses on a going-concern basis due to their lack of transferability within
an undertaking. Such items have to be deducted from solo own funds if they exceed the notional SCR of that RFF.
Risk Margin The risk margin is designed to represent the amount an insurance company would require to take on the obligations of
a given insurance company on top of the best estimate of liabilities. It is calculated using a cost of capital approach.
S
Solvency II balance sheet Assets and liabilities recognised and valued according to the regulations of the new Solvency II supervisory regime.
(SII B/S)
Solvency II capitalisation ratio Quotient of eligible own funds and solvency capital requirements.
(SII ratio)
Solvency capital requirements The amount of capital that insurers in the European Economic Area are required to hold. The solvency capital
(SCR) requirement is set at a level that ensures that insurers can meet their obligations over the following 12 months with a
99.5% probability (VaR99.5%).
Surplus funds Components of provision for premium refund (free RfB) considered as own funds, partially treated as
non-available own funds item.
Solvency II – Analysts’ briefing 49Backup
Glossary
T
Technical accounts Aggregate of all asset and liability SII balance sheet items relating to technical accounting: technical provisions
including best-estimate liability and risk margin, reinsurance recoverables, deposits, etc.
Transitional arrangements SII regulation allowing subordinated liabilities issued prior to 1.1.2016 to be included as own funds even if they do not
comply with the general SII guidelines.
Transitionals The transitional measures for Solvency II are intended to ensure a smooth transition to meeting the full requirements
(e.g. transitional measures for risk-free interest rates and technical provisions).
V
Valuation adjustments Difference in valuation of assets and liabilities under IFRS and SII (e.g. fair values in SII vs. amortised cost in IFRS).
Volatility adjustment (VA) Adjustment to the relevant risk-free interest rates based on the spread between interest rates of a reference asset
portfolio and the risk-free interest rates.
Solvency II – Analysts’ briefing 50Backup: Shareholder information
Financial calendar
2016
4 February Preliminary key figures 2015 and renewals
Balance sheet press conference for 2015 financial statements
16 March
Analysts' conference in Munich with videocast
27 April Annual General Meeting 2016, ICM – International Congress Centre Munich
10 May Interim report as at 31 March 2016
9 August Interim report as at 30 June 2016
9 November Interim report as at 30 September 2016
Solvency II – Analysts’ briefing 51Backup: Shareholder information
For information, please contact
INVESTOR RELATIONS TEAM
Christian Becker-Hussong Thorsten Dzuba Christine Franziszi
Head of Investor & Rating Agency Relations Tel.: +49 (89) 3891-8030 Tel.: +49 (89) 3891-3875
Tel.: +49 (89) 3891-3910 E-mail: tdzuba@munichre.com E-mail: cfranziszi@munichre.com
E-mail: cbecker-hussong@munichre.com
Britta Hamberger Ralf Kleinschroth Andreas Silberhorn
Tel.: +49 (89) 3891-3504 Tel.: +49 (89) 3891-4559 Tel.: +49 (89) 3891-3366
E-mail: bhamberger@munichre.com E-mail: rkleinschroth@munichre.com E-mail: asilberhorn@munichre.com
Angelika Rings Andreas Hoffmann Ingrid Grunwald
Tel.: +49 (211) 4937-7483 Tel.: +49 (211) 4937-1573 Tel.: +49 (89) 3891-3517
E-mail: angelika.rings@ergo.de E-mail: andreas.hoffmann@ergo.de E-mail: igrunwald@munichre.com
Münchener Rückversicherungs-Gesellschaft | Investor & Rating Agency Relations | Königinstraße 107 | 80802 München, Germany
Fax: +49 (89) 3891-9888 | E-mail: IR@munichre.com | Internet: www.munichre.com
Solvency II – Analysts’ briefing 52Disclaimer
This presentation contains forward-looking statements that are based on current assumptions and forecasts
of the management of Munich Re. Known and unknown risks, uncertainties and other factors could lead to
material differences between the forward-looking statements given here and the actual development, in
particular the results, financial situation and performance of our Company. The Company assumes no liability
to update these forward-looking statements or make them conform with future events or developments.
Solvency II – Analysts’ briefing 53You can also read