BRITE photometry and STELLA spectroscopy of bright stars in
←
→
Page content transcription
If your browser does not render page correctly, please read the page content below
Astronomy & Astrophysics manuscript no. 39310final                                                                                    ©ESO 2020
                                               October 21, 2020

                                                   BRITE photometry and STELLA spectroscopy of bright stars in
                                                       Auriga: Rotation, pulsation, orbits, and eclipses? ??
                                                      K. G. Strassmeier1, 2 , T. Granzer1 , M. Weber1 , R. Kuschnig3, 4 , A. Pigulski5 , A. Popowicz6 , A. F. J. Moffat7 ,
                                                                                        G. A. Wade8 , K. Zwintz9 , and G. Handler10

                                                      1
                                                          Leibniz-Institute for Astrophysics Potsdam (AIP), An der Sternwarte 16, D-14482 Potsdam, Germany;
                                                          e-mail: kstrassmeier@aip.de,
                                                      2
                                                          Institute for Physics and Astronomy, University of Potsdam, D-14476 Potsdam, Germany
                                                      3
                                                          Institute for Astrophysics, University of Vienna, Türkenschanzstrasse 17, A-1180 Vienna, Austria
                                                      4
                                                          Institut für Kommunikationsnetze und Satellitenkommunikation, Technical University Graz, Inffeldgasse 12, A-8010 Graz, Austria
arXiv:2010.10092v1 [astro-ph.SR] 20 Oct 2020

                                                      5
                                                          Instytut Astronomiczny, Uniwersytet Wrocławski, Kopernika 11, 51-622 Wrocław, Poland
                                                      6
                                                          Faculty of Automatic Control, Electronics and Computer Science, Akademicka 16, 44-100 Gliwice, Poland
                                                      7
                                                          Dépt. de Physique and Centre de Recherche en Astrophysique du Québec (CRAQ), Université de Montréal, C.P. 6128, Succ.
                                                          Centre-Ville, Montréal, H3C 3J7, Canada
                                                      8
                                                          Department of Physics and Space Science, Royal Military College of Canada, P.O. Box 17000, Station Forces, ON, K7K4B4,
                                                          Canada
                                                      9
                                                          Institut für Astro- und Teilchenphysik, Universität Innsbruck, Technikerstraße 25, A-6020 Innsbruck, Austria
                                                     10
                                                          Nicolaus Copernicus Astronomical Center, Polish Academy of Sciences, ul. Bartycka 18, 00-716, Warsaw, Poland

                                                     Received ... ; accepted ...

                                                                                                                  ABSTRACT

                                                     Context. Knowing rotational and pulsational periods across the Hertzsprung-Russell diagram is of top priority for understanding
                                                     stellar activity as a function of time.
                                                     Aims. We aim to determine periods for bright stars in the Auriga field that are otherwise not easily accessible for ground-based
                                                     photometry.
                                                     Methods. Continuous photometry with up to three BRITE satellites was obtained for 12 targets and subjected to a period search.
                                                     Contemporaneous high-resolution optical spectroscopy with STELLA was used to obtain radial velocities through cross correlation
                                                     with template spectra as well as to determine astrophysical parameters through a comparison with model spectra.
                                                     Results. The Capella red light curve was found to be constant over 176 days with a root mean square of 1 mmag, but the blue light
                                                     curve showed a period of 10.1±0.6 d, which we interpret to be the rotation period of the G0 component. From STELLA we obtained
                                                     an improved orbital solution based on 9600 spectra from the previous 12.9 yr. We derive masses precise to ≈0.3% but 1% smaller
                                                     than previously published. The BRITE light curve of the F0 supergiant ε Aur suggests 152 d as its main pulsation period, while the
                                                     STELLA radial velocities reveal a clear 68 d period. An ingress of an eclipse of the ζ Aur binary system was covered with BRITE
                                                     and a precise timing for its eclipse onset derived. A possible 70 d period fits the proposed tidal-induced, nonradial pulsations of this
                                                     ellipsoidal K4 supergiant. η Aur is identified as a slowly pulsating B (SPB) star with a main period of 1.29 d and is among the brightest
                                                     SPB stars discovered so far. The rotation period of the magnetic Ap star θ Aur is detected from photometry and spectroscopy with a
                                                     period of 3.6189 d and 3.6177 d, respectively, likely the same within the errors. The radial velocities of this star show a striking non-
                                                     sinusoidal shape with a large amplitude of 7 km s−1 . Photometric rotation periods are also confirmed for the magnetic Ap star IQ Aur
                                                     of 2.463 d and for the solar-type star κ1 Cet of 9.065 d, and also for the B7 HgMn giant β Tau of 2.74 d. Revised orbital solutions are
                                                     derived for the eclipsing SB2 binary β Aur, which replaces the initial orbit dating from 1948 for the 27-year eclipsing SB1 ε Aur,
                                                     and for the RS CVn binary V711 Tau, for which a spot-corrected orbital solution was achieved. The two stars ν Aur and ι Aur are
                                                     found to be long-term, low-amplitude RV and brightness variables, but provisional orbital elements based on a period of 20 yr and an
                                                     eccentricity of 0.7 could only be extracted for ν Aur. The variations of ι Aur are due to oscillations with a period of ≈4 yr.
                                                     Key words. Stars: binaries – stars: rotation – stars: activity – stars: fundamental parameters – stars: pulsations – stars: late-type –
                                                     stars: eclipsing

                                                 ?
                                                    Based on data obtained with the BRITE-Constellation satellite and      1. Introduction
                                               the STELLA robotic telescope in Tenerife. BRITE (BRIght Target Ex-
                                               plorer) Constellation was designed, built, launched, operated, and sup-     Photometric time series of stars have been an essential tool for
                                               ported by the Austrian Research Promotion Agency (FFG), the Univer-         stellar astrophysics for over a century (e.g., Guthnick 1901, Steb-
                                               sity of Vienna, the Technical University of Graz, the University of Inns-   bins 1916), but really became top gear with the advent of ultra-
                                               bruck, the Canadian Space Agency (CSA), the University of Toronto           precise photometry from space. Time series can resolve the com-
                                               Institute for Aerospace Studies (UTIAS), the Foundation for Polish          plex light curves due to stellar pulsations or follow the ever-
                                               Science & Technology (FNiTP MNiSW), and National Science Cen-               changing tracers that govern stellar magnetic activity. Among
                                               tre (NCN).                                                                  the physical parameters that can be derived from photometry is
                                                ??
                                                    The data used in this paper is available in electronic form at the
                                                                                                                           stellar rotation and its subtle latitudinal dependence called dif-
                                               CDS via anonymous ftp to cdsarc.u-strasbg.fr (130.79.128.5) or via
                                               http://cdsweb.u-strasbg.fr/cgi-bin/.
                                                                                                                                                                      Article number, page 1 of 21
A&A proofs: manuscript no. 39310final
ferential rotation (e.g., Hall 1991, Lanza et al. 1993). Rotation locity (RVs) variations and one (η Aur) is identified as a slowly
drives the interaction of turbulent plasma motions and large- pulsating B (SPB) variable. This source is among the brightest
scale shearing forces in the convective envelope of cool stars and SPB stars discovered so far. As a highlight, we present a new
thus can be an important physical quantity for stellar evolution. improved spectroscopic orbit of the Capella binary system. The
By determining rotation periods throughout the Hertzsprung- targets are briefly summarized in Sect. 2 and the observations
Russell diagram (H-R diagram), we can determine stellar ages described in Sect. 3. Section 4 is our data analysis of both the
through gyrochronology (e.g., Barnes & Kim 2010) and indi- photometry and the spectroscopy, and Sect. 5 is a summary of
rectly constrain the stellar dynamo itself (e.g., Rüdiger & Holler- the results.
bach 2004, Brun & Browning 2017).
Ground-based observations of very bright stars with very
small photometric amplitudes however are a painstaking chal-
lenge, if possible at all. Among other aficionados, we had
obtained differential photometry of the V=0.1-mag α Aur =
Capella system, as well as ε Aur, both from 1996-2000. These
data were taken with one of the two 0.75 m Vienna Auto-
matic Photoelectric Telescopes (APTs) at Fairborn Observatory
in southern Arizona equipped with a photomultiplier tube, a 5
mag neutral density filter, and a narrowband Hα filter. We believe
we had detected photometric periods for both stellar components
of Capella (Strassmeier et al. 2001, and references therein). If
interpreted as rotation periods, it appeared that the brighter G8
giant has a rotation period of ≈106 days and the fainter, but more
active, early-G giant of ≈8.6 days. However, the quality and sam-
pling of the ground-based data was such that the periods had un-
certain error bars (if known at all) or could even be questioned
as artifacts; the detection of differential rotation was completely
out of reach.
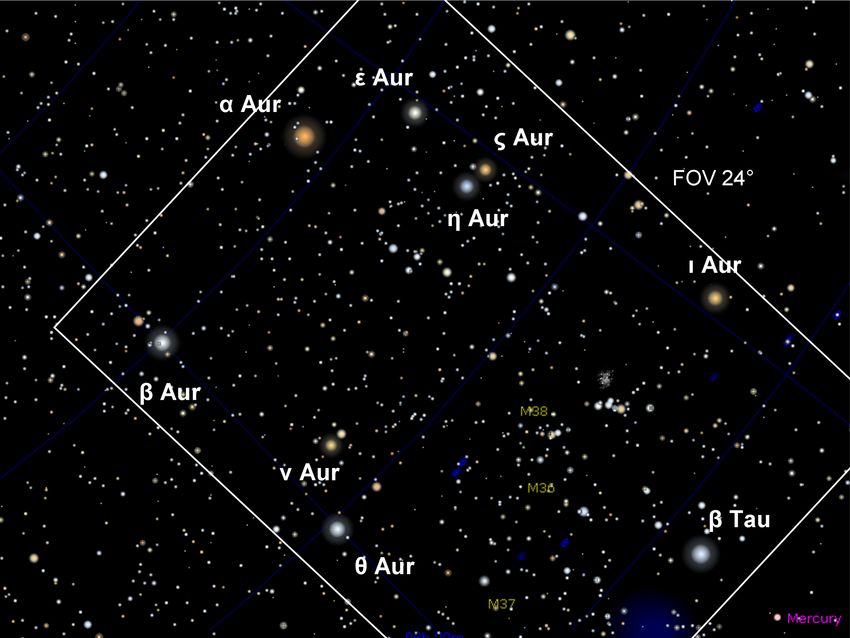
While we generally measure stellar parameters to a better Fig. 1. Auriga field as seen from BRITE. This field contains nine vari-
able stars brighter than fourth magnitude. The brightest is the active
precision when the target is brighter, this is not the case for stel-
binary Capella, but each bright star represents a distinctive variable-star
lar rotation periods. Photometric rotation periods are typically class of its own with a large variety of astrophysical challenges.
10 to 100 times more precise than spectroscopically determined
periods, but usually fail for very bright stars owing to detec-
tor saturation and nonlinearities at high photon flux and other
technical shortcomings or the simple lack of appropriate com- 2. Target sample
parison stars. Employing small aperture telescopes does not do
the trick because ground-based photometry is scintillation-noise Table 1 gives an overview of the target sample. It also lists a
limited. This is not so in space. Therefore, several space mis- CDS/Simbad entry of the number of papers that contain informa-
sions were flown in the past that had centimeter-sized telescopes tion on these stars. This and the following description are meant
on board to do bright-star photometry. Most of these were sim- as a quick orientation.
ply star trackers for bigger satellites such as HST/FGS (Zwintz α Aur. Capella is the brightest chromospherically active bi-
et al. 1999), INTEGRAL/OMC (Alfonso-Garcon et al. 2012), nary star in the sky. Its absolute properties are well known be-
or for the WIRE infrared spacecraft (Bruntt & Buzasi 2006). cause of its precise astrometric and spectroscopic orbits (e.g.,
Some of these space missions were dedicated to stellar photome- Torres et al. 2009, Weber & Strassmeier 2011, Torres et al. 2015,
try such as Coriolis/SMEI (Eyles et al. 2003) or MOST (Walker Takeda et al. 2018). It consists of two giants in a 104-day non-
et al. 2003). The most recent addition to this flock is the fleet eclipsing orbit: one star still in the Hertzsprung gap and of spec-
of five nano satellites called BRITE-Constellation (Weiss et al. tral type G0III, and the other in the clump region and of spectral
2014) launched by Canada, Austria, and Poland between 2013 type G8III. The orbital solution of this system provides the most
and 2014. precise masses for giant stars at two very specific positions in the
In this paper, we present BRITE photometry of nine very H-R diagram. Just recently, high-resolution spectroscopy revised
bright stars within the Auriga-Perseus field (BRITE ID: 20- the 12 C/13 C ratio of the primary and finally put it into agreement
AurPer-I-2016) from 2016-2017, for two stars in the Cetus- with current evolutionary tracks (Sablowski et al. 2019). Capella
Eridanus field (21-CetEri-I-2016) as well as one star at the bor- is also an interactive binary system. Shcherbakov et al. (1990)
der of Auriga and Taurus in the 31-Tau-I-2017 and 48-OriTau-II- discovered a modulation of the He i 1.08 µm equivalent width
2019 fields. For nine of these stars, we also present accompany- with the 104-day orbital period. This variation and its periodic-
ing contemporaneous high-resolution, time-series spectroscopy. ity was later confirmed by Katsova & Shcherbakov (1998). The
The basic science aim is the characterization of stellar rota- latter authors also concluded that the main He i absorption must
tion and its surface latitude dependence, but there are also three originate in the chromosphere of the quiescent cool component,
eclipsing binaries in the sample. We regret to report only a while the residual helium emission and the highly ionized iron
marginal period detection for Capella from BRITE photometry lines are thought to be connected with a magnetized wind that
as a result of the combination of a very small intrinsic ampli- originates from plages on the active hot component and forms
tude together with comparably large detector-related photomet- a shock wave in the corona of the cool component. Therefore,
ric noise. However, the time coverage and sampling for most chromospheric emission is expected from both components and
of these targets is the best ever obtained. One of the targets both components appeared photometrically variable on a milli-
(ν Aur) is likely a new spectroscopic binary from its radial ve- mag level at Hα (Strassmeier et al. 2001) .
Article number, page 2 of 21Strassmeier, Granzer, Weber et al.: BRITE and STELLA
Table 1. BRITE target list.
Name HR HD B V R I Spec. type # bib Distance Ref Target characteristic
(mag) (pc)
α Aur 1708 34029 0.88 0.08 -0.52 -0.96 G0III+G8III 1123 13.1±0.06 (1) Binary with two giant stars
β Aur 2088 40183 1.93 1.90 1.82 1.83 A1IV-Vp 396 24.87±0.14 (1) Detached eclipsing system
ε Aur 1605 31964 3.53 2.99 2.47 2.02 F0Ia 550 415±73 (2) 27-yr eclipsing system
ζ Aur 1612 32069 4.97 3.75 2.62 1.75 K4Ib+B5V 431 241±16 (1) Atmospheric eclipses
η Aur 1641 32630 3.00 3.18 3.23 3.40 B3V 352 63.1±1.9 (2) CP B star
θ Aur 2095 40312 2.54 2.62 2.62 2.68 A0VpSi 259 50.8±1.5 (1) Magnetic CP star
ν Aur 2012 39003 5.09 3.95 3.15 2.59 K0.5IIICN0.5 183 66.0±1.4 (2) Radial velocity standard
ι Aur 1577 31398 4.22 2.69 1.63 0.81 K3II-III 260 151±8 (1) Hybrid giant and susp. variable
β Tau 1791 35497 1.52 1.65 1.66 1.76 B7III 344 41.0±0.6 (1) CP HgMn star
κ1 Cet 996 20630 5.52 4.85 4.27 3.91 G5V 797 9.14±0.02 (1) Spotted BY Dra variable
V711 Tau 1099 22468 6.63 5.71 5.40 5.00 K2IV+G5IV 1110 29.63±0.07 (2) Spotted RS CVn binary
IQ Aur 1732 34452 5.20 5.37 ... ... A0p 269 145±3.5 (2) Magnetic CP star
Notes. # bib is the number of papers on this star and refers to the SAO/NASA ADS system dated 5/2019. Ref.: (1) Hipparcos (van Leeuwen 2007);
(2) Gaia-DR2 (Gaia 2018).
β Aur. This source is a detached double-lined (SB2) eclips- ADS 4566 (the B component is 4.5 mag fainter; Edwards 1976).
ing binary used to determine nonlinear limb-darkening coeffi- The surface elemental distribution of this A0p star had been
cients for both of its components based on high-precision space spatially resolved by means of Doppler imaging by several au-
photometry from the WIRE satellite (Southworth et al. 2007). thors (e.g., Rice et al. 2004, Kochukhov et al. 2019). θ Aur ex-
The system consists of two narrow-lined A1 subgiants in a 3.96 hibits 0m. 035 photometric amplitude variations with a period of
d orbit. The previously best spectroscopic orbital solution is still 3.6188 d in phase with effective magnetic field measurements
that from Smith (1948). (Adelman 1997). The light minima are broad and require the
ε Aur. This source is a single-lined (SB1) spectroscopic and contributions of at least two surface features. The most recent
eclipsing binary system with a two-year-long eclipse every 27.1 and precise period determination is from a combination of pho-
yr (e.g., Stefanik et al. 2010). The system is unique in many tometric and spectroscopic tracers (3.61866±0.00001 d; Krticka
respects. It is among the brightest eclipsing binaries in the sky et al. 2015).
and has one of the longest orbital periods known among any of ν Aur. Numerous photometric observations of this star ex-
the eclipsing binaries. It is composed of a semi-regular pulsating ist but were mostly taken in the context of standard-star all-sky
F0 Iab supergiant in orbit with a massive upper main-sequence photometry (e.g., Oja 1985, Eggen 1963). Adelman (2001) listed
star that is enshrouded in a dusty disk and not directly seen. The it among the least variable stars in the Hipparcos catalog with a
recent eclipse took place in 2009-2011 and a suite of modern in- standard deviation of only 0.5 mmag from 69 visits. The Aitken
strumentation was pointed to this star (see, e.g., Griffin & Sten- Double Star catalog lists this source as the brighter component
cel 2013, Strassmeier et al. 2014). Interferometric imaging with of a wide binary. Beavers & Eitter (1986) obtained a series of
the CHARA array resolved the opaque dusty disk as it passed in RVs and found ν Aur to be constant with a standard deviation
front of the F0 star during the eclipse (Kloppenborg et al. 2010). of 1.1 km s−1 from 24 measures and suggested that this star is
The light curve is dominated by the pulsations of the supergiant. effectively a single star.
ζ Aur. This source is also a long-period SB1 eclipsing binary ι Aur. This star was suspected for variability by Guthnick &
with a K supergiant and a mid-B main-sequence star. An orbit Prager (1914) and Simbad/CDS titles it a variable star, yet Adel-
was determined by Griffin (2005) with a period of 972 days and man (2001) listed it among the least variable stars in the Hip-
confirmed by Eaton et al. (2008). Of note are the eclipses of the B parcos catalog with a 1.4 mmag root mean square (rms) from 39
star when it shines from behind the chromosphere of the K star, visits. Its entry came from the NSV catalog (Kazarovets et al.
events which last for some days either side of the eclipse. The B 1988). The star is a single K3 bright giant, which is also called
star has been used to probe the atmosphere of the K supergiant a hybrid giant because of its location in the H-R diagram. From
as a function of height above the limb. Griffin (2005) also noted the RV monitoring program at Lick Observatory, Hekker et al.
that the rotation period of the K supergiant appears to be close to (2008) reported periods of 767 d and 1586 d. Lébre et al. (2006)
the orbital period. We note that this binary has two HD numbers determined its lithium abundance and gave a summary of its ro-
(HD 32068, HD 32069). tational properties.
η Aur. This source is a chemically peculiar (CP) B3 main- β Tau. This source is also named γ Aur. No continuous pho-
sequence star. It appears to be a single star from its constant RVs. tometry of this very bright star seems to exist. However, it has
Crawford et al. (1971) lists this star as one of their photometric received substantial attention after it was listed among the few
standard stars, while Simbad lists it as a suspected variable based mercury-manganese stars by Adelman et al. (2006).
on Guthnick & Pavel (1922) and its entry in the NSV catalog κ1 Cet. This source is a single solar-like star with a spotted
(Kazarovets et al. 1988). photosphere and an active chromosphere. Its light variability is
θ Aur. This source is a well-known, chemically peculiar rotationally modulated with an average ≈9 d period. Rucinski
A0p star and the brighter member of the close visual binary et al. (2004) and Walker et al. (2007) were able to determine
Article number, page 3 of 21A&A proofs: manuscript no. 39310final
its differential surface rotation from the period range observed achieve fine pointing. An eclipse-like event appeared for all stars
by MOST. These authors had isolated the photometric signa- at TJD 1662.166 with strong variations starting around TJD 1660
tures from individual spots and obtained rotation periods from and continued until TJD 1680. The overall photometric precision
8.7 d to more than 9.3 d. Spectroscopic observations of the chro- was below expectation owing to a continuous satellite drift and
mospheric Ca ii K-line emission by Shkolnik et al. (2003) were we decided not to use most of the BLb data. Three setups with
modulated with a period of about 9.3 d. BHr were used (BHr photometry is red sensitive as BTr) and all
V711 Tau = HR 1099. This source is one of the most active three appeared appropriate.
and most well-studied RS CVn binaries. It consists of two sub- Because of the problems with high dark current introduced
giants in a close two-day orbit with a double-lined spectrum. The by the proton radiation (Popowicz 2018), a chopping mode of
K1 component is the active star and more rapidly rotating, the observing was introduced. No bias, dark, and background cor-
G5-component comparably inactive with narrow spectral lines. rections are necessary to do differential photometry. The main re-
The light variations are attributed to the rapidly rotating and maining data-reduction step is the definition of the optimal aper-
heavily spotted K star (see, e.g., Vogt et al. 1999, Strassmeier & tures and extraction of the flux within these apertures (Popow-
Bartus 2000). It is one of the faintest stars observed by BRITE. icz et al. 2017). The data resulting from this pipeline reduction
IQ Aur = HR 1732. This star is among the hottest known were provided by the BRITE consortium, which eliminated on
Ap Si star (Bohlender et al. 1993). IQ Aur was discovered to average 30% of the raw data. Further details about the detector
be an X-ray emitter and explained by a magnetically confined and data acquisition of BRITE Constellation are described by
wind-shock model (Babel & Montmerle 1997). Its period of Pablo et al. (2016). The CCD temperature variations shown in
2.466 d is the rotation period of the star and was initially ob- Fig. 2 and other instrumental effects were described by Pigulski
tained from spectroscopic observations by Deutsch (1947) and et al. (2018a) and were removed with the de-correlation tech-
confirmed by many others in the meantime. Rakos (1962) ob- nique presented in detail in the BRITE Cookbook 2.0 (Pigul-
tained the same period from intermediate-band photometric ob- ski et al. 2018b). We note that we co-added all CCD frames
servations, which was again confirmed later by Pyper & Adel- per orbit (orbital binning) to increase the photometric precision.
man (1985) among others. However, the photometric amplitude An average error bar for the binned Capella data from BTr was
never exceeded 0m. 02 and thus the periods from photometry re- 0.4 mmag.
main utterly uncertain.
3. Observations
3.1. BRITE photometry
Observations of the Aur-Per field (Fig. 1) took place from
September 9, 2016 to March 9, 2017. Two of the five satellites
were used: BRITE-Toronto (BTr) for red light and the full time
of 176 days, and BRITE-Lem (BLb) for blue light but only for
the first 35 days and the last 27 days. The two targets in the Cet-
Eri field (κ1 Cet and V711 Tau) were observed with just a single
satellite (BRITE-Heweliusz; BHr) in the red and for 90 days be-
tween JD 2,457,668 and 2,457,757. One satellite orbit is approx-
imately 99 minutes and observations were made for periods of
5-10 minutes per orbit when the field was visible. The BRITE
telescopes have 3 cm apertures recording “red” images at 550-
700 nm and “blue” images at 390-460 nm. The filters are similar
to the Geneva B and Sloan r filters. The field of view of the satel-
lites is 24◦ ×20◦ . Pixel sampling on their Kodak KAI-11002M
CCDs is 2700 /pixel.
Fig. 2. CCD temperature in degree Celsius on board BRITE-Toronto
The BRITE data are obtained in different satellite config- (red points; BTr) and BRITE-Lem (black points; BLb) during the ob-
urations, which are numbered consecutively (e.g., BTr1, BTr2 serving period of Capella in 2016/17.
a.s.o.). The BTr observations were conducted with two types
of setups: one for the brightest stars to avoid saturation and the
other setup for the fainter objects to enhance the signal to noise.
The measurements were made with 0.2 s and 3 s exposures for 3.2. STELLA spectroscopy
the two types of setups, respectively. Some stars appear in both
short and long exposure time setups. Severe issues with the sta- All but three (β Tau, ζ Aur, and IQ Aur) of our BRITE targets
bility of BTr pointing caused many outliers for the whole time were monitored contemporaneously from the ground using the
range except for the start (first ten orbits) and the end (after robotic 1.2 m STELLA-I telescope at the Izanã Observatory on
TJD1 1665.6). Orbits between TJD 1665.9-1667.6 and 1665.3- Tenerife (Strassmeier et al. 2010). The fiber-fed Echelle Spec-
1665.6 were rejected. Also, in the 20-Aur-Per field, the Moon trograph (SES) of STELLA with an e2v 2k×2k CCD detector
got close enough for at least one part of the field and caused was used to cover the wavelength range from 390–880 nm at a
≈28 d regular increases of the background. These appear as pe- resolving power of R=55,000 (3-pixel sampling) corresponding
riodic broad bumps in the raw light curves. The BLb experi- to a spectral resolution of 0.12 Å at 650 nm. A recent observa-
enced a large data gap (TJD 1692-1789) due to its inability to tory and instrument status report is given by Weber et al. (2012).
The SES spectra were automatically reduced using the IRAF-
1
Truncated Julian date: TJD = HJD – 2,456,000.0. based STELLA data-reduction pipeline (Weber et al. 2008). The
Article number, page 4 of 21Strassmeier, Granzer, Weber et al.: BRITE and STELLA
Table 2. STELLA observing log and results.
Name Time range NSpec texp S/N hRVi T eff log g v sin i [M/H]
(ddmmyy) (s) range (km s−1 ) (K) (cgs) (km s−1 ) (solar)
α Aur1 ongoing ... 8 220-700 SB2 5150 1.7 4.5 –0.55
β Aur2 260516-020417 127 60 120-510 SB2 ... ... 29.3±1.3 ...
ε Aur ongoing ... 120 100-360 –3 var 7600±110 0.0±0.3 32±4 0.0±0.4
η Aur 110416-010417 109 60 80-270 10.2 var ... ... 66±14 ...
θ Aur 040916-300317 163 250 110-680 30.5 var ... ... 54.6±1.0 ...
ν Aur 130916-020417 103 60 80-220 13.0 var 4610±50 2.2±0.1 2.7±0.2 –0.12±0.03
ι Aur 080416-010417 104 60 100-400 18.1 var 4130±60 1.25±0.3 5.5±1.0 –0.20±0.03
κ1 Cet 091216-180217 28 1800 200-670 18.95±0.03 5664±13 4.46±0.02 4.6±0.2 –0.12±0.03
V711 Tau1 091216-030417 116 1800 100-480 SB2 4420 var 2.5±0.7 45.0±1.0 –0.66±0.33
Notes. hRVi are mean values. Time range is in standard UT time. “Ongoing” means that the target is continued to be observed whenever possible.
The notation var indicates that the value is systematically changing. Error bars are rms. S/N is given per pixel; 1 for the primary; 2 same value for
both components.
Table 3. Photometric periods from BRITE.
Name Satellite rmsall P ∆P FAP Amp T0 rmsfit
(mmag) (d) (d) (-) (mmag) (TJD) (mmag)
α Aur BTr 1.02 4.38 0.11 0.014 0.36 1813.1686 1.01
BLb 0.96 10.1018 0.57 0.0001 0.89 1803.9445 0.90
β Aur BTr 18.06 3.9601 0.0001A&A proofs: manuscript no. 39310final
new orbit employing ≈9600 spectra over 12.9 consecutive years. Defaÿ et al. (2001), was also deemed inappropriate for our type
For ε Aur, we combined all existing STELLA and literature RVs of data.
(≈3000) for a new spectroscopic orbit. For all stars, frequencies were searched at an equidistant
sampling starting at fmin = 0.01 c d−1 and extending to fmax =
10 c d−1 , such that 105 frequencies were scanned. A false-alarm
4. Data analysis probability (FAP) according to Zechmeister & Kürster (2009)
4.1. BRITE data preparation was calculated for all peaks in the LS version (but see Baluev
2008 for an enlightening discussion on FAPs). Significance lev-
The pipeline data from BRITE must be corrected for the pres- els for the PDM periods as in Stellingwerf (1978) were as-
ence of moonlight as well as for the many systematic outliers signed. The PDM results, and to a lesser extend also the GLS
due to telescope pointing errors and long-term CCD sensitivity results, were contaminated with aliases of the orbital period of
changes due to temperature variations. Data phases with moon- the BRITE satellites (at f0 ≈ 14.5 c d−1 ). These peaks were ig-
light contamination were simply excluded from the analysis but nored. For stars with significant periods, GLS and PDM were
only amount to 1-2 days every 28 days. Pointing jitter is seen in combined to reach a single, most probable period. This period
the data as random outliers that were removed with the GESD al- was then used in the phase plots and is listed in Table 3. Errors
gorithm (see Pigulski et al. 2018b). The correction of a long-term of the periods were estimated by generating synthetic data sets
trend due to CCD temperature changes (and/or charge transfer on all stars. Each synthetic data set had magnitude values with a
efficiency changes) is the most severe impact and was removed random, Gaussian-distributed offset according to the error of the
in first order using a one-dimensional linear as well as a two- magnitude as initially estimated. A period search in a small re-
dimensional de-correlation of flux values. The procedure was gion around the detected period was then performed using GLS.
basically the same as in Pigulski et al. (2018a, 2018b) and simi- The standard deviation of the periods found was used as the error
lar to that described by Kallinger et al. (2019). The final data are of the actual best period and is given in Table 3.
further referred to as the de-correlated data. Figure 2 shows the
run of the average CCD temperature of BTr and BLb during the
epoch of our Capella observations. Its double-peaked curve with 4.3. Detailed BRITE results
a peak separation of ≈100 d is unfortunately of nearly identical α Aur = Capella. Figure 3a shows the BRITE Capella light
duration as the orbital period of Capella and the (synchronized) curves. Only the red-filter data (two setups of BTr observations)
rotation period of its cooler component (both ≈104 d). This pre- have the long and continuous 176 d coverage. The BTr3 setup
vents a conclusive analysis of low-amplitude variability of simi- had to be split into three pieces owing to some small instrumen-
lar timescale. tal effects that were not the same in all data parts. BLb blue data
Photometric zero points of each BRITE satellite instrumen- were mostly rejected but covered approximately 10 days at the
tal setup were determined and adjusted before they were sub- beginning of the BTr observations and 30 days at the end. Much
jected to the period search. We took the average brightness of to our surprise, and disappointment, the 176 d long red light
each setup and shifted all setups to match the first one. For cases curve of Capella did not show any significant variability. The
with a clear brightness gradient within the setup only the start light curve is basically constant to within ≈1 mmag. A PDM and
and end points were used. The individual shifts in magnitudes a GLS periodogram of the red data both show a 4.38 d period
are identified in the insert of the respective light-curve plots (e.g., with a FAP of 10−2 (Fig. 3b). A least-squares fit suggests a full
in Fig. 3a). amplitude of just 0.36±0.09 mmag. For the G0 component we
expect a rotation period of ≈8.6 d from v sin i and the stellar ra-
4.2. Period determinations from BRITE data dius, which is almost exactly twice as long as this weak signal.
We applied a forced fit with 2×4.38 = 8.76 d, which then resulted
Period searches include, in almost any case, the choice of a (peri- in a comparable best-fit amplitude of 0.33 mmag, still well below
odic) data model and the least-squares fit of the light curve to the the long-term rms level. We do not claim this period to be real
underlying model. This model is chosen to help in the extraction but take it as evidence that the ≈8.6 d period from ground-based
of features the light curve is expected to show. For example, for Hα monitoring of Capella is at least not contradicted by the red-
exoplanet transit searches the expected signal is box shaped, and filter data. On the contrary, the blue BLb light curve showed a
consequentially the method of Kovács et al. (2002) tries to fit a slightly longer period of 10.1±0.6 d with a larger amplitude of
box-shaped transit signal to the light curve. The Lomb-Scargle 0.90 mmag (Fig. 3c,d). If we phase the red data with this 10.1 d
(LS) periodogram (Lomb 1976, Scargle 1982) as a variant of a period the amplitude is a mere 0.26 mmag (Fig. 3c). Because the
Fourier transformation is the least-squares fitting of a harmonic blue BRITE data (from BLb) are dominated by the hotter of the
(sinusoidal) function to the light curve. A seemingly model-free two Capella components, that is the G0 star, the red data (from
method like phase dispersion minimization (PDM; Stellingw- BTr) are more dominated by the cooler G8 component and we
erf 1978) can be seen as the least-squares fit of a piece-wise thus should see the G0-star rotation period better in the blue data
constant function to the (phase-folded) light curve, rendering the than in the red. We conclude that the 10.1 d period is our only
PDM method similar to the analysis of χ2 reduction in methods real period detection in the Capella data. We see no evidence
fitting data models. for the 106±3 d rotation period of the cooler G8 component as
For the period determinations in this paper, we used PDM claimed by Strassmeier et al. (2001) from Hα, but see Sect. 4.1.
in the original formulation of Stellingwerf (1978) and comple- β Aur. This target was also observed for 176 days by BTr
ment it with the GLS periodogram as formulated by Zechmeis- with only a single 10 d gap around TJD 1770 (Fig. 4a). The BLb
ter & Kürster (2009). Other variants of PDM, such as the string- observed the target for approximately 30 days at the beginning
length maximization method of Dworetsky (1983) or the binless and again 30 days at the end of the BTr coverage. The eclipse
method of Plavchan et al. (2008), did not improve the period data points in both filters reach a maximum depth of 80 mmag
detection from our data and were thus not followed further. A with respect to the average out-of-eclipse light. As for the red
multicomponent variant of the LS periodogram, as described by Capella data, the strongest peak in both periodograms is at one-
Article number, page 6 of 21Strassmeier, Granzer, Weber et al.: BRITE and STELLA
a. b.
c. d.
Fig. 3. BRITE photometry of Capella. Panel a) Full data set. The top light curve is the red BTr data (red dots); the bottom light curve is the blue
BLb data (blue dots). The insert identifies the magnitude shifts applied to each individual CCD setup per satellite. Panel b) Periodograms of the
red data. The top (blue) line is from the PDM given in units of its normalized variance; the bottom (black) line is the generalized LS (GLS) given
in units of 1 − χ2 /χ20 . The vertical dashed lines are the periods identified (see text). Panel c) Periodograms of the blue data, otherwise as in panel b.
Panel d) Phase plots for the red data (red dots, top curve) and blue data (blue dots, bottom curve) with the best-fit 10.10 d period. Phases outside
±0.5 are just repeated.
half the true period (Fig. 4b), in the case of β Aur this value is back to the previous brightness at TJD 1760, that is another 45
very close to 2.0 days. This is easily identified for the eclips- days later. Both periodograms in Fig. 5b suggest a 74.25 d vari-
ing binary β Aur because its orbital period is known from RVs ability but can not exclude longer harmonics due to the limited
as well and is very close to 4.0 days (3.96 d). Both of our peri- length of the data set. However, if we allow for a multi-harmonic
odograms identify the true period as the second strongest peak. fit with a total of three periods based on P0 = 152.66 d, that is
Figure 4c is a phase plot with the 3.96 d (orbital) period from the 152.66, 152.66/2, and 152.66/3 d, we arrive at the best overall fit
BRITE data. We note that the BRITE data could be used to refine of the light curve as shown in Fig. 5c. Similar fits with a period
the nonlinear component of the limb-darkening laws of the two of 74.25 d do not match the light curve at all, while a multi-
stars. Southworth et al. (2007) had employed the integral-light harmonic fit with a fundamental period of 204.89 d also matches
WIRE data and the eclipsing light-curve modeling code EBOP the light curve reasonably well (see Fig. 5c). We note that the
to infer nonlinear coefficients, which then led to an increase of fits worsen for multi-harmonics with n > 3 simply because of
the measured stellar radii by 0.4%. the limited length of the data set. Any individual frequency up
to 15 f0 could not alone fit the light curve. Therefore, we suggest
ε Aur. All BTr setups are relatively good quality. The blue- that the period of 152.66 d is likely the true fundamental pulsa-
filter BLb observations are checkered; BLb1 duration was short tion period of this F0 supergiant.
and was rejected, BLb3 was affected by instrumental effects and
was partly rejected. BLb4 was fine but data appear scattered with ζ Aur. As for β Aur, this target was observed for 176 days
respect to BTr. Figure 5a shows the full data set. The red-filter by BTr with only a single 10 d gap around TJD 1770 (Fig. 6a).
data show a pronounced brightness increase of 125 mmag be- In addition, BLb monitored the target for ≈30 days at the be-
tween TJD 1680 and 1715, that is within 35 days, and a decrease ginning and ≈15 days close to the end of the BTr coverage.
Article number, page 7 of 21A&A proofs: manuscript no. 39310final a. b. c. Fig. 4. Photometry of β Aur from BRITE. Panel a) Full data set. Panel b) Periodograms. Panel c) Phased light curve with the orbital period. Otherwise as in Fig. 3. a. b. c. Fig. 5. Photometry of ε Aur from BRITE. Panel a) Full data sample. Panel b) Periodograms. Panel c) Multi-harmonic fits with fundamental periods of 74.25, 152.66, and 204.89 d, respectively (colored full lines identified in the inset). The 152 d and 205 d fits are nearly equally good and mostly overlay in the plot; a 74 d fundamental period does not fit at all. The bottom panel shows the residuals from these fits. Otherwise as in Fig. 3. a. b. c. Fig. 6. Photometry of ζ Aur from BRITE. Panel a) Full data sample. Panel b) Periodograms. Panel c) Phased light curve with the 70 d period. Otherwise as in Fig. 3. The earlier of these two BLb data sets had rather large scatter dimming in the BRITE red bandpass was ≈0.4 mag. However, and was discarded. The scatter of the latter set was three times our light curve consisted of two different slopes at that time; smaller, but was still approximately three times larger than the initially a shallower one related to the apparent change of the contemporaneous BTr red-filter data. The red BTr light curve ellipsoidal shape of the K giant, and a steeper one starting at exhibits semi-regular variability with up to 0.1 mag without a TJD 1809, which is the actual eclipse ingress. The eclipse full clear and convincing periodicity within our time coverage. Both depth amounts to 0.14 mag, which compares to the 0.15 mag of a periodograms (Fig. 6b) converged on a best-fit period of 70 d previous eclipse covered in V on the ground by Eaton et al. 2008. that stem from the two dips that were covered. This is clearly Precise eclipse timings of ζ Aur are rare because of the length of seen in the phased light curve in Fig. 6c. The 70 d period may the totality of around 37 d and the long orbital period of 972 d. be reminiscent of the proposed tidal-induced, nonradial pulsa- Griffin 2005 noted that times of mid-eclipse had slipped over the tions of the ellipsoidal supergiant (Eaton et al. 2008). By the end past decades with respect to the spectroscopic orbital period and of our time coverage we caught the ingress of an atmospheric suggested that accurate eclipse timings could solve the discrep- eclipse of the B star (but unfortunately not the egress). The total ancy. Griffin’s spectroscopic ephemeris predict times of conjunc- Article number, page 8 of 21
Strassmeier, Granzer, Weber et al.: BRITE and STELLA

a.                                                 b.                                                 c.

Fig. 7. Photometry of η Aur from BRITE. Panel a) Full data sample. Panel b) Periodograms. The period axis is split into two parts for the ranges
0–2.8 d and- 5–8 d. The main peak is at a period at 1.28 d, while other significant peaks are seen at 1.23 d and 6.6 d. Panel c) Phased light curve
with the 1.28 d period. Otherwise as in Fig. 3.

a.                                                 b.                                                 c.

Fig. 8. Photometry of θ Aur from BRITE. Panel a) Full data sample. Panel b) Periodograms. Panel c) Phased light curve with the dominant 3.6189
d period. Otherwise as in Fig. 3.

a.                                                 b.                                                 c.

Fig. 9. Photometry of ν Aur from BRITE. Panel a) Full data sample, only BTr data were acquired. The line is a quadratic polynomial fit that was
then removed from the data for the periodograms. Panel b) Periodograms. Panel c) Phased light curve with the 19.16 d period. Otherwise as in
Fig. 3.

tions at MJD 2, 445, 191.90 + 972.164(±0.041) × n, suggesting a            odograms in Fig. 7b recover a dominating period of 1.28 d from
mid-eclipse time for n = 13 at 2,457,830.032 in agreement with             red and blue data independently. A least-squares fit based on this
our observations. Although our data do not cover the full total-           period alone suggests amplitudes of around 10 mmag, where the
ity, they still allow a reasonable determination of the onset of the       blue light curve exhibits a marginally larger amplitude than the
eclipse at 2,457,810.0±0.4.                                                red curve and is also indicative of containing more than one pe-
     η Aur. While red-filter (BTr) data are of good quality, the           riod. This is also seen in both periodograms with additional well-
blue-filter (BLb) data are scarce and the first part is affected by        defined periods of 1.23 d and 6.6 d.
jumps with one-day intervals that we do not understand (espe-                  We therefore performed a more detailed period search with
cially in the BLb3 setup). Therefore, blue-filter data from BLb            the software Period04 (Lenz & Breger 2005), involving multi-
before the gap around TJD 1770 were discarded. Its earlier data            frequency fitting and pre-whitening techniques. This search was
were rather noisy and were not used in the analysis either. The            carried out on the BTr data only, as the useful BLb data have a
rms of the entire BTr light curve is comparably large and indi-            time base that is too short to resolve the individual signals. We
cates unresolved low-amplitude variability (Fig. 7a). Both peri-           detected a total of six periods at a significant level (amplitude
                                                                                                                     Article number, page 9 of 21
A&A proofs: manuscript no. 39310final
a. b. c.
Fig. 10. Photometry of ι Aur from BRITE. Panel a) Full data sample. The line in the BTr data (top) is a harmonic fit to remove the trend for the
periodogram analysis. Panel b) Periodograms. Panel c) Phased light curve with the dominant 9.07 d period. Otherwise as in Fig. 3.
a. b. c.
Fig. 11. Photometry of β Tau from BRITE. Panel a) Full data sample for the two visits in 2017 (left) and 2019 (right). Panel b) Periodograms.
Panel c) Phased light curve with the 2.74 d period. Otherwise as in Fig. 3.
a. b. c.
Fig. 12. Photometry of κ1 Cet from BRITE. Panel a) Full data sample from BHr. Panel b) Periodograms. Panel c) Phased light curve with the
dominant 9.065 d period. Otherwise as in Fig. 3.
S/N>4 in the periodogram; Breger et al. 1993), and conjecture Both red-filter (BTr) and blue-filter (BLb) data show continu-
that the longer 6.6 d period corresponds to a combination fre- ous modulation with a peak-to-peak amplitude of 34 mmag and a
quency difference. The results of the analysis are listed in Ta- clear periodicity of 3.6189±0.0001 d (Fig. 8b). The phased light
ble 4 and clearly indicate that η Aur is a newly discovered SPB curves in Fig. 8c reveal significant deviations from a pure sinu-
star, and hence one of the three brightest representatives of its soidal shape, but are indicative of the (known) asymmetric dis-
kind (the others are κ Cen and κ Vel; Daszynska-Daszkiewicz et tribution of its surface chemical elements.
al. 2017).
ν Aur. There are four setups of BTr data and no BLb data.
θ Aur. Figure 8a shows the full light curve with its impres- Setup BTr7 was split into two subsets because of a 3 mmag jump
sive variability. The BTr data are good, BLb data are also good in the middle of the run at TJD 1785, which could not be de-
but scarce and of lower quality than the BTr data. The data set correlated. The data are otherwise of reasonable quality. The BTr
BLb1 was rejected because of its very short duration. The BTr observed for the full ≈176 d time span, starting from TJD 1645
observed for 176 days starting TJD 1645 until 1823 with only until 1823 with only the single 10 d gap around TJD 1770. These
a single 10 d gap around TJD 1770. The BLb pointed to this data are shown in Fig. 9a. The long-term trend with an amplitude
field for two short epochs at TJD 1655–1690 and 1792–1820. range of ≈10 mmag is obvious but the 176-d observing window
Article number, page 10 of 21Strassmeier, Granzer, Weber et al.: BRITE and STELLA
a. b. c.
Fig. 13. Photometry of V711 Tau from BRITE. Panel a) Full data sample from BHr. Panel b) Periodograms. Panel c) Phased light curve with the
2.836 d period. Otherwise as in Fig. 3.
a. b. c.
Fig. 14. Photometry of IQ Aur from BRITE . Panel a) Full data sample from BTr. Panel b) Periodograms. Panel c) Phased light curve with the 2.46
d period. Otherwise as in Fig. 3.
Table 4. Signals detected in the BTr photometry of η Aur. setup than for the other setups (0.15 s in comparison to 3 s). Ex-
posure times were then re-optimized for the brightest stars in the
ID Frequency Period Amplitude S/N field; this is visible in the second half of the light curve of ι Aur
(d−1 ) (d) (mmag) (Fig. 10a). Data from both satellite show variability on several
timescales. A long-term trend is obvious in the BTr data but, in
f1 0.7753(1) 1.2900(1) 3.6(1) 15.8 contrast to ν Aur, shows a minimum and a maximum in the light
f2 0.8034(2) 1.2447(3) 1.7(1) 7.8 curve. However, the 176 d observing window is still too short to
f3 0.6842(3) 1.4615(5) 1.3(1) 5.6 call the trend periodic, although it can be fitted with a period of
f4 0.5932(2) 1.6858(7) 1.4(1) 5.9 432 d plus its first harmonic. Because this period is too specula-
f5 0.4403(2) 2.2711(12) 1.5(1) 6.0 tive, we decided to just fit a quadratic polynomial and then re-
f6 0.8105(2) 1.2338(4) 1.4(1) 6.4 move the trend for the period analysis. The periodograms on the
f5–f4 0.1529 6.543 2.3(1) 9.0 residuals are shown in Fig. 10b. Both algorithms detect a clear
9.071±0.002 d period from the red BTr data but not from the
Notes. Values in parentheses are the errors expressed in last digit num- blue BLb data. Its length is far too short for a rotation period for
bers. The last line represents frequency f5 minus f4. an inactive hybrid K3 bright giant. The full amplitude is 4 mmag
and is likely attributable to complex semi-regular variability.
β Tau = γ Aur. This star was not part of the original Auriga
is still too small to cover a full cycle. We fitted a quadratic poly- field as shown in Fig. 1, but was observed later in field 31-Tau-I
nomial and removed the trend. The residuals were then subjected in 2017 and in field 48-OriTau-II in 2019. Its data come mostly
to the same periodogram analysis as for the other stars and are from BLb with setups 1–4 (Fig. 11a). The BTr observations in
shown in Fig. 9b. Both algorithms converged on a 19.16±0.08 d these fields were too short and/or had an integration time that
period with a full amplitude from a least-squares fit of 1.8 mmag was too short and were not useable. Photometric variability, if
(Fig. 9c). However, this is not significant given the overall rms present at all, is not seen easily, at least not in the light curves.
of 2.7 mmag, and is not seen in the STELLA RV data either. Nevertheless, the GLS periodogram showed a significant period
ι Aur. The BLb had the same instrumental problems that at 2.737 d while the PDM did not (Fig. 11b). We note that the
were experienced for other stars. The BLb1 setup was too short two BLb data sets from 2017 and 2019 were treated separately
and was rejected. Only parts of the BLb3 and BLb4 data were but gave identical periods within their errors (c/o Table 3). The
used because of poor quality (large scatter). The first setup on phased light curve in Fig. 11c from a least-squares fit gave a full
BTr1 was also too short and was rejected, only setups BTr2, 4, amplitude of only 0.54 mmag. While very uncertain, we still take
5, and 7 were used. The BTr3 data were of lower quality at the it as evidence for the rotation period of this chemically peculiar
beginning because the exposure time was much shorter for this B7 giant.
Article number, page 11 of 21A&A proofs: manuscript no. 39310final
κ1 Cet. The BHr coverage was 90 days with two gaps of 4.5. Stellar parameters
one week around TJD 1680 and TJD 1750 (Fig. 12a). A max-
imum peak-to-peak amplitude of 25 mmag was seen around We selected five spectral orders from the STELLA/SES spectra
TJD 1730 but otherwise the light curve remained double-peaked covering the range 549–623 nm and used these spectral orders to
with a time-averaged amplitude of around 10 mmag. Both pe- determine the stellar effective temperature, gravity, metallicity,
riodograms (Fig. 12b) show a dominant period at 9.065 d (its and microturbulence. We applied the program ParSES (PARam-
harmonic at 4.5 d is the second strongest period). If phased with eters from SES), which is based on the synthetic spectrum fit-
this 9 d period (Fig. 12c) the intrinsic time-dependent light-curve ting procedure laid out by Allende-Prieto et al. (2006). Model at-
variations due to spot changes or redistribution mimic increased mospheres and synthetic spectra were taken from the ATLAS-9
scatter. CD (Kurucz 1993). Synthetic spectra are pre-tabulated for large
parameter ranges for a wavelength range of 380-920 nm. All
atmospheric calculations were done with a microturbulence of
V711 Tau. As for κ1 Cet, only data from BHr are available. 2 km s−1 . This grid was then used to compare with the five se-
Its coverage is also ≈90 days with two gaps of one week around lected echelle orders of each target spectrum. Table 2 includes
TJD 1680 and 1750 (Fig. 13a). The full amplitude decreased the results. We note that our limited model grid excludes the ap-
from ≈100 mmag at the beginning to ≈70 mmag at the end of plicability of ParSES to stars with effective temperatures higher
the time series. The rotation period of V711 Tau has been well than 8000 K.
known for many decades and is synchronized to the orbital mo-
Precise astrophysical parameters of giant stars are uncertain
tion of this close binary. Our periodograms in Fig. 13b confirm
because there are just a few such stars that can be studied in
this period and specify it to 2.8359±0.0003 d. The phase curve in
spectroscopic binary systems and even fewer are also eclipsing
Fig. 13c is just for orientation because the spot-induced changes
binaries. Roche lobe overflow and mass exchange usually set a
in the light curve are a function of time and alter the amplitude
limit to the stellar radius in a close binary. Non-interacting bi-
as well as the shape of the light curve.
naries with giant components therefore mostly have very long
orbital periods and are difficult to observe within the lifetime of
IQ Aur. The BRITE coverage was only with BTr within a an astronomer. There are, however, a few systems that have suf-
single setup and thus comparably short, just 25 d in total from ficiently short orbital periods (for a summary see, e.g., Andersen
TJD 1672 to 1697 (Fig. 14a). Nevertheless, it covered ten cy- 1991). Capella is such a system and consists of an active G0 III
cles of the previously determined period. Our two periodograms and a G8 III component in a relatively short 104 day orbit.
in Fig. 14b confirm this period and specify it to 2.463±0.009 d.
The phase curve with this period is shown in Fig. 14c with an
average amplitude in the (red-sensitive) BTr data of 20 mmag. 4.6. Detailed STELLA results
The light curve has two maxima and two minima just like the
All but one star in our STELLA sample showed variable RVs.
magnetic-field curve from Zeeman-sensitive spectral lines. This
Only κ1 Cet exhibits a constant velocity with a rms close to the
had been explained (Bohlender et al. 1993) as the two extremes
expected external RV rms of ≈30 m s−1 (Strassmeier et al. 2012).
of the magnetic field density and the two central-meridian pas-
Four of the RV-variable stars were already known spectroscopic
sages of the magnetic equator because of the tilt between the
binaries (α Aur, β Aur, ε Aur, and V711 Tau), three of which are
rotational and magnetic axes.
SB2. Our data for these stars add to the pool of long-term veloc-
ities, in particular for ε Aur with its 27 yr orbital period.
α Aur = Capella. For our prime target, we used all our new
4.4. Radial velocities and orbits from STELLA data and previously published STELLA RVs for a re-computation of
its orbital elements, in particular for the difficult secondary star
(dubbed the B component) with its large rotational broadening.
Radial velocities from the STELLA spectra were determined The final orbital solution is presented in Table 5 and shown in
from an order-by-order cross correlation with a synthetic tem- Fig. 15 versus phase, and in the Appendix in Fig. A.1 versus
plate spectrum (models from ATLAS-9; Kurucz 1993). Sixty HJD. This solution shows excellent agreement with the updated
out of the 82 echelle orders were used for the cross correlation combined orbit by Torres et al. (2015), which included an earlier
and gave one relative velocity per echelle order. These veloc- subset of our STELLA data. For our present solution, a total of
ities were then weighted according to the spectral region and ≈9600 RVs per binary component over a time span of 12.9 years
averaged. Its rms defines our internal error (≈6 m s−1 ). The ex- are available compared to 430 used by Weber & Strassmeier
ternal rms values are naturally significantly larger and strongly (2011). This long time coverage allows us to refine the orbital
depend on spectral type, line broadening, and blending. All RVs period just based on this homogeneous and high-precision data
in this paper are barycentric. Table 2 lists relevant measurement set alone. Our revised orbital period of 104.021572±0.000056 d
results: the time range of the STELLA coverage, the number is 25 s longer than that derived by Torres et al. (2015) from
of spectra obtained (Nspec ), their lowest and highest signal-to- data spread over a hundred years including the original Weber &
noise ratio (S/N), and the average RV and its standard devia- Strassmeier (2011) STELLA data. The new period is well within
tion. The known SBs are indicated with either SB1 when single- the Torres et al. (2015) 3σ limit, but more precise by almost a
lined or SB2 when double-lined. If the standard deviation was factor of three.
greater than three times the expected minimum external rms of Deriving an orbit from such a huge data set requires knowing
30 m s−1 , then the velocity is marked variable (var). We solved and mitigating the systematic errors. For extracting the STELLA
for the usual elements of a double-lined spectroscopic binary RVs, we applied the same two-dimensional cross-correlation
using the general least-squares fitting algorithm MPFIT (Mark- technique as in our earlier paper (Weber & Strassmeier 2011).
wardt 2009). For solutions with non-zero eccentricity, we used Contrary to our initial orbital solution in 2011, the difference
the prescription from Danby & Burkardt (1983) for the calcula- between the systemic velocities of the two components is now
tion of the eccentric anomaly. just 3 m s−1 on average (derived from two SB1 solutions of the
Article number, page 12 of 21Strassmeier, Granzer, Weber et al.: BRITE and STELLA
60
50
40
Radial velocity (km/s)
30
20
10
0
0.0 0.2 0.4 Phase 0.6 0.8 1.0
0.5
Resid. (km/s)
0.0
0.5 primary
0.5
0.0
0.5 secondary
Fig. 15. Radial velocities from STELLA and orbit for α Aur = Capella. Blue dots denote the primary (G8 III), green dots the secondary (G0 III).
The bottom panels show the residuals from the final orbital solution with the systematics removed. Radial velocities covered the time range 2007
to 2020.
A and B components separately) and literally zero at the quadra- Table 5. Spectroscopic orbital elements for α Aur.
ture phases, as it should be. This strengthens our belief that the
present solution is vastly superior than the solution presented Parameter Value
earlier. The difference that we found in the 2011 solution was
59 m s−1 and we had to simply correct for it without knowing the P (days) 104.021572±0.000056
cause. The bottom panel in Fig. 15 shows the remaining residu- γ (km s−1 ) 29.4232±0.0004
als for both components, 63 m s−1 for the primary and 198 m s−1 KA (km s−1 ) 25.9283±0.0019
for the secondary, albeit deviations are hardly visible anymore KB (km s−1 ) 26.8219±0.0062
to the naked eye. For comparison, the plot of RV versus HJD in e 0.000397±0.000024
Fig. A.1 shows the full residuals including the systematics. ω (◦ ) 317.0±3.5
T 0 (HJD) 2,454,381.4±1.0
Our new mass ratio MB /MA is 0.96669±0.00072. With an in-
aA sin i (106 km) 37.0878±0.0027
clination of the orbit of 137.156±0.046 deg (Torres et al. 2015)
the component masses for A and B are 2.5579±0.0013 M and aB sin i (106 km) 38.3660±0.0089
2.4727±0.0007 M , respectively, not taking into account the er- MA sin3 i (M ) 0.80430±0.00038
ror of the inclination. If the inclination error is added the mass er- MB sin3 i (M ) 0.77751±0.00021
rors increase to ±0.0079 for A and ±0.0071 for B. These masses NA , N B 9629, 9561
are precise (and hopefully comparably accurate) to ≈0.3%. Nev- rmsA (km s−1 ) 0.062
ertheless, our masses are smaller by 1% than the equally precise rmsB (km s−1 ) 0.198
masses obtained by Torres et al. (2015) including the astromet-
ric data. While tiny, this value is formally more than 3σ and Notes. Suffix A for primary (G8 III), B for secondary (G0 III). The pa-
thus significant. We note that above masses practically do not rameter N is the number of measurements used in the orbit computation;
change if we adopt a circular solution. The formal eccentricity is T 0 is the time of periastron, or ascending node for circular orbits.
0.000397±0.000024 with ω=317◦ , and thus only half our previ-
ous value and that given by Torres et al. (2015). The fit quality in
terms of deviation per RV data point is only better by 0.5 m s−1 owing to its short orbital period of close to four days. Our cir-
for the primary, but worse by 0.3 m s−1 for the secondary with cular SB2 fit achieved a rms per individual RV data point of
respect to the circular solution. Table 5 gives the eccentric solu- 240 m s−1 for the primary and 2.5 km s−1 for the secondary. The
tion. secondary star shows a significant Rossiter-McLaughlin effect
β Aur. This source was monitored for close to one year and contributing to its comparably large rms. Rotational broaden-
thus allowed a precise redetermination of its orbital elements ing for both stars is comparable though; v sin i1 =29.3±1.3 km s−1
Article number, page 13 of 21You can also read