Broadband Access in City of Columbus, Ohio
←
→
Page content transcription
If your browser does not render page correctly, please read the page content below
Broadband Access in
City of Columbus, Ohio
Assessment and Strategies for Addressing the Broadband
Gap

Commissioned By:
The Columbus Foundation

June 30, 2020

1234 E Broad St, Columbus, OH
43205
Broadband Access in City of Columbus, Ohio                                                       The Columbus Foundation

Prepared for:
The Columbus Foundation
1234 E Broad St, Columbus, OH 43205

Prepared by:
S. Blaine Overstreet
Senior Solutions Consultant
T: (919) 461-1426
M: (919) 748-9174
E: blaine.overstreet@aecom.com

AECOM
2101 Wilson Boulevard
Arlington, VA 22201
aecom.com

Copyright © 2020 by AECOM

All rights reserved. No part of this copyrighted work may be reproduced, distributed, or transmitted in any form or by
any means without the prior written permission of AECOM.

Prepared for: The Columbus Foundation                                                                           AECOM
Broadband Access in City of Columbus, Ohio                                                                                                        The Columbus Foundation

Table of Contents
1.           Introduction and Scope ......................................................................................... 6
2.           Executive Summary.............................................................................................. 7
3.           Introduction to Broadband .................................................................................... 8
4.           Understanding the Broadband Gap .................................................................... 13
Identifying Areas of Need ............................................................................................................................................. 14
Existing Broadband Service Provider Access .............................................................................................................. 18
Existing Broadband Service Provider Pricing ............................................................................................................... 23
Existing Wireless Service Availability ........................................................................................................................... 24
5.           Closing the Gap – Current Programs ................................................................. 25
Subsidies Preceding Covid-19 ..................................................................................................................................... 25
Broadband Relief for COVID-19 Impacts ..................................................................................................................... 25
AT&T ............................................................................................................................................................................ 25
Charter Communications/Spectrum ............................................................................................................................. 26
Comcast/Xfinity ............................................................................................................................................................ 26
Wow! ............................................................................................................................................................................ 26
6.           Mobile vs Fixed Broadband ................................................................................ 27
7.           Technology for Broadband Access ..................................................................... 29
Metro Fiber Deployments ............................................................................................................................................. 29
Wireless Mesh.............................................................................................................................................................. 32
Passive Optical Networks ............................................................................................................................................ 33
Key Market Drivers for PON Deployments ................................................................................................................... 34
Business Case ............................................................................................................................................................. 35
8.           Strategies for Broadband Growth ....................................................................... 36
Short Term / Immediate Solutions ................................................................................................................................ 36
Short-Term Option: Hotspots and Bulk Purchasing ...................................................................................................... 36
Medium Term Solutions ................................................................................................................................................ 36
Medium-Term Option: Municipal and Neighborhood Wi-Fi ........................................................................................... 37
Medium-Term Option: Community Wireless Mesh ....................................................................................................... 37
Long Term Option: Public-Private Partnerships............................................................................................................ 38
Long Term Option: PON Technologies ......................................................................................................................... 39
Long Term Option: 5G Wireless Networks ................................................................................................................... 41
Long-Term Option: Co-Op Broadband Networks.......................................................................................................... 43
Case Study: DC Community Access Network (DC-CAN)............................................................................................. 44
Precedent: e-Vermont Community Broadband Project................................................................................................. 44
Case Study: Community Mesh Precedent, NYC MESH ............................................................................................... 45
Precedent: Chicago’s Smart Communities Initiative ..................................................................................................... 46
9.   Glossary of Terms ............................................................................................... 47
Appendix A Metro Fiber Networks ................................................................................. 50
Century Link ................................................................................................................................................................. 50
CityNet ......................................................................................................................................................................... 51
Cologix, Columbus Fibernet, Dublink ........................................................................................................................... 52
Crown Castle................................................................................................................................................................ 53
Enlite by CEC ............................................................................................................................................................... 54
Everstream ................................................................................................................................................................... 55

Prepared for: The Columbus Foundation                                                                                                                                   AECOM
Broadband Access in City of Columbus, Ohio                                                                                                        The Columbus Foundation

Horizon Telecom .......................................................................................................................................................... 56
Independents Fiber Network ........................................................................................................................................ 57
Level 3 ......................................................................................................................................................................... 58
Metro Data Center........................................................................................................................................................ 59
Rail America (ROW) ..................................................................................................................................................... 60
Segra ........................................................................................................................................................................... 61
Windstream .................................................................................................................................................................. 62
Wow! Business and Wow! Bluemile ............................................................................................................................. 63
Zayo Metro and Zayo Leased ...................................................................................................................................... 64

Figures
Figure 1: Bandwidth Consumption for Two Simultaneous Youtube users ................................................................... 11
Figure 2: Historic, Current, and Recommended Broadband Definitions ...................................................................... 12
Figure 3: National Broadband Adoption, ACS 2013-2017 ............................................................................................ 13
Figure 4: Student Participation in Remote Education .................................................................................................. 14
Figure 5: ACS No Internet Access Response, Census Tracks with 27% ...................................................... 15
Figure 6: ACS No Internet Response, filtered for 30% or higher minimum .................................................................. 15
Figure 7: ACS Poverty Demographics, Census Tracks with 30% ................................................................. 17
Figure 8: 10Mbps x 1 Mbps Service Availability based on FCC Form 477 Data ......................................................... 18
Figure 9: 25Mbps x 3 Mbps Availability based on FCC Form 477 Data ....................................................................... 18
Figure 10: 50 Mbps x 5 Mbps Availability based on FCC Form 477 Data ................................................................... 19
Figure 11: 100 Mbps x 10 Mbps Availability based on FCC Form 477 Data................................................................ 19
Figure 12: Service Availability Examples in Zip Code 43223....................................................................................... 20
Figure 13: Service Availability Examples in Zip Code 43204....................................................................................... 21
Figure 14: Service Availability Examples in Zip Code 43207....................................................................................... 21
Figure 15: Cellular Antenna Siting ............................................................................................................................... 24
Figure 16: Reasons for Choosing Cellular Data Over Wired Broadband from Pew Mobile Technology and Home
Broadband 2019 Report ............................................................................................................................................... 27
Figure 17: Demographics for Choosing Cellular Data Over Wired Broadband from Pew Mobile Technology and Home
Broadband 2019 Report ............................................................................................................................................... 28
Figure 18: Aggregate of all Columbus Metro Fiber Providers ...................................................................................... 30
Figure 19: City of Columbus Fiber Network ................................................................................................................. 31
Figure 20: Wireless Mesh Network Diagram ................................................................................................................ 32
Figure 21: Gigabit Passive Optical Network Overview ................................................................................................ 33
Figure 22: Century Link Metro Fiber............................................................................................................................ 50
Figure 23: CityNet Metro Fiber .................................................................................................................................... 51
Figure 24: Cologix, Columbus Fibernet, Dublink metro fiber ....................................................................................... 52
Figure 25: Crown Castle Metro Fiber .......................................................................................................................... 53
Figure 26: Enlite by CEC metro fiber........................................................................................................................... 54
Figure 27: Everstream metro fiber............................................................................................................................... 55
Figure 28: Horizon Telecom metro fiber ...................................................................................................................... 56
Figure 29: Independents Fiber Network metro fiber .................................................................................................... 57
Figure 30: Level 3 metro fiber ..................................................................................................................................... 58
Figure 31: Metro Data Center metro fiber ................................................................................................................... 59
Figure 32: Rail America (ROW) metro fiber ................................................................................................................. 60
Figure 33: Segra metro fiber ....................................................................................................................................... 61
Figure 34: Windstream metro fiber .............................................................................................................................. 62
Figure 35: Wow! Business and Wow! Bluemile (colored blue) .................................................................................... 63
Figure 36: Zayo Metro and Zayo Leased (in green) .................................................................................................... 64

Prepared for: The Columbus Foundation                                                                                                                                   AECOM
Broadband Access in City of Columbus, Ohio                                                                               The Columbus Foundation

Tables
Table 1: Broadband Access Requirements for Typical activities and Usage Profiles .................................................... 9
Table 2: Columbus census tracts with lowest internet access levels per the ACS data................................................ 16
Table 3: Service Provider Max Speed* by Zip Code (source: broadbandnow.com) ..................................................... 22
Table 4: ROM Cost for Subscriber Home Connection ................................................................................................. 40
Table 5: Central Office PON Equipment Costs (Initial 5K Subscribers) ....................................................................... 41
Table 6: Central Office PON Equipment Costs (Additional 5K Subscribers) ............................................................... 41
Table 7: ROM Cost for 10K Subscriber PON Solution................................................................................................. 41

Prepared for: The Columbus Foundation                                                                                                      AECOM

Broadband Access in City of Columbus, Ohio                                                        The Columbus Foundation

1. Introduction and Scope
The internet has dramatically altered the ways in which people engage with the world around them, the way they
communicate, learn, and access vital services and information on a daily basis. Over the past three decades, the
speed and convenience in which individuals can exchange views, conduct business transactions, access healthcare
and government services, and obtain other critical services has grown exponentially. For some the internet may feel
like ever-present resource, but a surprising number of Americans still do not have fixed broadband internet access. A
Pew Research study finds that 33 million Americans—10 percent of the population— still lacks adequate internet
access. The latest Census Bureau American Community Survey finds many census tracts and entire counties with
less than half the households having home internet access.

This report was generated within the context of a larger working group of concerned citizens and organizations in the
City of Columbus looking to understand how to close the Digital Divide within their community. The Digital Divide is a
larger and more varied topic than broadband access, involving factors across many domains including access to
connectivity, devices, and literacy. Within the wider context of this group, this report focuses on providing data and
analysis around the availability, differentiation, and lack of adoption of internet services by households in the City of
Columbus, Ohio as a foundation upon which other policy and planning discussions may be framed. Specifically, we
have been asked to present maps and visual information outlining the presence of broadband service within the City
of Columbus, to identify or prioritize areas where there may be a need for increased access, and provide short and
long-term recommendations for increasing access in these areas. We recognize that the City of Columbus is part of a
larger context with Franklin County and also Ohio State, however the scope of our report was limited to City of
Columbus.

AECOM began working on this analysis in May of 2020 and presented the findings of the report in June of 2020. This
report is based on public datasets available online, information provided to us by the working group from May to June
of 2020, and subscription databases to which AECOM maintains access as an infrastructure company. This research
effort did not include access to proprietary information from service providers or in-person surveys in the
neighborhoods involved. Public datasets forming the core of this evaluation included the FCC Form 477 Broadband
Deployment data, the American Community Survey data, and documents provided by various team members in the
working group.

AECOM has broken this report into three major components, an introduction to the topic of broadband and definition
of terms, the evaluation of current internet service access and finally, the presentation of possible solutions based on
precedent and industry best practices.

We encourage the working group to continue to propose efforts and pursue all means for addressing each element of
the Digital Divide.

  Darren Vican, Vice President                                                 Michael Bongiorno, Vice President
  AECOM                                                                        AECOM
  Technology Solutions Group                                                   Buildings + Places

Prepared for: The Columbus Foundation                                                                            AECOM
                                                                                                                     6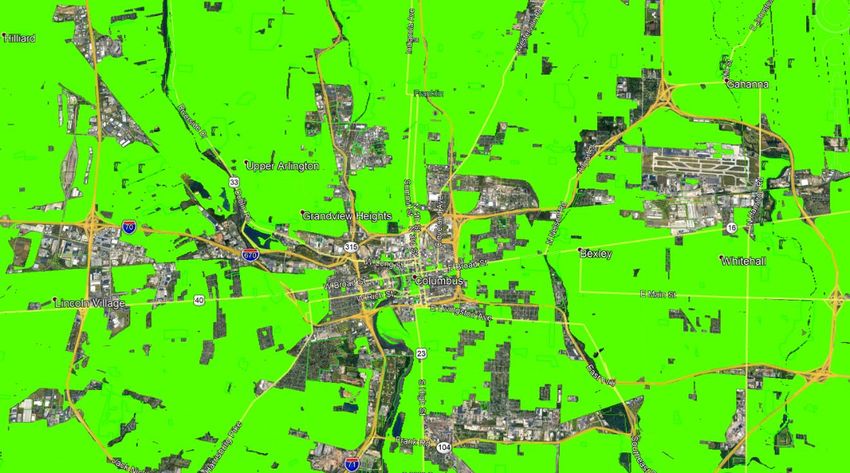
Broadband Access in City of Columbus, Ohio                                                        The Columbus Foundation

2. Executive Summary
Through the course of our evaluation of current internet service access we learned that physical telecommunications
infrastructure in Columbus is widely present across the city. Some datasets we analyzed indicated areas with gaps in
coverage but in all cases our further exploration of these areas indicate these appear to be artifacts in the dataset,
that there was more than one fixed broadband service provider option in those gap areas. More information on this is
presented in the section Existing Broadband Service Provider Access. Our conclusion is that the condition driving
lack of adoption of fixed broadband access in these areas is more complicated and diverse than simply lacking
broadband infrastructure. The factors driving lack of adoption appear to be, in no order, economic factors, technical
literacy, and personal choice. More on this is presented in the section titled Understanding the Broadband Gap.

This report therefore finds that the Broadband Gap in the City of Columbus is not the result of a gap in infrastructure
and that any strategy for closing the Broadband Gap will have to be addressed with community planning, subsidies,
and public private partnerships aimed at improving the economic model and lowering the cost barrier to home internet
adoption. We have proposed a combination of short, medium, and long-term solutions.

Short term solutions require results before construction or infrastructure plans could be enacted. The fastest way to
close the gap is to better utilize the infrastructure that is already in place with education and subsidy programs that
allow more people to utilize existing fixed and mobile broadband infrastructure by lowering the barrier to adoption
from an average of $50 per month to a more practical cost for households that are economically challenged. Options
include additional education efforts around existing residential broadband service options and subsidy plans where
communities may lack the digital literacy skills or access to evaluate options and leveraging bulk purchases for
mobile hot spots and data plans.

Medium-term solutions include leveraging existing city and community buildings and network infrastructure to
expand access to existing city and community provided Wi-Fi access points including expanding coverage at major
parks, community centers, and pedestrian areas. Another medium-term solution involves extending city and
community network infrastructure wirelessly further out into surrounding neighborhoods using managed wireless
infrastructure such as wireless mesh solutions.

Long-term solutions will depend on budgeting, regulatory, and teaming opportunities. Best practice long-term
solutions should consider the economic model or business case in addition to planning for best practice service
speeds and reliability. Long term solutions should recognize the critical nature of the infrastructure and consider the
speed and throughput requirements of residents being asked to work and learn from home for extended periods of
time. In the longer term these will primarily center around opportunities for Public Private Partnerships leveraging
existing public or municipal dark fiber and partnering with private service providers for last mile connectivity to the
home.

Please refer to the full report for the background on understanding broadband terms and technologies, our findings
on the state of internet access infrastructure in the City of Columbus, the nature of the Broadband Gap, and our
recommendations with case studies.

Prepared for: The Columbus Foundation                                                                            AECOM
                                                                                                                     7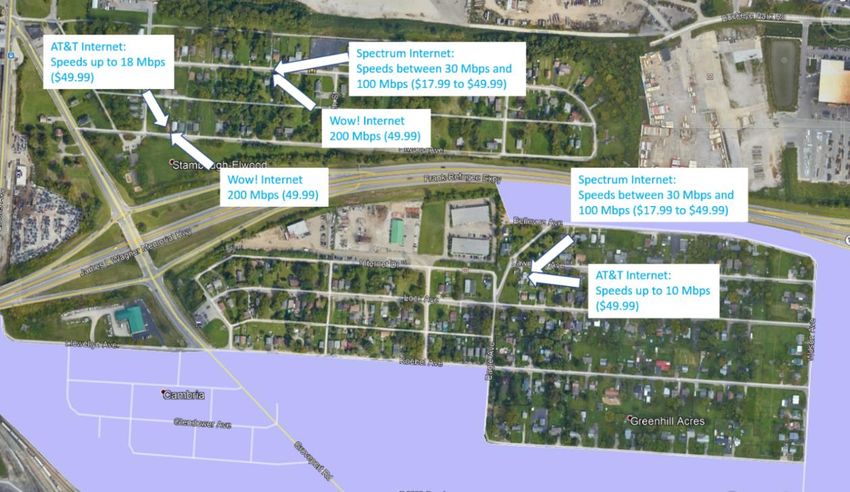
Broadband Access in City of Columbus, Ohio                                                       The Columbus Foundation

3. Introduction to Broadband
In this report we present information on fixed broadband access. This discussion includes references to terms and
definitions that benefit from some background. There are many reports and statistics on internet usage available in
current publication from federal, local, and non-profit organizations, but one of the most helpful in understanding the
fundamentals of residential broadband speeds is the FCC Broadband Speed Guide. This guide does a good job of
introducing the basic concepts of internet service tiers and the proper evaluation of the recommended minimum
connectivity for a household. In this document the FCC outlines several usage scenarios and categorizes them as
Light Use, Moderate Use and High Use which, when combined with the number of users requiring concurrent internet
access at a residence, corresponds to a recommended service tier. These service tiers are described as Basic,
Medium, and Advanced. Charts from the FCC Household Broadband Guide are included in this report for reference.
The full guide can be found at: https://www.fcc.gov/consumers/guides/household-broadband-guide.

It is important to address a common misunderstanding about the terminology used in broadband access networks.
The terms bandwidth, throughput, and speed are often used interchangeably to describe how much data can be
transmitted to or from an end user. But there are technical differences between these terms that should be
understood. Although bandwidth is the most common term used in this context, when talking about that data transfer
as a consumer, we are technically referring to throughput, not bandwidth. Throughput is a measure of how much
data is transferred from source to destination. Bandwidth is a measure of how much data could be theoretically
transferred from source to destination under ideal conditions. It is helpful to think of bandwidth as a multi-lane
highway in which only a certain amount of traffic is passing through (throughput). A service provider may build a fiber
network capable of very high bandwidth, however they do often throttle the traffic to achieve a lower throughput.
Throughput measures speed while bandwidth is only indirectly related to speed. Therefore, it is appropriate to
interchange the terms throughput and speed.

The data throughput requirements of various common internet and corporate applications is what forms the basis for
the FCC speed tiers. As an example, streaming HD video is characterized as requiring 5 to 8 Megabits per second
(Mbps) while streaming a podcast or online radio is characterized as requiring less than 0.5 Mbps. A list of throughput
datapoints is presented below, including FCC established data points as well as throughput recommendations for
some common consumer applications such as Zoom. Note that the FCC established datapoints only specify the
download speeds but for interactive or collaborative applications such as video or audio conferencing, something of
critical importance during a government mandated stay-at-home times such as we are experiencing currently with
Covid-19, the upload capability is equally critical.

Prepared for: The Columbus Foundation                                                                           AECOM
                                                                                                                    8
Broadband Access in City of Columbus, Ohio                                                     The Columbus Foundation

                 Table 1: Broadband Access Requirements for Typical activities and Usage Profiles

The FCC maintains a definition of broadband which it refers to as a “Performance Benchmark for Fixed Service”. This
definition is important due to its frequent usage in governance and regulatory work. The FCC has defined and
updated their definition of Broadband several times. In 1996 the FCC definition of Broadband was 0.2 Megabits per
Second (Mbps) download and 0.2 Mbps upload. This increased in 2010 to 4 Mbps download, 1 Mbps upload. In 2015
the FCC increased the benchmark of broadband to the now current 25 Mbps download and 3 Mbps upload or 25/3.
This 25/3 definition was a major improvement but as this report shows, in the current stay-at-home situation and with
new technologies that have become more prevalent since 2015, any plans for building out new infrastructure would
be wise to target a higher standard or tier of service. Further information on the history of the FCC definition of
Broadband can be found on the FCC website and in the article on Broadband Definition at BroadbandNow at:
https://broadbandnow.com/report/fcc-broadband-
definition/#:~:text=The%20official%20FCC%20broadband%20definition,Mbps%20download%2C%201%20Mbps%20
upload.

The latest FCC report on Broadband Deployment, 2019 Broadband Deployment Report, discusses the introduction of
other benchmarks such as latency, data caps or “allowances”, and pricing. Ultimately, the 2019 report dismisses
inclusion of these additional metrics in the official benchmark as not affecting, “…the underlying determination of
whether advanced telecommunications capability has been deployed…” and point to a lack of, “…reliable,
comprehensive data sources…” for evaluating these other benchmarks. The latest FCC Broadband Progress Report
is the 2020 report, however much of the discussion of benchmarks references the findings in the 2019 report. Online
access to the all of the Broadband Progress Reports can be found at: https://www.fcc.gov/reports-
research/reports/broadband-progress-reports

In a discussion of broadband definitions, marketing of broadband services, and evaluation of usage, it is important
understand the value of these speeds over time. The perception of many subscribers is that these numbers are a
promise or minimum speed, however they are typically a maximum speed enforced by the service provider, assuming
best case conditions on the network, effectively, a maximum speed. Generally, speed requirements for specific
applications are stated as the maximum or peak required and combining users does not simply result in the total sum
of the peak application requirements. The nature of maximum versus sustained internet connection speeds and shifts
in peak usage time is complicated but it is important to understand how these applications and their throughput
requirements impact broadband infrastructure and service tier discussions. The question of what internet speeds

Prepared for: The Columbus Foundation                                                                         AECOM
                                                                                                                  9
Broadband Access in City of Columbus, Ohio                                                         The Columbus Foundation

should be considered for minimum functional access for a household depends on the way the throughput demand
works in real world scenarios.

Of importance is the fact that the maximum speeds referenced for each of the
                                                                                         Peak Throughput:
various applications in the table above is a peak number which occurs
                                                                                         Streaming media consists of
periodically and typically for a brief time. For example, an end user viewing a
                                                                                         “bursty” traffic with
high-definition Youtube video will initially require a peak download rate between
                                                                                         momentary peaks while video
12 and 25 Mbps depending on the network conditions at that time. However,
                                                                                         buffers. This “bursty” property
assuming sufficient throughput, that peak exists in time for only a few seconds as
                                                                                         of streaming media along
the end user’s browser queues up, or buffers, the video’s initial content. The
                                                                                         with variable compression
video may then consume perhaps 2 to 4 Mbps for 15 to 30 seconds before again
                                                                                         helps accommodate lower
bursting to a higher peak utilization for less than five seconds. This process
                                                                                         speed tiers. At some
continues for the duration of the video. If insufficient throughput is available for
                                                                                         threshold however, lower
streaming video, the browser application will typically freeze the playback while it
                                                                                         speed will still result in
waits for the content to buffer and then continue from where it paused, resulting
                                                                                         stuttering or pauses for
in pauses but no loss of information. Other examples of bursty throughput
                                                                                         buffering. Real time video
applications include web-browsing, email, and file transfers. With these non-live
                                                                                         such as web conferencing
applications the network simply transfers data at peak available throughput until
                                                                                         exhibits more sustained, less
the information is full transferred. The user perceives this as extended load times.
                                                                                         “bursty” throughput and low
                                                                                         speeds will result in lost video
A different and vital classification of internet application is real-time media. Real-
                                                                                         and audio.
time applications such as video conference calls and voice-over-IP have a
sustained throughput requirement over the duration of the call with minimal fluctuation. For consumer live video or
web conferencing this is between 1 and 3 Mbps for the duration of the call. This is because a live video call cannot
buffer (or save in advance) more than 150 milliseconds of video and audio without losing synchronization with the
other participants on the call. This illustrates a difference between live video, such as a video call, versus streamed
video, such as a Youtube or Netflix show. For live video, a delay in transmitting the data may be allowed for a brief
interval, however, if this persists the application will simply skip the information and process the remaining real-time
audio and video, resulting in choppy video and lost audio.

Considering the bursty and constantly changing nature of application throughput requirements, service providers
need not interpret the maximum speed metrics as a pervasive requirement. For example, combining the requirement
for two simultaneous Youtube video streams is not so straight forward as adding together the two maximum speed
requirements. Instead the downstream throughput demand is characterized in the figure below which depicts two
simultaneous Youtube users each streaming a high definition video for one minute. The result is that two users with
video streams requiring a burst of 20 Mbps do not result in infrastructure that requires 40 Mbps rather, the brief peaks
rarely overlap and therefore the sustained demand is more often less than 4 Mbps per stream. In this example, an
internet connection with 25 Mbps throughput would be sufficient to support both streams with no impact to buffering
times. A 10 Mbps connection would result in more time at the peak as the lower throughput means that the peak
period would be extended to account for the full buffering but would likely result in minimal disruptions. A 5 Mbps
connection would likely suffer significant buffering and may prove unsustainable, requiring lower video quality to be
served.

Prepared for: The Columbus Foundation                                                                              AECOM
                                                                                                                       10
Broadband Access in City of Columbus, Ohio The Columbus Foundation
Figure 1: Bandwidth Consumption for Two Simultaneous Youtube users
Since Covid-19 there has been a renewed focus on Internet as a critical social
Covid-19 Internet Speed Shift:
and economic infrastructure element. Students rely on the internet to access
During the Covid-19 stay-at-
school hosted educational materials while adults rely on the internet to work
home period, large portions of
from home. The topic of securing functional access to the internet with enough
America have been asked to
throughput has become a critical infrastructure question for many communities
remain at home, where possible
as service providers have worked to keep up with the increased usage of
using distance learning and
communities and Cities who have suddenly shifted to working and studying
telecommuting applications.
from home.
This has resulted in a boom in
video conferencing with many
Given the number of things that have changed since the introduction of the
households having multiple
2015 FCC Broadband Benchmark, increased usage of two-way media, namely
work or school calls
video conferencing, and increased simultaneous broadband usage, any
simultaneously. This resulted in
community looking to ensure a functional level of broadband service would be
an explosion in upload
advised to consider a modification to the 2015 FCC Broadband Benchmark.
throughput unforeseen in the
FCC 2015 Broadband
Industry trends show an increased prevalence of video calls during the current
Benchmark.
stay-at-home period and anticipate a general shift to greater video
conferencing usage in the near future including video calls for telemedicine, education, work, and other daily services.
This increase in video calls means that while 25 Mbps download throughput may be sufficient, the average household
will need greater upload throughput capacity during stay-at-home guidance or increased working from home periods,
even if it is not a pervasive demand.
Our analysis of the functional level of broadband service posits the following
Proposed Bandwidth
scenario for household broadband requirements: a household with four
Benchmark:
individuals requiring simultaneous participation in working or learning from
Keep the FCC 2015 25 Mbps
home. Using the FCC’s own suggested minimum download speeds,
download, modify the upload
supplemented with specific application requirements for upload speeds, our
from 3 Mbps (a single video
recommendation is that a functional definition for broadband access in
conference stream) to 15 Mbps
2020 should be based around 25 Mbps download and 15 Mbps upload, or
(up to 4 simultaneous video
25/15. This recommendation accounts for four simultaneous 3 Mbps uploads
conference streams)
activities, such as video calls, while leaving some buffer for other tasks.
Prepared for: The Columbus Foundation AECOM
11Broadband Access in City of Columbus, Ohio The Columbus Foundation
Our recommendation is that long-term residential broadband planning should account for the added upload demand
necessary to accommodate multiple household residents on video conferences, telemedicine, and online learning
with the expectation that these applications will continue to trend upwards. We also see a shift from High Definition to
Ultrahigh Definition (UHD) video as well as more mobile devices and displays shift to the UHD standard for recording
and playback of videos. The last major trend we include in our recommendation for long-term residential broadband
throughput planning is the proliferation of Internet of Things and other connected devices that increasingly need to
upload and download data to cloud services. Based on these trends, we recommend that projects targeting 2030 and
beyond should consider higher minimum speeds tiers forming the basis of the Basic Broadband service, based at 100
Mbps downstream and 25 Mbps upstream. We encourage higher speed tiers to be considered for more advanced
usage but view the 25/15 as a recommended new definition Basic Broadband for communities looking to address the
topic of the Broadband gap in a post Covid-19 world. The following table presents this progression of historic, current,
and recommended broadband definitions.
Defining Broadband for Success
120
100 100
80
60
40
25 25 25
20 15
4 3
0.2 0.2 1
0
1996 2010 2015 Report Report
FCC Definition FCC Definition FCC Definition Recommended Recommended
Minimum - 2020 Minimum - 2030
Download Upload
(Mbps) (Mbps)
Figure 2: Historic, Current, and Recommended Broadband Definitions
Prepared for: The Columbus Foundation AECOM
12Broadband Access in City of Columbus, Ohio The Columbus Foundation
4. Understanding the Broadband Gap
The presence of a significant portion of the population who lack internet access is common across the United States
and is an issue being pursued at both the urban and rural level with different approaches.
Understanding the Broadband Gap involves two separate activities, 1) looking for areas lacking sufficient fixed
broadband infrastructure and 2) looking for areas that have low adoption rates. These are not necessarily the
same locations.
Figure 3: National Broadband Adoption, ACS 2013-2017
The most standardized datasets for this information are the FCC Form 477
AT&T Form 477 Reporting Error
Data and the American Community Survey, ACS, data. These are public,
This error did not affect the City of
nationwide datasets organized by census tract and updated regularly.
Columbus study. Tracts affected in
However, they each have their own shortcomings. The FCC Form 477 data
Ohio were: Athens (39009),
is self-reported by service providers and this can result in reporting errors
Cuyahoga (39035), Erie (39043);
such as the April 2020 error identified where one service provider incorrectly
Lucas (39095); Portage (39133);
reported service across census tracts nationwide. Known issues with the
and Summit (39153).
ACS dataset include questions about the phrasing of the questions asked
and extrapolation from a limited sampling.
The gap in access to internet service is very real. As an illustration of this gap, Columbus City Schools provided an
overview of data summarizing those areas with the greatest number of households not accessing school online
services such as Clever. In Figure 4 below, the darker purple areas are those with the highest number of students
NOT accessing the system, in other words, the darker the purple, the worse the access. As this report demonstrates,
these areas largely correspond to the areas with the least internet access as documented by the American
Community Survey (ACS) data on internet access and subscriptions.
Prepared for: The Columbus Foundation AECOM
13Broadband Access in City of Columbus, Ohio The Columbus Foundation
Identifying Areas of Need
One of the visualizations that most clearly shows the divide in accessing online services was provided by Columbus
City Schools in the form of data on students not accessing Clever, the Columbus City Schools Single-Sign-On
centralized learning resources portal. This information was provided as a data visualization in Figure 4 below showing
areas with the highest concentration of “not accessing Clever” as the darkest purple areas. Note the correlation to the
American Community Survey (ACS) data on poverty and ACS “No Internet Access” responses.
Figure 4: Student Participation in Remote Education
A nationwide survey performed every year, the American Community Survey includes data for all Census tracts
nationally based on a smaller sampling with more detailed questions than the Census. The visualizations below are
from this ACS data and show responses based on a 5-year average of ACS data from 2013 to 2017 with data
extrapolated from samples of areas.
Prepared for: The Columbus Foundation AECOM
14Broadband Access in City of Columbus, Ohio The Columbus Foundation
Figure 5: ACS No Internet Access Response, Census Tracks with 27%
By adjusting the visualization boundaries, an image of the census tracts indicated by the ACS data to have the
highest number of responses for “No Internet Access” is returned. In this visualization, the minimum threshold was set
at 29% and the upper end for differentiation at 50%.
Figure 6: ACS No Internet Response, filtered for 30% or higher minimum
Prepared for: The Columbus Foundation AECOM
15Broadband Access in City of Columbus, Ohio The Columbus Foundation
The data from these census tracts is summarized in the following table. This report makes no statement that 30% is
the appropriate guideline for action but chose 30% as representing a focused list of the census tracts with the least
internet adoption or access. The working group or readers of the report can create a similar list by adjusting the
visualization options in the public ACS data live GIS visualizations linked in this report.
American Community Survey Data for
Columbus Ohio: Census Tracts with > 30%
Responding "No Internet Access"
Number of
Households % of Household
Census Without Without
Tract Internet Access Internet Access
51 438 57.6%
42 142 49.3%
93.31 289 48.1%
14 291 44.6%
15 316 43.6%
61 406 42.9%
29 462 41.5%
50 706 41.0%
93.23 580 38.9%
93.21 347 38.1%
56.20 348 37.9%
27.10 414 37.4%
27.30 388 37.0%
55 642 37.0%
23 175 35.2%
93.25 708 34.5%
49 672 34.4%
46.20 303 34.3%
87.20 469 34.0%
75.20 396 33.9%
9.20 243 33.5%
56.10 227 32.0%
75.11 257 32.0%
54.10 185 31.8%
48.20 291 31.5%
7.30 403 30.7%
87.30 194 30.6%
Table 2: Columbus census tracts with lowest internet access levels per the ACS data
Prepared for: The Columbus Foundation AECOM
16Broadband Access in City of Columbus, Ohio The Columbus Foundation
For comparative purposes, the ACS dataset on Poverty by census tract is included here as well. Note the correlation
between internet access, school online education system access, and poverty levels (darker shaded areas).
Figure 7: ACS Poverty Demographics, Census Tracks with 30%
Lack of internet access is a complicated situation but barriers to adoption largely come down to two main categories,
the presence or availability of internet access and the affordability or terms of the subscription. This report was
commissioned to evaluate the availability of internet service primarily, however in evaluating the data it became
evident that the main barrier to accessing the internet was not a lack of infrastructure.
Cellular or Wired Internet?
ACS data shows a correlation between lack of wired internet access
and usage of mobile data on a smartphone or tablet. The topic of
cellular-only internet is addressed later in this report.
There are numerous sites dedicated to making the ACS data available to community organizations and government
members. One location available to readers of this report at the time it was release is the following location.
http://columbus.maps.arcgis.com/apps/webappviewer/index.html?id=599e40323acc46d090eabe37a835c86d
Prepared for: The Columbus Foundation AECOM
17Broadband Access in City of Columbus, Ohio The Columbus Foundation
Existing Broadband Service Provider Access
AECOM has analyzed the City of Columbus and surrounding service areas for multiple provider offerings. The
research was conducted using a variety of sources such as service provider web pages, service provider external
affairs contacts, FCC Form 477 registration databases, American Community Survey (ACS) data, subscription-based
fiber and wireless database repositories, and organizations which are focused on the topic of broadband availability
and digital inclusion. The following maps show the Service Provider reported data (FCC Form 477) for the City of
Columbus across multiple speed tiers.
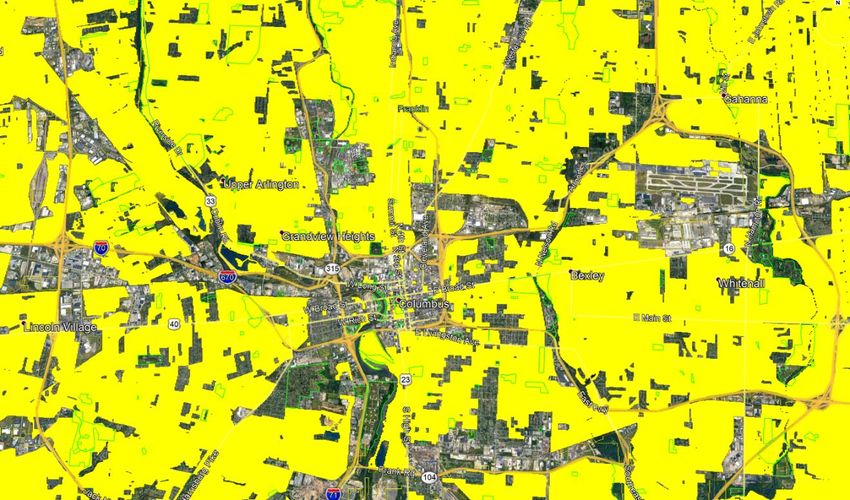
Figure 8: 10Mbps x 1 Mbps Service Availability based on FCC Form 477 Data
Figure 9: 25Mbps x 3 Mbps Availability based on FCC Form 477 Data
Prepared for: The Columbus Foundation AECOM
18Broadband Access in City of Columbus, Ohio The Columbus Foundation
Figure 10: 50 Mbps x 5 Mbps Availability based on FCC Form 477 Data
Figure 11: 100 Mbps x 10 Mbps Availability based on FCC Form 477 Data
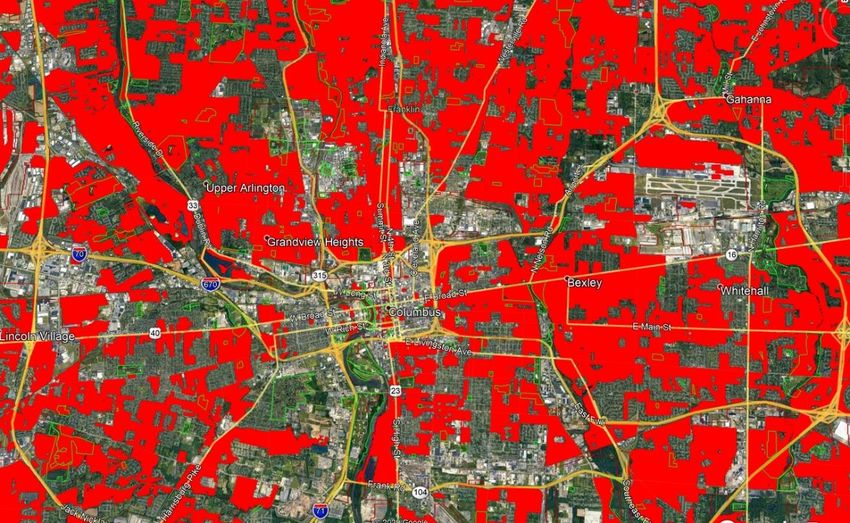
As depicted in the coverage maps above, there appear to be significant gaps in broadband availability. These gaps
are particularly worrisome given that some of them are found in economically challenged neighborhoods as
established in ACS data and data provided by the Columbus City School District. However, as we began to validate
the data, we found that each of these areas were in fact served by multiple providers and the speed tiers offered were
comparable to other service provider areas in the city. For example, the zip code of 43223 has a particularly large gap
Prepared for: The Columbus Foundation AECOM
19Broadband Access in City of Columbus, Ohio The Columbus Foundation
as shown by the FCC data. As represented by the American Census Survey, the FCC 477 data, and the Columbus
School system, this zip code is an area of concern with respect to K-12 remote learning attendance, economic status,
and the number of households without a broadband subscription. Looking at AT&T’s offering in this specific area
reveals speeds only up to 5 Mbps with 1.5 Mbps being the typical offering at a price of $49.99 per month. Relative to
the speed tiers and costs in other neighboring areas, this is an uncompetitive offering at the price for speed metric.
However, there are some inaccuracies with that data as we find that access to an alternative broadband provider is
not the issue as depicted in the figure below. By looking at other providers in these areas, we see more competitive
price for speed offerings. This was typical of our findings in performing these spot checks, one service provider may
have a non-competitive offering in an area, but others offered better price to speed, but the overall subscription cost
remained high.
There are multiple areas within the city that have similar data discrepancies showing a lack of service or high speeds
when in fact there are viable options for consumers. Another example is Zip Codes 43204 and 43207 which
represented some of the highest rates of non-participation in online school activities. The figures below however
reveal that the reason is not likely due to a lack of broadband services being available.
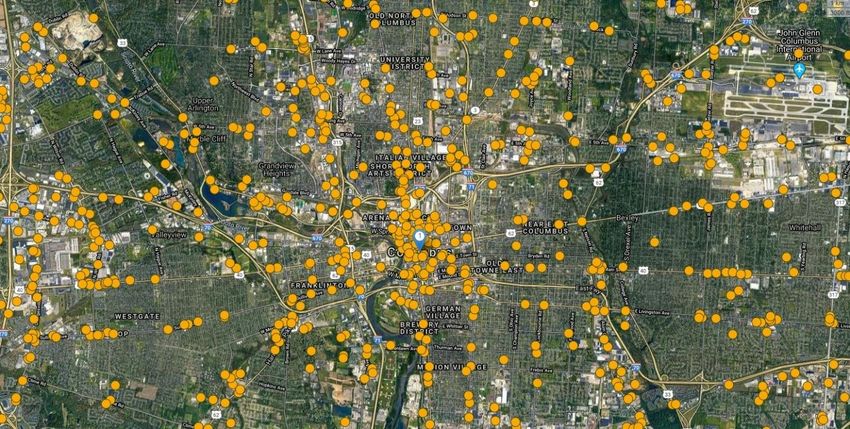
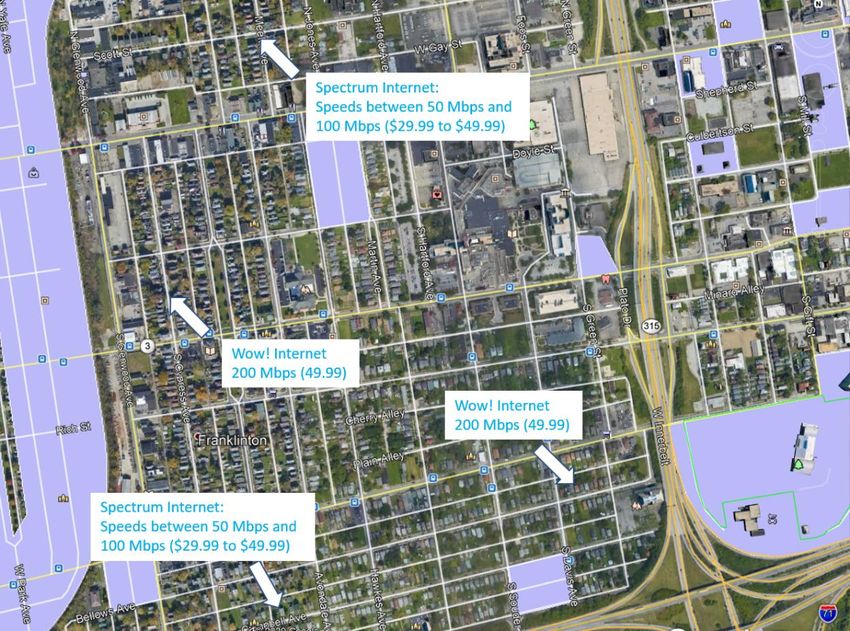
The methodology used to validate the FCC service provider data was to select specific areas within the top five zip
codes of concern (prioritized based on poverty level, Census survey responses regarding internet subscriptions, and
data obtained from Columbus City Schools. We then analyzed those areas for specific geographical barriers that
might inhibit a service provider from investing in broadband infrastructure. These potential barriers include bridge
spans, railroad tracks, rivers, and major roadways. These geographical features can complicate a broadband
infrastructure buildout by requiring additional labor, materials, and administrative overhead such as seeking rights-of-
way and other regulatory requirements. Household addresses which were adjacent to these elements were selected
first and used to verify which of the service providers were able to provide internet services for that address.
Additional addresses were selected along side streets and avenues that spanned the specific area with a focus on
household addresses located on a corner as well as near the midspan of the roadway.
Figure 12: Service Availability Examples in Zip Code 43223
Prepared for: The Columbus Foundation AECOM
20Broadband Access in City of Columbus, Ohio The Columbus Foundation
Figure 13: Service Availability Examples in Zip Code 43204
Figure 14: Service Availability Examples in Zip Code 43207
Prepared for: The Columbus Foundation AECOM
21Broadband Access in City of Columbus, Ohio The Columbus Foundation
Most neighborhoods are served with at least 4 service providers with some areas having as many as 5. These areas
are mostly found in the downtown and surrounding areas including Bexley, German Village, and Grandview Heights.
The remaining areas in Columbus are served by at least 2 to 3 internet providers with cable and DSL services being
the primary technology. The most prevalent service providers in Columbus are Charter Spectrum and AT&T who have
the top two service areas as well as subscriber counts. The competitive footprint for service providers is detailed
below by zip code:
Zip Code AT&T AT&T Fiber Bresco Broadband CenturyLink Mediacom Spectrum Wow!
42223 100 x 50 x x 940 50
43068 100 x 50 100 x 940 50
43201 100 1000 50 x x 940 50
43203 100 1000 50 x x 940 50
43204 100 x 50 x x 940 50
43205 100 1000 50 x x 940 50
43206 100 1000 50 x x 940 50
43207 100 x 50 x 940 50
43211 100 1000 50 x x 940 50
43213 100 1000 50 x x 940 50
43219 100 1000 50 x 100 940 50
43222 100 x 50 x x 940 50
43224 1000 1000 50 x x 940 50
43228 100 x 50 x x 940 50
43229 100 x 50 x x 940 50
43231 100 1000 50 x x 940 50
43232 100 1000 50 x x 940 50
Table 3: Service Provider Max Speed* by Zip Code (source: broadbandnow.com)
* AECOM found that the maximum speed data was inaccurate in some cases. While the listed max
speed may be available, that does not mean every address in that zip code can be served at that
speed. For example, the service provider Wow! is able to provide up to 200 Mbps in some of these
areas and AT&T’s DSL service was often less than 100 Mbps.
Note that satellite-based internet service providers such as HughesNet
Satellite Broadband:
and Viasat were excluded from this list due to insufficient upload
Pro’s: Limited Buildout costs
speeds. As shown in the Introduction to Broadband section, upload
Cons: Lower upload speeds and
speeds are critical for working from home and distance learning
higher latency
functions. In the future, the next generation of satellite offerings such as
Next Gen: A new generation of
those being developed by Starlink, plan to offer gigabit service with a
Satellite internet services are in
planned 30 to 50 millisecond latency which is an improvement over
development and are aiming to
previous satellite-based services. The target audience for Starlink
address the digital divide topic, but
however are areas where no broadband or satellite service is available.
initially aimed at areas remote from
Although the service is beginning beta testing this summer, it remains to
existing infrastructure. i.e. rural and
be seen how quickly the service will be generally offered, what latency
under-developed areas.
and throughput or speed will be, as well as what the price model will be.
AECOM concluded that even in economically challenged neighborhoods, one or more high speed internet providers
is available for consumer internet services.
Additional resources for accessing and visualizing the FCC and the ACS data can be found at the locations below:
City of Columbus GIS:
http://columbus.maps.arcgis.com/apps/webappviewer/index.html?id=599e40323acc46d090eabe37a835c86d
Prepared for: The Columbus Foundation AECOM
22Broadband Access in City of Columbus, Ohio The Columbus Foundation
Mapping Data Created by MORPC:
https://www.arcgis.com/home/webmap/viewer.html?webmap=dbe9615d3423404a87257577a3cfdfe8&extent=-
83.206,39.86,-82.6989,40.0776
FCC Broadband Deployment web tool: https://go.usa.gov/xwpAj
https://broadbandmap.fcc.gov/#/area-
summary?version=jun2019&type=nation&geoid=0&tech=acfosw&speed=25_3&vlat=39.99594817197561&vlon=-
82.99799706212838&vzoom=10.380680405214546&scheme=ramp3
Existing Broadband Service Provider Pricing
The list of broadband service providers in the Columbus area is long. The large operators certainly have a
considerable footprint throughout and there are quite a few mid-tier operators as well. However, the remaining list of
operators do not represent a ubiquitous list of competing services in the region. In fact, the operating footprint of
some of the smaller carriers is surprisingly small and often fractured. This is likely due to the presence (or lack
thereof) of metro and long-haul fiber which is either owned by the service provider or leased. Such a factor, combined
with the business requirements and demographic of potential subscribers in a given area, can often result in an
erratic geographical footprint for services offered. In general, and throughout the country, service providers do their
homework when pursuing a new broadband market area. Aside from typical consumer demographics such as median
age, income, or the density of homes, the business model may be focused on underserved areas or existing markets
that do not cater to business needs or offer fewer tiers of service. Other factors may include opportunistic synergies
such as negotiating to install infrastructure for a greenfield development in exchange for franchise rights to the area.
Other operators may simply plan on only providing internet services without the complexities of voice or video
services which often increase the regulatory and licensing overhead for a broadband provider. These factors typically
drive broadband providers across the nation to build a varied set of pricing options that fit the budget and
requirements of the subscriber market.
For the Columbus area however, we find that the service provider offerings for internet-only service is quite generic in
terms of options. While there are some lower speed tier options available in a specific area, the pricing is often not
enticing enough for the average consumer to consider. We find it common that the service provider also imposes
additional fees such as $10 per month equipment fees or onerous minimum contract terms of 2 years. There is often
an introductory price which increases at the end of the minimum term. In most of these cases it would make sense for
the consumer to purchase the higher-priced option as the lower-priced compromise offers less value. We found this
lack of price differentiation to be the case throughout the Columbus area and is likely driven by a focus on higher-
priced (and therefore more profitable) bundled packages. While bundling is a common practice in the service provider
industry, tier flattening has a negative impact on those households with a limited budget or more narrow set of service
requirements who cannot afford the higher tiered service
Tier Flattening
The notion of tier flattening is an important topic in discussions
of Digital Divide as lack of differentiated service with lower
speed tiers at lower costs can present barriers to adoption by
lower income households. Further information on Tier Flattening
can be found at the NDIA website:
https://www.digitalinclusion.org/blog/2018/07/31/tier-flattening/
Prepared for: The Columbus Foundation AECOM
23You can also read