BROADBAND AND THE WISCONSIN ECONOMY - BROADBAND JANUARY 2021 - Center for ...
←
→
Page content transcription
If your browser does not render page correctly, please read the page content below
B R OA D B A N D                                    JANUARY 2021

  BROADBAND
  AND THE
  WISCONSIN
  ECONOMY

               TESSA CONROY
AU T H O R S

               STEVE DELLER
               MATT KURES
               SARAH LOW           Study Series No. 7
               JEFFREY GLAZER
               GAIL HUYKE
               CHRISTOPHER STARK
ACKNOWLEDGEMENTS

THANK YOU
The EDA-University Center team (Tessa Conroy, Steve Deller, Gail Huyke, Matt Kures, Kristin
Runge, and Christoper Stark) is grateful for the expertise shared by the guest contributors.
Jeffrey Glazer is a Clinical Associate Professor at the University of Wisconsin-Madison Law
School. Sarah Low is an Associate Professor and Fred V. Heinkel Professor of Agriculture at the
University of Missouri.

We especially owe thanks to Rachel Ramthun and Jackson Parr for their assistance in preparing
the final publication and for their constructive suggestions.

FUNDING
This work was supported by grants from the United States Department of Commerce Economic
Development Administration in support of the UW Madison Economic Development Authority
University Center (Award No. ED16CHI3030030) and the UW Madison EDA University Center
CARES Act Recovery Assistance Grant (Award No. ED20CHI3070047). Any opinions, find-
ings, conclusions, or recommendations expressed in this material are those of the authors and do
not necessarily reflect the views of the U.S. Department of Commerce Economic Development
Administration.

1    INTRODUCTION

3    WHAT IS BROADBAND

7    BROADBAND IN WISCONSIN AND ACROSS THE U.S.

16   HOW DID WE GET HERE?

28   WHERE DO WE GO FROM HERE?

30   REFERENCES

32   APPENDIX
EXECUTIVE SUMMARY
 In this study we explore issues related to broadband coverage and importance of
 coverage to community well-being. Several key conclusions include:

 •   Broadband access is closely related to population density and income levels,
     meaning the most rural and the lowest-income regions generally have the least
     access. For example, in urban Wisconsin, more than 95% of households have
     broadband access whereas, in the most rural counties, just 63% have access.
     Yet, regardless of their location on the rural-urban continuum, low-income
     households have the least access. Even in the most urban areas of the U.S., 44%
     of households earning less than $20,000 have no internet. In the most rural areas,
     56% of these low-income households have no internet.

 •   Explanations for the lack of service in rural and low-income regions include a
     low return on investment for providers, which is linked to the expense of new
     infrastructure and the low density of potential subscribers. Even if broadband
     service is possible, some areas feature low demand for broadband and the
     expense of service can be a barrier.

 •   Bureaucratic barriers severely constrain municipal provision in Wisconsin and
     data limitations make it difficult for communities to show need, which is often an
     important component of grant applications. Furthermore, there has been less
     federal investment in broadband compared to analogous infrastructure such as
     highways and electrification.

 •   Broadband is becoming increasingly important to community and economic
     well-being. It is linked to better business performance, including rural
     entrepreneurship and farm profits. It is also linked to higher home values and
     higher educational outcomes at both the grade school and high school levels.
     Broadband access also corresponds to improved health outcomes, which can
     lead to higher worker productivity.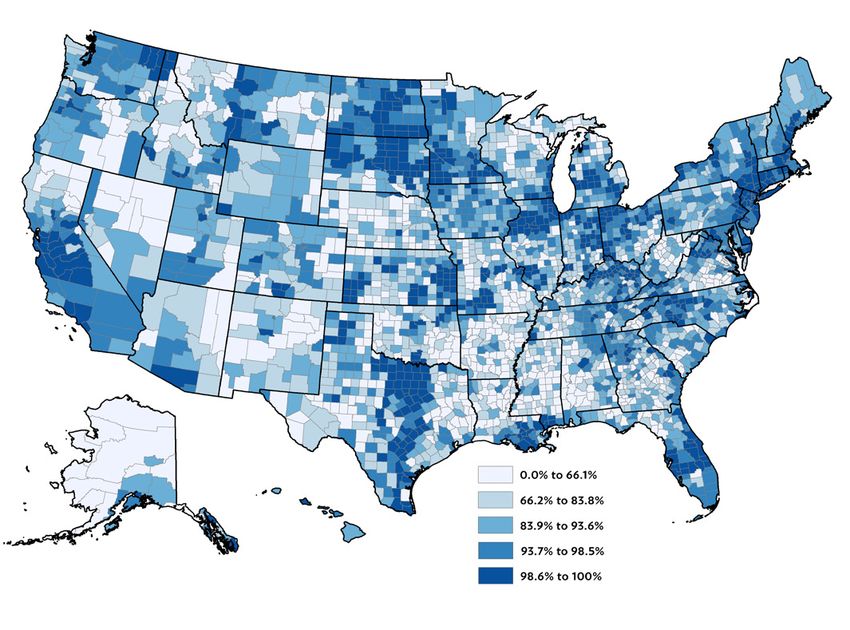
•   In Wisconsin, local conditions vary widely and likely require different approaches or
    a combination of more than one approach in order to improve access. Consider a
    range of challenges and potential paths forward:

    ◦   The most underserved areas are typically rural and likely do not have sufficient
        infrastructure. Accordingly, these areas may want to prioritize strategies and
        policies that encourage the development of physical resources needed to
        provide access.

    ◦   Some regions, such as pockets of Milwaukee and Madison, likely have the
        infrastructure, but many low-income households are still without service. This
        gap in broadband access points to issues around affordability.

    ◦   Some communities seemingly have broadband service available based on
        provider-reported data from the FCC, yet many households are without service.
        This may be a sign that the FCC data does not accurately depict broadband
        availability—a concern of many broadband grant applicants. These places could
        benefit from policies that improve broadband data or create alternate means of
        showing need.

    ◦   Communities that have broadband available but still have households without
        service may be facing a demand issue or, in other words, low adoption of the
        technology. These areas could choose to implement outreach and education
        strategies that note the benefits of broadband and encourage its use.

•   While there has been some improvement in the digital divide across Wisconsin,
    the experiences of COVID-19 and the resulting movement to telecommuting for
    many workers and online learning for both K-12 and higher education students
    demonstrates that much work needs to be done.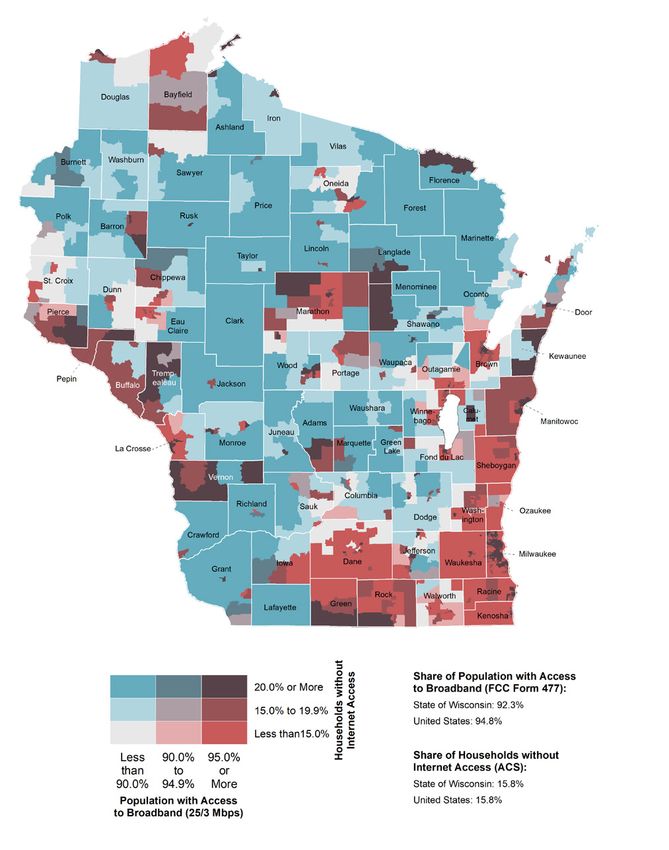
INTRODUCTION
As people are spending more time at home, the challenge of
inadequate broadband in many parts of Wisconsin has gained
attention. As employees work from home, students take their
courses online, patients seek care through telehealth, and families
entertain themselves with at-home streaming services, access to
broadband has become more important than ever and the impacts
of going without broadband even more significant. Without access
to adequate broadband service, employees find it difficult to work.        “The pandemic has
Delivering education online begs the question of equity as some
students are not able to access materials. The inability to use online   prompted new focus on
health-, entertainment-, or retail-related services makes it more        the technology divide…”
difficult to stay at home. While there are several recent state and
federal programs aimed at alleviating the negative impacts on
                                                                          Tom Rutledge, Charter Chairman and CEO
businesses, workers, and families, such as the We’re All In grants
                                                                         The Fond du Lac Reporter, September 21, 2020
or those offered under the CARES Act, they often require access
to broadband for obtaining and submitting the required forms,
making it difficult to enroll and exacerbating already challenging
circumstances.

Issues concerning the lack of appropriate broadband service have
been ongoing for years. Even before the COVID-19 pandemic,
many rural communities and low-income neighborhoods have
been at a comparative disadvantage due to inadequate broadband
access. Economically, a lack of broadband means lower home
values, lower rates of entrepreneurship, and fewer opportunities
for education. Not only are students in underserved communities
placed at a disadvantage, but adults who are pursuing new training
or professional development opportunities are also disadvantaged.
Stories of parents taking children to restaurants and coffee shops            “But Wisconsin’s
or parking outside of closed libraries to access wireless services so
that their children can do their homework are becoming common.           broadband infrastructure
Inadequate service further limits telehealth, a potentially viable         also consistently ranks
strategy to address limited access to healthcare in rural and low-
income areas. Manufacturers are also increasingly dependent on           near the bottom of states
quality broadband for software upgrades, sending and receiving            in the nation. Wisconsin
design schematics and the integration of technologies such as
robotics, artificial intelligence, augmented reality and additive         currently ranks 38th for
manufacturing. To effectively use the latest technologies in             internet access, out of all
agriculture, such as precision agriculture and software programs that
allow dairy producers to monitor the health and well-being of their               50 states.”
herds, farmers need access to quality, affordable broadband services.
                                                                           Wisconsin Public Radio, February 12, 2020
Many communities across Wisconsin have adopted economic
growth and development strategies that fall under the umbrella
of “place-making.” Historically, people have followed jobs: create
employment opportunities and people will move into the community
to take advantage of those jobs. Today, for some types of labor
markets, especially in occupations requiring high knowledge levels,
the flow has largely changed to where jobs now appear to be
following people. Here, creating a community environment that is
attractive to young families, young professionals, and even retirees

Study Series No. 7 | BROADBAND                                                                                          1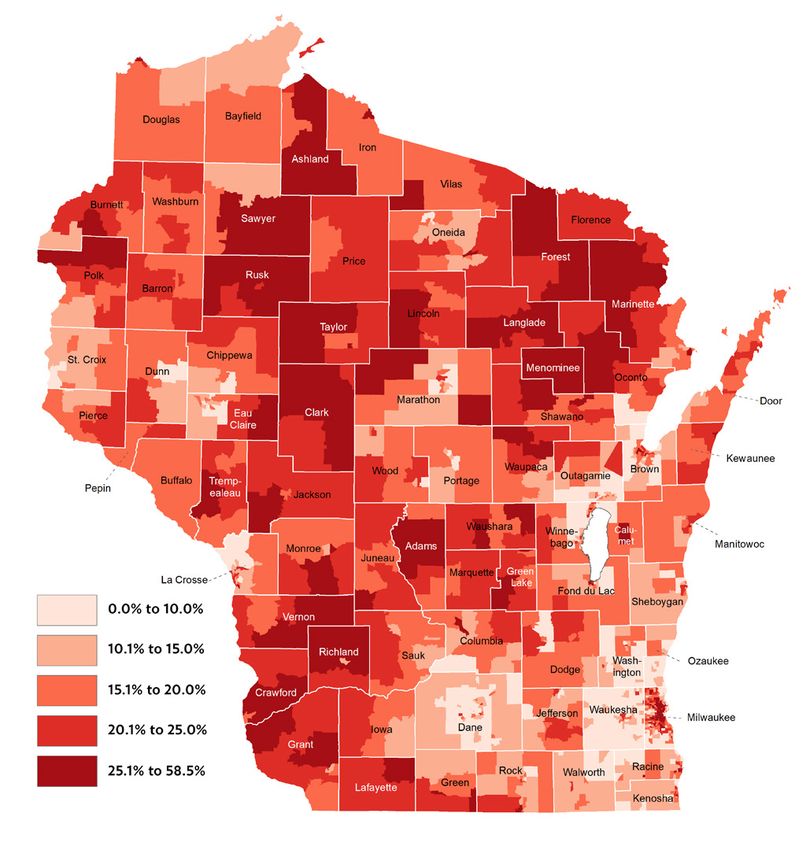
comes to the forefront. Baileys Harbor in Door County, for example, has attempted to encourage young professionals to
relocate there by marketing its quality broadband, which is essential to this kind of place-making strategy, in addition to its natural
amenities.

Other Wisconsin communities, such as Iron County, have pursued a strategy commonly referred to as “boomerang migration.”
Here local youth are encouraged to go to college, experience life in larger communities, then return to their home communities,
raise their families, and perhaps start a business. These communities, however, are finding that inadequate broadband deters
return-migration, further contributing to rural brain drain--the outmigration of skilled rural residents. Wisconsin communities that
are pursuing economic development strategies centered on quality of life factors are thus finding that inadequate broadband
continues to hamper their progress.

In this contribution to The Wisconsin Economy series, we explore a range of issues related to broadband in Wisconsin. We begin
by outlining what we mean by “broadband” and its range of associated technologies. As part of that discussion, we outline some
of the challenges with definitions and technologies. We then provide a detailed analysis of access and use of broadband using
American Community Survey data from the U.S. Census Bureau and the Federal Communication Commission (FCC) data
which is used as the foundation for public investments in broadband infrastructure. In the next section, we outline how access and
use of broadband influences economic outcomes. In the fifth section of this report we briefly review some of the policy issues
affecting access and use of broadband (policy issues are further explored in a companion piece to this report). We close the
report with a general discussion of future directions.

       “As the ag industry looks ahead, one immediate need — emphasized by
     the way more people have been working from home and meeting virtually
    during the pandemic — is broadband internet in rural areas. ‘I talk to a lot of
    farmers, and they’ve got dial-up, slow speed internet,’ said Dalton. Everyone
     in the broader ag business web — suppliers, distributors and government
    agencies — needs a broadband internet connection to communicate, added
                Smith: ‘It’s impossible to run a business without one.’”

              Cal Dalton, an Endeavor, WI (Marquette County) Farmer and Dan Smith, President and CEO of the Cooperative Network
                                                       Wisconsin Examiner June 17, 2020

2                                                                                                            The Wisconsin Economy | 2021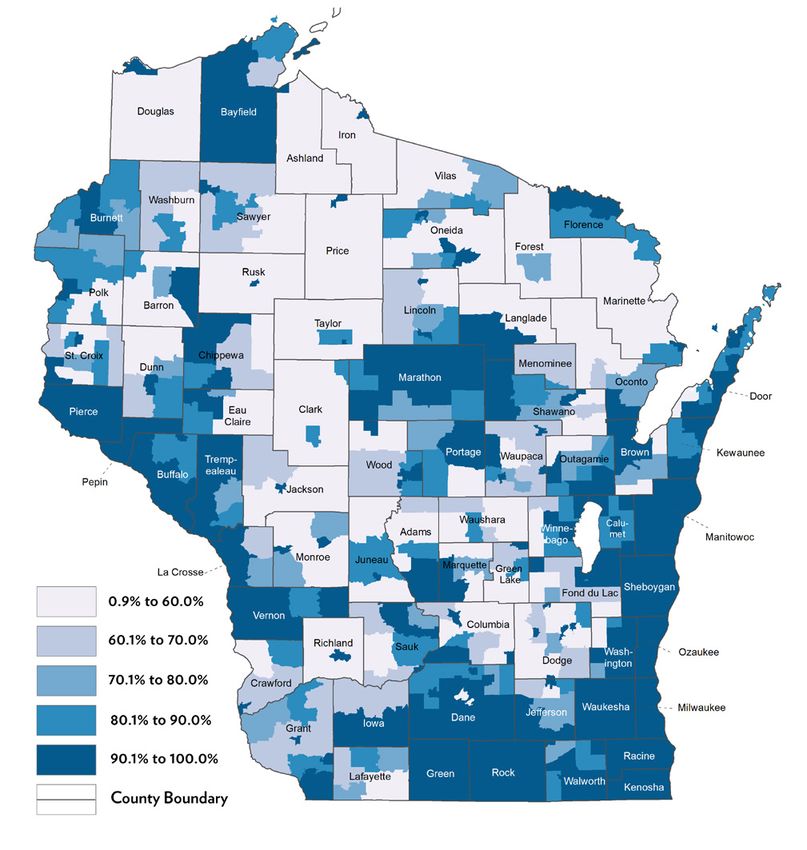
W H AT I S B R O A D B A N D ?
The efficiency of sharing information (data) across computers via the internet hinges
on the speed of the connection. Broadband speaks to the speed of those connections.
Early technologies used telephone dial-up allowing for narrow band telephone
connections that were subject to slow speeds of information transmissions and
interruptions. As new technologies, such as those using coaxial cable networks, reached
many homes and businesses, faster and more reliable alternatives to dial-up internet
became available.

Broadband is a term that is used to reference relatively fast connections for information
sharing. The Federal Communication Commission (FCC) currently defines broadband
as at least 25 Mbps (transfer of “megabits per second”) of download speed and at least
3 Mbps of upload speed. The definition, though, has evolved over time to increasingly
higher thresholds, reflecting the increasing demand for faster connections. This speed
of 25/3 is considered a “moderate” speed suitable for browsing the internet, email,
streaming videos, and playing basic online games. For example, streaming Netflix
or YouTube without interruptions generally requires 5 Mbps (see Table 1). Since the                              BROADBAND
COVID-19 Pandemic, the 25/3 broadband threshold established in 2015 has come                                     DEFINED
under scrutiny for being inadequate. If a household or business has multiple users
accessing the connection at the same time, the 25/3 may not be sufficient.                                       The Federal Communication
                                                                                                                 Commission (FCC) currently
With the added demand for internet use created by the Safer-At-Home order, the                                   defines broadband as an
current definition of broadband, particularly the upload speed (at least 3 Mbps), is                             internet connection with at
proving insufficient to meet household needs. Historically, homes and businesses have                            least 25 Mbps (transfer of
had more demand for downloading information (data) than for uploading, which                                     “megabits per second”) of
typically uses only a limited amount of data (e.g., sending an e-mail, uploading a picture                       download speed and at least
to Facebook or a video to YouTube, or using Zoom for meetings). But with the growing                             3 Mbps of upload speed.
number of people that are telecommuting and using technologies such as video-
conferencing, upload speeds are becoming more important. This is particularly true if
several members of a household are video-conferencing at the same time. If Wisconsin
communities want to promote telecommuting as a viable option for residents, then the
ability to upload larger files and video-conference becomes a necessary condition.

TABLE 1             HOW MUCH SPEED DO YOU NEED?

INTERNET SPEED                      CAPABILITIES
0-5 Mbps                            General browsing, email, social media, online radio

5-40 Mbps                           Video-conferencing, telecommuting, online gaming, streaming video, multiple device usage within a household

40-100 Mbps                         Streaming ultra-high-definition (Netflix 4K)

100-500+ Mbps                       Online education delivery, (e.g. testing services and video streaming), database access, record storage and
                                    sharing characteristic of anchor institutions
1 Gigabit per Second (1,000 Mbps)   High use, multiple-users, high-definition streaming, uploading large files

Study Series No. 7 | BROADBAND                                                                                                                    3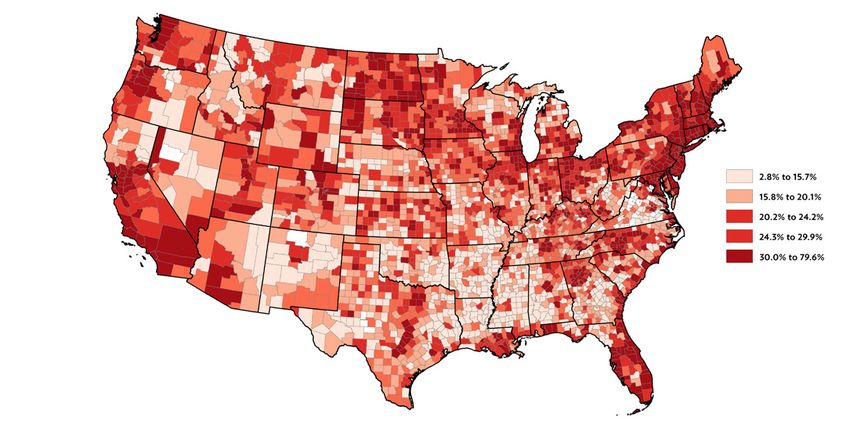
TYPES OF BROADBAND                                                                          The advantage of wireless is not needing a physical
                                                                                            connection (wires or cables) to connect to the internet,
CONNECTIONS
                                                                                            which is especially advantageous where terrain precludes
There are several different means or technologies that                                      laying fixed wire.
homes and businesses use to connect to broadband internet
                                                                                            Fixed wireless technology is distinct from the hardwired
including fiber, cable, DSL (digital subscriber line), wireless
                                                                                            technology that connects to a wireless router (i.e., WiFi),
(fixed and mobile) and satellite (Table 2). Some of these
                                                                                            common in many homes and businesses, which then casts a
technologies are better-suited for high-speed service than
                                                                                            wireless signal to nearby devices (e.g., computer, television,
others. Fiber, or fiber-optic, is currently viewed as the most
                                                                                            or cell phone). When parents take children to McDonalds
preferred as it carries the greatest potential for transmitting
                                                                                            or the library parking lot to access the internet, it is through
large amounts of information (data). Cable uses the same
                                                                                            WiFi, the wireless signal shared through the business’s router.
coaxial cables that many households use for cable television
                                                                                            In this case, the business has a hardwired connection coming
and is considered suitable for most broadband connections.
                                                                                            to the building which is then cast to patrons, usually in the
DSL is also a wired technology but uses traditional
                                                                                            restaurant or parking lot, through a wireless signal to use
copper telephone lines and is generally the least preferred
                                                                                            on their devices. Several public libraries, particularly in the
when compared to fiber or cable. Fiber, cable, and DSL
                                                                                            context of COVID-19, are similarly expanding the availability
technologies are considered fixed (i.e. stationary) wire-type
                                                                                            of their wireless signal to people who may use it from the
internet technologies, which are considered superior to
                                                                                            parking lot or nearby seating area, as an example.
satellite or cellular technologies. Fixed wireless technology
is based on radio links and is generally connected to a fixed                               Another common form of wireless broadband access is
connection. For example, Northern Michigan University                                       through cellular service plans for smartphones. While
brought broadband to several rural towns by using fixed                                     cellular service is adequate for e-mail, streaming videos,
wireless technology mounted to a water tower or other                                       and browsing the internet, it is not suitable for many uses,
infrastructure that casts a signal to nearby neighborhoods.

TABLE 2                  TYPES OF BROADBAND CONNECTIONS

 Faster             Fiber                  A wired technology, generally viewed as the most preferred option for broadband. It uses
                                           fiber-optic cable to transmit large amounts of information. The infrastructure is relatively
                                           expensive to build.
                    Cable                  Cable uses the same coaxial cables, another wired technology, that deliver picture and
                                           sound to television sets to support broadband.

                    DSL                    Also a wired technology, DSL uses traditional copper telephone lines already connected
                                           to homes and businesses. Speed may vary with distance from the home to the nearest
                                           equipped telephone facility.

                    Wireless               Wireless connections use a radio link to connect between residences or businesses and
                                           the provider’s facility. Available to fixed locations as well as across broader regions via a
                                           cell phone, for example.

                    Satellite              A type of wireless broadband using the satellite technology used for telephone and
 Slower                                    television service. It is viewed as useful for getting service to remote or low-density areas.

Source: (1) Federal Communication Commission. “Types of Broadband Connections.” July, 23, 2014. Available at: https://www.fcc.gov/general/types-broadband-connections.
        (2) “Broadband Reference Guide: A Digital Resource for Stakeholders.” Broadband & E-Commerce Education Center. University of Wisconsin Extension Madison. January, 2014.
            Available at: https://cced.ces.uwex.edu/files/2018/07/007.010.2014-Broadband-Reference-Guide.pdf

4                                                                                                                                     The Wisconsin Economy | 2021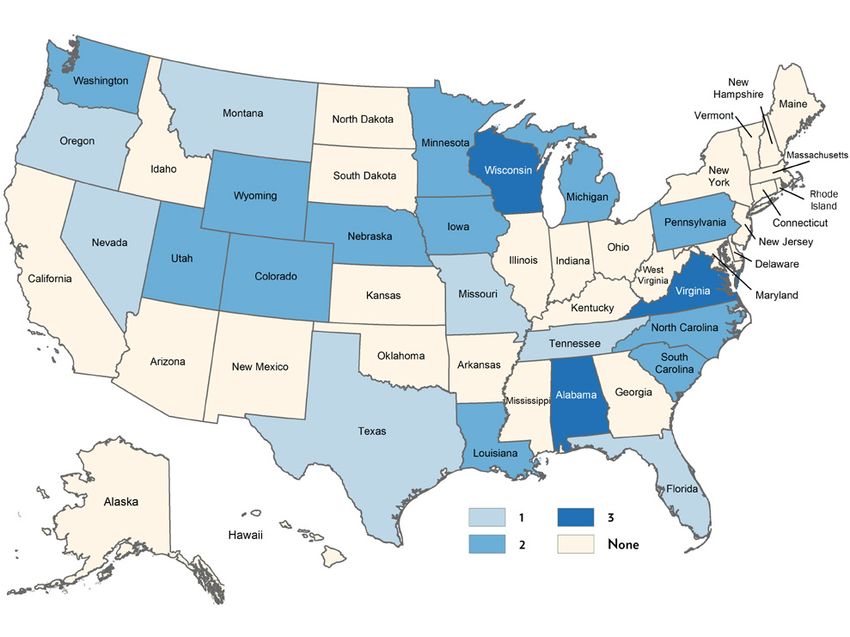
particularly for businesses. In addition, cellular service requires data
plans that can be expensive or that throttle speeds once certain data
thresholds are met. The data plans dictate how much information can
be either downloaded or uploaded to the internet. Some smartphones
can be used as “hotspots,” which allow computers and other devices to
utilize the phones’ wireless signals. These have proven to be popular for
business travelers, but they are extremely data-intensive, particularly if
the user is uploading or downloading large files or video-conferencing.
This method can also be very expensive. Additionally, cellular and fixed
wireless technologies can face challenges from topography that creates
line-of-sight issues between towers and users. In general, a smart-phone
is not viewed as a long-term solution to inadequate broadband access at
home or for a business.

The final type of connection to the internet is via satellites and, for
many rural residents and businesses, it is the only option available.
The advantage of satellite connections to the internet is that it is
independent from physical wires (fiber, cable, DSL) and thus can be
placed anywhere; this also means that it is often quicker to recover from
natural disasters, which can cause breaks in physical wires. For example,
in August 2020 a derecho storm broke Iowa’s main fiber line resulting
                                                                                “Fiber, or fiber-
in multi-day outages and disruptions in wired internet as well as cellular    optic, is currently
service, which relies on the main wired fiber line. The service is also
suitable for browsing the internet, email, and streaming simple videos.          viewed as the
However, satellite connections can have serious limitations. Satellite          most preferred
is generally considered an inferior option when connecting to the
internet and is unsuitable for many situations, particularly in terms of         [technology]
the demands of businesses, telecommuting, or distance education.
For example, many service providers readily admit that satellite is not        as it carries the
suitable for online gaming because of short delays that can disrupt the
gaming experience. This is also troublesome for video conferencing
                                                                              greatest potential
that is growing in popularity as a means of communicating. This is
a result of high latency, or the “ping factor,” which refers to the fact
                                                                               for transmitting
that the data flow must travel to the satellite in low earth orbit (22,230    large amounts of
miles) and return; even at the speed of light, that causes a noticeable
difference. Satellite is also unreliable with respect to topography and      information (data).”
poor weather conditions. Finally, satellite is noticeably more expensive
than wired (fiber, cable, DSL) options. Many satellite connections
operate in a similar fashion to cellular phone plans related to the volume
of data that can be downloaded or uploaded. Video-conferencing, for
example, is extremely data-intensive and the costs of “data overages”
can be prohibitively high.

Study Series No. 7 | BROADBAND                                                                      5
BROADBAND INFRASTRUCTURE large volumes of electricity over great distances and are
connected to regional distribution networks, which are
then connected to neighborhood distribution networks and
The physical infrastructure between the provider and the individual homes and businesses. The backbone would be
consumer that is necessary for broadband is often thought the high voltage powerlines, the middle mile would be the
of in three segments: the backbone, the middle mile, and the regional distribution network, and the last mile would be the
last mile (Figure 1). The backbone, usually fiber optic and neighborhood system of powerlines.
capable of large volume data transmission, is owned by private
providers or commercial, government, academic, and other A major breakdown in broadband connectivity, particularly
networks. This could be the infrastructure that connects the in less densely populated areas, is in the last mile, or the
Twin Cities to Milwaukee, Chicago, and other large cities. connection from the regional or neighborhood network
The middle mile links the backbone to the Internet Service to homes. For example, many smaller communities have
Provider’s (ISP) or telecommunications provider’s main a sufficient population density to make an investment in
network. The middle mile can connect anchor institutions broadband infrastructure a viable business decision for service
in some communities so that they can share applications, providers. But, immediately outside of that community,
infrastructure, and other resources. The middle mile can the investment in the last mile to more distant homes and
be thought of as the network that connects individual businesses is not cost effective for the service provider. This
neighborhoods within a city. The last mile connects individual can be compounded in areas that have an abundance of lakes
homes and businesses to the middle mile, or the network and rivers or more mountainous terrain. This physical distance
within a neighborhood. for farmers and businesses “on the edge of town” places them
at a comparative disadvantage. For many rural Wisconsin
One can think of broadband infrastructure as parallel to how residents, these last two geographical features, distance and
electricity is distributed: high voltage powerlines transport terrain, can be particularly difficult to overcome.
FIG 1 BROADBAND INFRASTRUCTURE
Figure reproduced from “Broadband Reference Guide: A Digital Resource for Stakeholders.” Broadband & E-Commerce Education Center. University of Wisconsin Extension Madison.
January, 2014. https://cced.ces.uwex.edu/files/2018/07/007.010.2014-Broadband-Reference-Guide.pdf
6 The Wisconsin Economy | 2021B R OA D B A N D I N W I S C O N S I N A N D
A C R O S S T H E U. S .
ACCESS BY UNITED STATES COUNTY
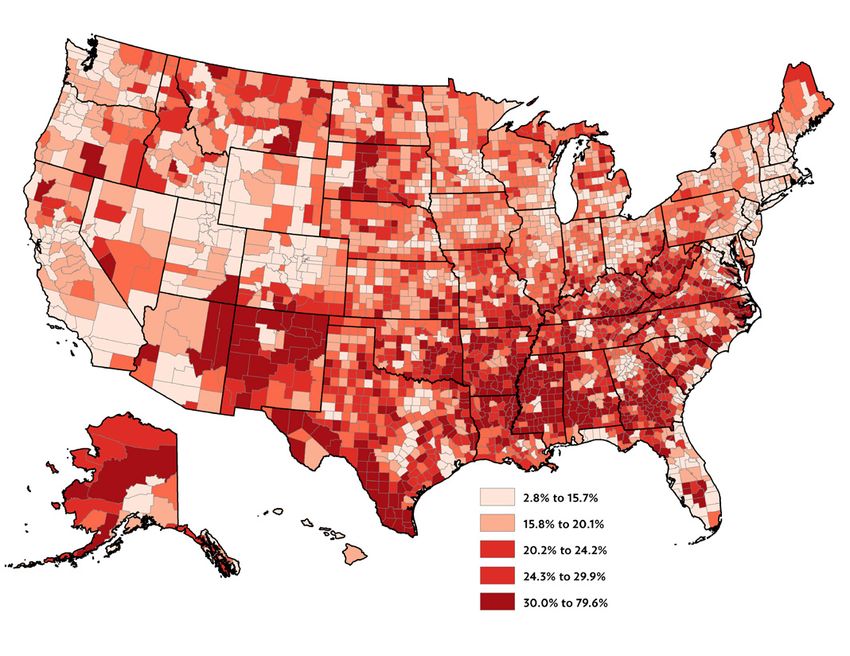
Across the U.S. and in Wisconsin, there are broad swaths of households still without access to broadband internet. Map 1
and Map 2 consider access to broadband (using the federal 25/3 Mbps definition) according to FCC Form 477 data. (We
use Form 477 data excluding satellite given the aforementioned challenges with satellite technology.) The spatial pattern
is clear when looking at the national distribution of persons with access to broadband (Map 1). There are clusters of low
access in the many parts of the southern U.S., particularly parts of the Mississippi Delta region (e.g., Mississippi, Louisiana,
Arkansas, Alabama), southern Georgia and northern Florida, along with pockets in Appalachia, the western Great Plains
and parts of the Mountain West (e.g., Nevada).
SHARE OF POPULATION WITH ACCESS TO
MAP 1
BROADBAND (25/3 MBPS) BY U.S. COUNTY
Study Series No. 7 | BROADBAND 7SOURCES OF BROADBAND DATA
There are two primary sources of data on the availability of the internet,
and specifically access to broadband: the U.S. Census Bureau’s American
Community Survey (ACS) and the Federal Communication Commission
(FCC) through Form 477 reporting requirements.
American Community Survey
The ACS data is based on surveys of households, and is thus dependent
upon the accuracy of the respondents. For the analysis provided in
this study, we use 5-year averages which, over the 2014 to 2018 period,
provide a sufficient sample to infer estimates for every county in the U.S.
Internet access refers to whether or not a household uses or connects to
the internet, regardless of whether or not they pay for the service to do
so. Internet access does not necessarily mean that they meet the current
25/3 Mbps speed reqirements to be labeled broadband. Data about
internet access was collected by asking if the respondent or any member
of the household accessed the internet.
FCC Form 477 June 2019 Data
The FCC data are particularly important because they are used to
determine the eligibility of communities and their service providers for
federal grants. For example, the eligibility rules for the federal ReConnect
Program administered through the U.S. Department of Agriculture
are built upon the data from Form 477. The data are aggregated from
census block data where providers report whether they can or do serve at
least one location in a given census block. The FCC Form 477 data can
overestimate access as there may be addresses or locations within a given
census block that do not have access. Furthermore, upload and download
speeds are based on advertised speeds, not necessarily actual speeds
reported by users. We do not include satellite access as part of the data
given the aforementioned challenges with satellite technology.
8 The Wisconsin Economy | 2021ACCESS BY WISCONSIN CENSUS TRACT
More specific to Wisconsin, there is lower access to broadband in the less populous northern portion of the state (Map 2).
The Northwoods region features smaller communities, seasonal tourism, and recreation. Indeed, prior research on
recreational housing (e.g., Winkler, Deller and Marcouiller 2015) reveals that there is considerable overlap between
recreational housing density and lack of access to broadband. There is also evidence of lower rates of access to broadband
in the Driftless region of southwestern Wisconsin and the central part of the state.
SHARE OF POPULATION WITH ACCESS TO BROADBAND
MAP 2 (25/3 MBPS) BY WISCONSIN CENSUS TRACT
JUNE 2019 FCC FORM 477 DATA, NOT INCLUDING SATELLITE
Study Series No. 7 | BROADBAND 9ACCESS BY RURALITY of residents have access to broadband, whereas in the
most rural counties in the U.S., just 68.8 percent of the
AND TECHNOLOGY
population has access to 25/3 broadband. In Wisconsin,
The clusters of low broadband access observed in 16 counties fare worse than the national average of
Map 1 and Map 2 are at least partially associated with these most remote, rural counties. Among these, in
rurality—less populous areas are less likely to have Price, Forest, and Rusk Counties, less than half of the
broadband internet. If we group U.S. counties by their population has access to broadband. Menominee County
population sizes, there is a clear pattern within the data is just below the threshold at 68.3 percent.
(Figure 2). Here, counties are classified across nine
If we lower the threshold of internet access to 10/1 Mbps,
different population classifications, known as Rural-
which is sufficient for e-mailing, webpage viewing,
Urban Continuum Codes, from the largest metropolitan
and listening to internet radio, but is insufficient for
counties that have a population of one million or
streaming videos or video-conferencing, 87 percent of
more, to the most rural counties that have no places
the population in the most rural counties in the U.S. have
(towns/villages) with more than 2,500 persons and are
access. Rural counties are more likely to rely on non-
not adjacent to a metropolitan area. Wisconsin, for
wired technologies for internet access, which improve
example, has five counties that fit into the “most rural”
coverage but are relatively slow compared to other
category: Florence, Forest, Iron, Price and Vilas. The
technologies. The prevalence of non-wired technologies
most urban counties are those that are near or part
in rural areas may partly explain the relatively better
of the Minneapolis-St. Paul, Milwaukee and Chicago
coverage at low speeds in rural areas (see Figure 3) .
Metropolitan Statistical Areas such as St. Croix,
Ozaukee, and Kenosha Counties. If we increase speed thresholds to 100/10 Mbps, which many
maintain will be required in the near future, only 46.5 percent
In general, across the U.S., access to broadband and
of the population in the most rural counties have access.
speed declines with rurality, meaning households in
These patterns reveal two important observations: (1) lack
the most remote counties are the least likely to have
of access to broadband (25/3 Mbps) is predominately a rural
broadband, especially faster speeds of broadband (see
issue and (2) Wisconsin tends to fall below national averages in
Appendix for analysis of Wisconsin Counties alone).
terms of access.
On average, in the most urban counties, 92.3 percent
ACCESS TO BROADBAND (25/3 MBPS)
FIG 2
ACROSS U.S. COUNTY URBAN-RURAL CONTINUUM
10 The Wisconsin Economy | 2021One of the major differences in access to the internet
is that there is more than one technology that can be
used. One of the advantages of the datasets used in
this analysis is that they detail the type of technology
used. As outlined above, these are hard wired
technologies (fiber, cable and DSL) as well as wireless
technologies (satellite and cellular). Using the same
“...the more rural a county, the
rural-urban classification scheme as in Figure 2, we more likely it is to go without
find that the more rural a county is on the rural-urban
continuum, the more likely it is to go without internet, internet or to rely on a less-
or to rely on a less-preferred technology, namely
satellite or cellular access (i.e., smartphones) as shown preferred technology, namely
in Figure 31. In the most rural areas, or those with the
smallest populations and far from a metro area, more
satellite or cellular...”
than one in four residents have no internet. Note that
even in the category of counties where the greatest
share of households has service (metro areas with a
million population or more), 18.7 percent still report
having no access to the internet.
PERCENT OF U.S. POPULATION WITH A NON-FIXED
FIG 3
WIRED TECHNOLOGY OR WITHOUT INTERNET
1
Note that Figure 2 and Figure 3 use different data sets and thus relay different, though related, information. The FCC data in Figure 2 conveys access in the area from the
provider’s perspective, but not usage or adoption. For example, in the most rural communities close to 90% of the population has access to 10/1 service. Figure 3 uses Census data
from the perspective of the household. In the most rural communities, roughly 30% of households report no access to internet, meaning they go without internet in their home.
Taken together with the FCC data, this may mean that some households do not subscribe to service even though it is available, perhaps because they have little demand or the
expense is burdensome. It may also be an indicator that the FCC data overstate coverage.
Study Series No. 7 | BROADBAND 11ACCESS BY POPULATION DENSITY
With rural counties at a clear broadband disadvantage, it
suggests that population density is key to understanding “With rural counties
broadband access. In Figure 4, a simple scatterplot of
Wisconsin counties relating the percent of households with at a clear broadband
access to broadband and population density reaffirms that
population density is a key factor. It suggests that, at low levels
disadvantage,
of density, small increases in the number of people per square it suggests that
mile correspond, at most, to modest increases in broadband
access. Only as population density gets above 60 people per population density is
square mile is there a strong upward (positive) relationship
between density and broadband access. This implies that
key to understanding
population density plays an important role in understanding broadband access.”
access to broadband and the challenges for improving access
in the most rural parts of the country.
ACCESS TO BROADBAND (25/3 MBPS)
FIG 4
BY WISCONSIN COUNTY POPULATION DENSITY
12 The Wisconsin Economy | 2021LACK OF ACCESS
As an alternative to looking at access based on reporting by service-providers, we next consider
how households describe their service using ACS data. First, in Map 3, we consider the share of
households that report no access to internet—a complement to the perspective offered in Map 1.
Importantly, in many pockets of the Deep South, large shares of the population indicate having no
access, along with places in the West that are closely aligned with Native American reservation lands.
Again, the Northwoods of the upper Midwest also has higher rates of no internet access.
SHARE OF HOUSEHOLDS WITHOUT INTERNET ACCESS
MAP 3
BY U.S. COUNTY
Study Series No. 7 | BROADBAND 13In Wisconsin, we clearly see that households in rural areas are Wisconsin are also much more likely to report a lack of internet
more likely to report a lack of access to the internet (Map 4). access. Households in rural areas, however, are not alone in
Many census tracts in northern Wisconsin have high shares of their lack of internet access. Many census tracts in metro areas
households without internet access; see Ashland, Sawyer, Rusk, also show high shares of households without internet, such as
Price, Florence, Forest, and Marinette Counties. Households census tracts in the urban cores of Milwaukee, Madison, Green
in rural census tracts found throughout central and southwest Bay, and Racine.
SHARE OF HOUSEHOLDS WITHOUT INTERNET ACCESS
MAP 4
BY WISCONSIN CENSUS TRACT
14 The Wisconsin Economy | 2021While rural areas clearly have less internet access and density likely explain the high shares of households without internet
seems to be a key factor in explaining the disparity, it could access in the aforementioned urban census tracts in Wisconsin.
be due to other features of rural areas as well. For example, Thus, taking income into consideration highlights the extent to
rural areas tend to have lower education outcomes, fewer which low-income households across all types of communities
businesses, varying terrain conditions, and, importantly, lower do not have access to broadband. While low-income rural
incomes when compared to urban areas. It could be that households do lag low-income urban households, the disparity
inadequate broadband is associated with lower incomes, which between low-income and high-income households is generally
could partly explain the lack of service in rural areas. To look larger than that between urban and rural.
at the question of income as it relates to broadband access
across the rural-urban continuum, we again group counties The descriptive analysis suggests four general conclusions.
from the most rural to the most urban and create subgroups First, while there are pockets of Wisconsin that lack adequate
by household income within each category. The results, shown access to broadband (and the internet more generally),
in Figure 5, indicate that the income divide across broadband Wisconsin is ahead of some parts of the U.S., particularly the
access is perhaps starker than the rural-urban divide. (See Deep South states. Still, Wisconsin lags many comparable
Appendix for analysis of Wisconsin Counties alone.) regions such as New England and the Dakotas, for example.
Second, population density plays an important role in
Looking at counties by income alongside their position in understanding access to broadband as households in rural
the rural-urban continuum, a strong pattern emerges. The areas are less likely to have service. Third, household income
households earning less than $20,000 are far more likely to go is a key factor. Low-income households across the rural-urban
without broadband than higher-income households, regardless continuum are far less likely to have internet access compared
of rurality. Across the urban-rural continuum, between 40 and to high-income households. Finally, there are several rural
60 percent of these low-income households have no internet. counties in Wisconsin that compare well to national averages,
For households earning more than $75,000, between just 5 and such as Buffalo and Pepin, suggesting that there are means to
15 percent are without internet. These income differences also enhance broadband access even in rural regions.
PERCENT OF U.S. POPULATION WITHOUT INTERNET
FIG 5 ACCESS BY HOUSEHOLD INCOME ACROSS
U.S. COUNTY URBAN-RURAL CONTINUUM
Study Series No. 7 | BROADBAND 15HOW DID WE GET HERE?
While the gaps in broadband service are clear, the reasons why
service has not reached all regions of the state and country are varied
and more complicated. Population density or rurality, infrastructure
expense, data limitations, and legal structures all play a part,
depending on the location. One of the central arguments behind AN EXAMPLE OF COSTS
the pattern of low broadband access in relatively rural parts of the
country shown in Map 1 focuses on population density. For internet
While cost estimates vary, this example
service providers (ISPs), investments in broadband infrastructure
demonstrates how the cost per subscriber of
are weighed against the customers and revenue they can gain. The
rural provision can be an order of magnitude
argument is that the return on investment (ROI) in low population
greater than in urban areas.
areas is insufficient to warrant large investments. The lower the
population density, the greater the cost of the last mile investment A 2014 report from a technology consulting
comes into play. This has been a major rationale behind numerous company estimated costs of broadband
federal and state broadband initiatives, to help offset these low ROIs. infrastructure using fiber technology in
a range of settings with varying terrain
The geographical terrain also plays an important role. Consider
and population density. They estimate,
Richland County, WI which has a population density of about 31
for example, $85,000 per mile for new
people per square mile but broadband access of only 52.1 percent,
underground construction (CTC Technology
which is relatively low compared to similarly dense counties in
and Energy, 2014). If new infrastructure
the state. One explanation for the difference in access may be
is needed for overhead or aerial strands,
topography or terrain. Richland County is in the heart of the
they estimate $51,000 per mile. If current
Driftless region, which has a very uneven landscape with low rolling
telephone wires are already in place, they
hills. In this type of geography, the cost of building the last mile
estimate $12,000 per mile in a rural area and
can be particularly high because building broadband infrastructure
$15,000 per mile in an urban area.
in challenging terrain can require additional or more expensive
construction and expertise. For providers, the additional cost may Internet service providers are concerned with
sufficiently lower the return on infrastructure investment to deter the potential return on investment (ROI)
expanding service. when they make fiber installation expenses
and thus weigh the potential revenue from
In addition to terrain, expanding access can be expensive because
new consumers, including take rate, against
ISPs are often augmenting existing infrastructure. Specifically, they
the expense of the infrastructure. The costs
are using existing telephone poles to carry the necessary broadband
of new investment in urban areas can be
infrastructure (such as fiber) to new consumers. Unless the ISP
spread over more customers. For example,
already owns the poles (as utility co-ops in Wisconsin sometimes
spending $12,000 per mile in Richland
do), they have to pay pole attachment fees, which can range from $6
County at 31 people per square mile is
per pole for regulated fees up to $15 per pole for the typical co-op
roughly $387/person. In Outagamie County,
owned pole (Connelly 2019). At roughly 18 poles per mile, these
at 277 people per square mile, the cost per
rental fees accumulate quickly.
person, even using the more expensive
Population density, terrain, and existing infrastructure are not the urban area cost, is roughly $54/person.
only barriers to broadband service provision; the percentage of
potential subscribers offered the service that actually subscribe is
also a factor. This percentage of subscribers is known as the take
rate. The take rate affects the ROI—the higher the take rate, the
higher the ROI. To break even, ISPs generally seek a 30-50 percent
take rate. Communities demonstrating that they will have a high take
rate may be more likely to receive high-speed, fixed internet service.
Communities with a notable share of households that are less likely
to use the internet, such as those with a large Amish population, may
need to consider other strategies to address take rates.
16 The Wisconsin Economy | 2021The price of internet access for consumers can be a barrier,
particularly for lower income households, and, in some
communities, may help us understand a low take rate. There
is potential for fiber nearly everywhere, but it is not always “...access to broadband is not
at a price that would make it affordable to residents without sufficient for homes to utilize the
subsidies or government investment. Even where the more service—it must also be affordable.”
affordable physical infrastructure is already in place, the costs
of hookups, data plans, and broadband subscriptions can be
a barrier to access. While prices vary by service provider and
the characteristics of individual packages, one might expect
to pay $40 per month or more for broadband services, which the Broadband Deployment Accuracy and Technological
may be cost prohibitive for low-income households. This is Availability (DATA) Act was signed into law on March 23, 2020
an important observation because it means that access to by President Trump. Unfortunately, these new data will not be
broadband is not sufficient for homes to utilize the service—it available for some time.
must also be affordable. The cost of the service, regardless
of location, is likely a barrier for many households. This In addition to the coverage discrepancies, internet service
affordability concern is particularly significant when one providers often misreport key pieces of information on the
considers that the primary way to move out of poverty is form. For example, there are cases of ISPs reporting speed
to invest in education. Increasingly, investing in education, rates as Kbps (thousands of bits per second) but Form 477
retraining, and professional development requires access to uses Mbps (millions of bits per second). Second, while ISPs
broadband internet. The poverty trap appears to deepening. are required to submit Form 477 twice a year, it takes the FCC
an average of about a year and half to compile and report the
In sum, as a consequence of the high cost and low density of data. Thus, the most current data is already out of date when
service provision, the ROI of the last mile for the ISP can be it is published. Finally, the data only indicate the advertised
very low, if not negative. There are instances of customers available maximum download and upload speeds, which likely
who have asked to be connected and are provided initial cost does not reflect the typical speeds experienced by customers,
estimates of thousands of dollars or more to lay the required especially those in rural areas. Some ISPs advertise one speed
lines. Most Wisconsin residents cannot afford such an expense. rate (the maximum) but guarantee a lower rate. In reality, few
households may be getting the faster advertised speed. When
There are several grant programs geared towards alleviating they report, even if only one customer in an area is provided
these cost barriers to broadband access. Most recently, the with the faster speed, then all customers in the area are
CARES Act included $100 million in grants through USDA’s considered to have access to the same speed.
Rural Utility Service. Prior to ther CARES Act, the USDA
prioritized broadband through the 2019 Farm Bill and through In addition to the challenges of using Federal data to establish
its 2018 ReConnect program which provided $600 million in need, these grant applications can be somewhat cumbersome
grants and loans and was recently expanded with a second and limit applicants to certain types of entities, such that those
round of $550 million in funding. with industry savvy are often the best equipped to apply. The
result is that commercial providers are often awarded these
These programs, however, can be difficult to access and grants and their incentives are to build out service not to the
implement. First, applicants must demonstrate need in order most remote locations, but instead to the relatively densely
to qualify and be competitive for grants and loans, but the populated rural areas leaving many still without coverage. As
most commonly used Form 477 data from the FCC generally a result, the most remote locations may not only lack service
overstate coverage, which makes it difficult to definitively show but their opportunities for future provision are limited since
a lack of service. As noted before, the FCC Form 477 data the more densely populated neighboring regions, or those
requires providers to list census blocks and report whether they that may be important for making service feasible across the
can or do serve at least one location in a given census block. broader area, already have service. The result is that the most
For rural census blocks at the periphery of a community, this sparsely populated and least feasible regions are left without
may mean that, if a provider offers service to one home, which access. Even if providers opt out of providing service to denser
is most likely close to town, it can report service and speed for rural regions, they may choose upgrades that improve low-
the entire block based on the one house it serves. Accordingly, speed service to existing clients. Even with such upgrades,
this requirement leads the Form 477 data to generally overstate however, it is possible that service is still slow compared to
the availability of broadband. With the aim of addressing this other regions, thus little is done to narrow service gaps.
data limitation, among other concerns with the Form 477 data,
Study Series No. 7 | BROADBAND 17FEDERAL COST OF IMPLEMENTATION OF
FIG 6 ANALOGOUS INFRASTRUCTURE
IN BILLIONS OF DOLLARS. INFLATION ADJUSTED FOR 2017
Before the Telecom Act of 1996,
almost all subsidies occurred
outside of government funding
mechanisms, in the form of
regulated rates and other fees.
Figure reproduced from Low, S.A. “Rural Development: Perspectives from my Federal and State - Local Experiences,” April, 6, 2019. Presidential Address. Southern
Regional Science Association
While increased spending at the federal level may help to the problem of high-cost/low-density. According
expand access, we should consider the size of investment to BroadbandNow, Wisconsin is one of 22 states with
that may be required to have equitable access. While the statutes that impose bureaucratic roadblocks to municipal
recent federal investments are significant, a comparison to broadband—often viewed as the result of telecom lobbying
analogous infrastructure spending shows that broadband (Map 5)2. Recent research shows that these types of barriers
investment is modest. Figure 6 suggests that the federal have a negative impact on broadband availability (Whitacre
cost of broadband is dwarfed by the cost of electrification. and Gallardo 2020). Interestingly, the number of states with
The cost of the highway system was at least several times these bureaucratic barriers has decreased in recent years
more than what has been spent on broadband so far. as some states have sought to remove barriers to provision
(Whitacre and Gallardo 2020).
Finally, many states have legal barriers to municipal
broadband. Municipal broadband is that which is owned Wisconsin does permit municipalities, as opposed to
or operated by a public entity and offers service within a private companies or cooperatives, to run broadband
particular jurisdiction. Municipal broadband is one potential utilities3. However, grandfather clauses notwithstanding4,
strategy when commercial ISPs do not invest, often due the statutes impose administrative and economic barriers
2
See, as examples:
Strauss, Daniel. (2018, July 31). Lobbyists and location stymie rural America’s quest for broadband. Washington Examiner. Retrieved from https://www.
washingtonexaminer.com/business/lobbyists-and-location-stymie-rural-americas-quest-for-broadband
Brodkin, Jon. (2014, Feberuary 12). ISP lobby has already won limits on public broadband in 20 states. Ars Technica. Retrieved from https://arstechnica.com/tech-
policy/2014/02/isp-lobby-has-already-won-limits-on-public-broadband-in-20-states/
Bader, Emily. (2011, November 11). How the Telecom Lobby is Killing Municipal Broadband. Bloomberg. Retrieved from https://www.bloomberg.com/news/
articles/2011-11-04/how-the-telecom-lobby-is-killing-municipal-broadband.
3
Wis. Stat. 66.0422(2)
4
Wis. Stat. 66.0422(3)(3n)
18 The Wisconsin Economy | 2021to municipalities doing so. Wisconsin is just one of three process. Moreover, the exemptions to the feasibility study
states with three identified barriers (funding barriers, are a significant burden because they require that no other
competition barriers, and bureaucratic barriers) which entity provide telecommunications service in the area,
make it functionally impossible for a municipality to build regardless of the quality, speed, or price of the service.
and provide broadband service to its citizens at a price
its citizens can afford. For example, the statutes require In the alternative, the municipality may ask private
onerous and expensive feasibility studies and long, drawn broadband providers, and only if they refuse, will the
out public notice periods5. If the municipality undertakes municipality be permitted to set up broadband services,
a feasibility study, there are some considerations. First, the but only within the boundaries of the municipality6. A third
study may show that building and providing broadband possibility is that municipalities may build a broadband
to citizens is prohibitively expensive. Second, if it is service but not operate the service, and they may only do so
feasible, the municipality’s feasibility study and business if such service would not compete with any other service.7
plan are public record due to the public hearings, which In any event, even if the municipality manages to run this
can motivate a private company to enter the market and operational gauntlet, they may not subsidize the service and
provide service before the municipality can finish the must provide it at a price to “exceed its total service long-
run incremental cost.”8
NUMBER OF STATE BARRIERS TO MUNICIPAL BROADBAND
MAP 5
FUNDING, COMPETITION, AND BUREAUCRATIC BARRIERS
5 7
Wis. Stat. 66.0422(2)(a)(b)(c) Wis. Stat. 66.0422(3m)
6 8
Wis. Stat. 66.0422(3d) Wis. Stat. 196.204(2m)
Study Series No. 7 | BROADBAND 19RELATIONSHIPS TO ECONOMIC AND plots) is useful in showing the relationships between access to
broadband, community level growth and development, and
COMMUNITY WELL-BEING
overall well-being. Nonetheless, these relationships between
Research has consistently found a strong positive relationship broadband and community and economic development may
between internet access, particularly broadband, and economic be misleading. In particular, there may be other factors at play
growth and development. In a study of OECD countries, that are distorting our conclusions. Based on a wealth of prior
Czernich and colleagues (2011) found that a 10-percentage research we also know that many of our measures of regional
point increase in broadband penetration raised annual per economic growth and development and community well-being
capita growth by 0.9–1.5 percentage points. Koutroumpis are tied to population density and income, just as broadband
(2009), also studying more advanced economies in Europe, seems to be. So, for example, it could be that the appearance
found that density of internet connectivity not only increases of a relationship between broadband and a given measure
growth in GDP but also increases what economists refer to of well-being is really based on an underlying relationship
as an agglomeration effect. In other words, increased density between income and well-being.
of broadband improved the comparative advantage of the
In other words, there exists a very real possibility that the focal
economy, which reinforces economic growth. In a review of
indicators (employment, education, health) considered in the
U.S. focused broadband studies, Holt and Jamison (2009)
correlation analysis that appear to be driven by broadband
found consistent evidence that expanding access to the
are really driven by population density and/or income. That
internet and broadband enhances economic growth.
is, access to broadband and the internet is not really the
Studies that focus on more rural areas within the U.S. find that causal factor, but rather a reflection of population density
access to broadband is important in attracting new businesses and income. To explore if this is indeed the case and prevent
(Kim and Orazem 2017), fostering entrepreneurship (Alderete drawing incorrect conclusions about the economic impacts of
2017; Conroy and Low 2020; Cumming and Johan 2010; broadband, we also use a more formal econometric analysis
Deller, Whitacre and Conroy 2019; Mack, Anselin and that explicitly controls for population density and income to
Grubesic 2011), enhancing farm profits (Kandilov, Kandilov, better isolate the the influence of broadband on key economic
Liu and Renkow 2017) and even increasing the value of rural variables. 9
housing (Deller and Whitacre 2019). It is clear from the
academic research that access to the internet and broadband
in particular is no longer a luxury, but a necessary condition for BROADBAND INDEX
regional economic growth and development.
The Broadband Index simplifies the process of
In considering the economic impacts of broadband, we elected measuring access to broadband and internet by
to construct a Broadband Index for each county in the U.S. compiling four data points into one measure for each
that utilizes four primary access data points: the FCC share U.S. county. These data points are:
of population with access to broadband (25/3 Mbps), the
• The FCC share of population with access to
ACS percent of households without access to internet, and,
broadband (25/3 MBPS)
as indicators of poor access, the shares of households that
use each satellite and cellular (smartphones) only for access • The ACS percent of households without access to
to the internet (see Appendix). For our Broadband Index, internet
higher values are associated with more access to the internet
while lower values are associated with lower access. We then • The shares of households that use each satellite
examine the relationship of this index to several regional and cellular (smartphones) only for access to the
conditions: population and employment growth, educational internet
attainment and human capital, and health outcomes.
Higher Broadband Index values are associated with
We first consider these relationships using a simple correlation more access to the internet.
analysis. The correlation analysis (depicted using scatter
9
The results of this additional regression analysis are provided in the Appendix, where we report the standardized regression coefficients so that the magnitude of the
estimated coefficients can be directly compared. Note that population density, measured by the percent of the county population that does not live in an “urban place”
(i.e., any municipality for Census reporting purposes that has a population greater than 2,500 is defined as an “urban place”), is statistically meaningful in helping us
understand five of the six community well-being measures—all but the college educated share of the population. More rural places tended to have lower growth rates
in population and employment between 2010 and 2018, higher 3rd grade reading test scores, and better self-reported health outcomes. Median household income
does help us understand patterns in all six of our measures of community well-being. Across all measures, higher median income is associated with better community
outcomes: greater growth, higher levels of human capital, and better health conditions. A simple comparison of the relative sizes of the standardized regression
coefficients implies that income has a stronger effect on community well-being than the degree of ruralness.
20 The Wisconsin Economy | 2021You can also read