BROKEN PLATE THE The State of the Nation's Food System - Food Foundation

 
CONTINUE READING
BROKEN PLATE THE The State of the Nation's Food System - Food Foundation
THE
    BROKEN
    PLATE
    2021
    The State of the
    Nation’s Food System

Ten vital signs documenting the health of our
food system, how it impacts on our lives, and why
we must change the food environment so that it
delivers healthy and sustainable diets for everyone
BROKEN PLATE THE The State of the Nation's Food System - Food Foundation
CONTRIBUTORS
                           A massive thank you to all of our contributors, without whom Broken Plate would not be possible

                                                                                                                                                                                                                       FOREWORD
                                                                                                                                                                                                                       ‘We’re all in this together’ was a frequently cited mantra in the early days of the Covid-19 pandemic. Except, as it turned
                                                                                                                                                                                                                       out, we weren’t. Covid-19 not only shone a spotlight on a number of pre-existing inequalities in the UK but served to fur-
                                                                                                                                                                                                                       ther exacerbate many of them.

                                                                                                                                                                                                                       People living in the most deprived communities were around four times as likely to die from Covid-19 over the course
                                                                                                                                                                                                                       of the pandemic as those living in the least deprived areas (Resolution Foundation, 2021). Risk of dying among those
                                                                                                                                                                                                                       diagnosed with Covid-19 was also higher in those in Black, Asian and Minority Ethnic groups than in White ethnic groups
                                                                                                                                                                                                                       (Public Health England, 2020a). Black, Asian and Minority Ethnic groups were also twice as likely to have experienced food
                                                                                                                                                                                                                       insecurity compared to White households during the pandemic (Food Foundation, 2021). In January 2021, adults identi-
                                                                                                                                                                                                                       fying as being limited a lot by health problems or a disability were five times more likely to be food insecure than those
                                                                                                                                                                                                                       without, and 10% of households with children reported food insecurity (Food Foundation, 2021). People on low incomes
                                                                                                                                                                                                                       were three times as likely to have been furloughed as high earners and four times as likely to have lost their jobs in the first
                                                                                                                                                                                                                       phase of the crisis (Bell, 2020).

                                                                                                                                                                                                                       As policymakers and businesses look ahead to the post-pandemic recovery, tackling dietary inequalities, which are often
                                                                                                                                                                                                                       closely linked to other health and economic inequities, has been recognised as a public policy imperative. The Nuffield

                                                                           THANK YOU
                                                                                                                                                                                                                       Foundation is an independent charitable trust whose purpose is to advance social well-being in the UK. We were one of
                                                                                                                                                                                                                       the original funders that established the Food Foundation in 2015 and are pleased to be funding its ‘Changing the Story on
                                                                                                                                                                                                                       Dietary Inequality’ programme over the next three years. This programme aims to reshape the public narrative on dietary
 Huge thanks to Nye Cominetti, Elena Salazar, Dr Thomas Burgoine, Matthew Keeble, Debbie Bremner, Sonia Pombo, Holly Gabriel,                                                                                          inequality and be the catalyst for purposeful action by policymakers and businesses.
 Dr Kawther Hashem, Caroline Hancock, Dr Kate Ellis, Dr Jean Adams and Dr Bernadette Moore for their support and expert analysis.
                                                                                                                                                                                                                       The Broken Plate is the Food Foundation’s flagship report and will form a central pillar of its work on dietary inequality. This
                              With special thanks to Dr Carmelia Alae-Carew and Dr Tim Lobstein for their input, analysis and
                                                                                                                                                                                                                       report highlights how the food environment is skewed towards less healthy options, with healthier foods much less acces-
                                                            advice as part of this year’s report.
                                                                                                                                                                                                                       sible and affordable for those on lower incomes. This in turn leads to disparities between the health of adults and children
                                                                                                                                                                                                                       in lower income households and their wealthier peers. Those living with obesity and nutrition-related chronic diseases
                                                                                                                                                                                                                       such as type 2 diabetes and hypertensive diseases were at greater risk of severe outcomes as a result of Covid-19, high-
                                                                                                                                                                                                                       lighting the significant public health impact of poor diets in the UK (Public Health England, 2020a). Through this report,
                                                                                                                                                                                                                       and its broader programme of work, the Food Foundation builds the evidence and connects this data to people’s lives, by
                                                                                                                                                                                                                       giving a voice to those experiencing dietary inequality as an everyday reality.

                                                                                                                                                                                                                       The government’s most recent obesity strategy published in July 2020 included proposals to remove price promotions
                                                                                      WITH THANKS TO                                                                                                                   on foods high in salt, sugar and fat, and restrict advertising online. With the publication of part two of the National Food
                                               The Nuffield Foundation, for their support in making this work possible.                                                                                                Strategy expected shortly, this is the first time in 75 years that a ‘farm to fork’ review of England’s food system has been
                                                                                                                                                                                                                       undertaken. The Broken Plate puts forward the case for why there must be fundamental policy changes in our approach
    The Nuffield Foundation is an independent charitable trust with a mission to advance social well-being. It funds research that                                                                                     to the food environment if we are serious about improving the nation’s health and addressing the wider questions of social
 informs social policy, primarily in Education, Welfare, and Justice. It also funds student programmes that provide opportunities for
                                                                                                                                                                                                                       well-being that follow from it.
  young people to develop skills in quantitative and scientific methods. The Nuffield Foundation is the founder and co-funder of the
 Nuffield Council on Bioethics, the Ada Lovelace Institute and the Nuffield Family Justice Observatory. The Foundation has funded
this project, but the views expressed are those of the authors and not necessarily the Foundation. Visit www.nuffieldfoundation.org                                                                                    The Nuffield Foundation commends the Food Foundation for the rigour of its research and its impact on public policy and
                                                                                                                                                                                                                       the public debate.

                                                                                                                                                 white
                                                                                                                                                                                                                       TIM GARDAM
                                                                                                                                                                                                                       Chief Executive of the Nuffield Foundation.
                       FOOD FOUNDATION AUTHORS                                                                                             REPORT DEISGN
                      Rebecca Tobi, Shona Goudie, Isabel Hughes                                                                        whitecreativecompany.co.uk

ONS CROWN COPYRIGHT INFORMATION This work contains statistical data from ONS which is Crown Copyright. The use of the ONS statistical data in this work does not imply the endorsement of the ONS in relation to the
interpretation or analysis of the statistical data. This work uses research datasets which may not exactly reproduce National Statistics aggregates.

                                                                                                                                                                                                                                                                                                                       THE BROKEN PLATE 2021 | Food Foundation   3
BROKEN PLATE THE The State of the Nation's Food System - Food Foundation
Introduction
    Each year our Broken Plate
                                              AT A GLANCE                                                THEME
                                                                                                    Make healthier
                                                                                                                       ● METRIC 1: ADVERTISING Advertising spend on fruit and vegetables remains very
                                                                                                                      low, with just 2.5% of total food and soft drink advertising spend going towards fruit and
    report assesses whether
                                              What’s changed since 2020’s report?                   options more      vegetables.
    progress has been made                                                                           appealing
    against ten metrics, which
    were selected to provide a                ●   IMPROVEMENT
    holistic picture of the food
    system, encompassing the food
                                              ●   NO CHANGE                                              THEME        ● METRIC 2: THE AFFORDABILITY OF A HEALTHY DIET The poorest fifth of UK

    environment, drivers of food              ●   DETERIORATED                               £
                                                                                                        Make          households would need to spend 40% of their disposable income on food to meet
    choice, and the impact of the                                                                     healthier       Eatwell Guide costs. This compares to just 7% for the richest fifth.
    food system on our health and                                                                   options more
                                                                                                                      ● METRIC 3: FOOD PRICES More healthy foods are nearly three times as expensive
    the environment.                                                                                 affordable
                                                                                                                      as less healthy foods calorie for calorie.
    We have organised these
    metrics into four focus areas,                                                                                    ● METRIC 4: WAGES 25% of workers in the food sector earn the minimum wage or
    highlighting the changes that                                                                                     below compared to 11% of workers across the UK.
    are needed if we are to support
    everyone in being able to eat a
    healthy diet. Traffic light scores
    have been assigned to each                                                                           THEME         ● METRIC 5: PLACES TO BUY FOOD 1 in 4 places to buy food are fast food outlets. The
    metric, measuring any progress                                                      £               Make          proportion of fast food outlets is higher in the most deprived local authorities compared to
    made over the past year                                                                         healthier and     the least deprived.
    between  Broken Plate 2020                                                                      sustainable
    and this year’s report.                          “Location, income                              options more      ● METRIC 6: PRODUCTS WITH TOO MUCH SUGAR 96% of yogurts and 92% of cereals

                                                     can affect your                                  available
                                                                                                                      marketed towards children contain high or medium levels of sugar.
    New in this year’s report, we
    include summaries of the policy                  chance of life…                                                  ● METRIC 7: PRODUCTS WITH TOO LITTLE VEG 22% of ready meals are vegetarian or plant-
    interventions which aim to                       And it's just                                                    based, with a welcome drop in price for vegetarian and plant-based meals since last year’s survey.
    drive progress. The last three                   such a shame
    metrics assess the health                        that we have to
    outcomes which stem from our
    current food environment as                      live in a country                                   THEME         ● METRIC 8: CHILDHOOD OBESITY Children in the most deprived fifth of households are
    a whole, rather than looking at                  where this is                                     Act now        almost twice as likely to have obesity as those in the least deprived fifth of households by
    the drivers of poor diets, and                   happening.”                                     and address      age 4–6.
    we have therefore not included
                                                     YOUNG FOOD                                    inequalities so
    policy summaries in these                                                                       that everyone      ● METRIC 9: CHILD GROWTH Children in the UK at age 4-5 are on average shorter
                                                     AMBASSADOR
    sections.                                                                                      has the chance     than children in other comparable high income countries. In England, children living in
                                                                                                                      deprived communities are shorter than children living in wealthier communities by the
    This year, we have also included                                                                  of a longer
                                                                                                                      time they reach age 10-11.
    the voices of our  Children’s                                                                   healthier life
    Right 2 Food Young Food                                                                                           ● METRIC 10: DIABETES There are almost 10,000 diabetes-related amputations carried
    Ambassadors and Peas Please                                                                                       out on average per year, an increase of 24% in the past five years.
     Veg Advocates from England
    speaking about the issues
    explored within this report. Both
    groups of citizens support the                                                              TRAJECTORY            By the time they’re 65 years old, over half of the children born in 2021
    Food Foundation in our mission
    to deliver a sustainable food
                                                    “We need to change the subsidies        What does the future      will experience diet-related disease which may affect their quality of
                                                                                             hold for the health of   life. Whether children are born into richer or poorer households greatly
    system that creates health and                   round, don’t we? We need to make       children born in 2021?    impacts on their risk of obesity as well as limiting life expectancy.
    well-being for all by sharing their              the healthy food the easy option
    own thoughts and experiences.                    and the cheaper option.”
    We are extremely grateful for
    their support.                                    VEG ADVOCATE

4   Food Foundation | THE BROKEN PLATE 2021                                                                                                                                 THE BROKEN PLATE 2021 | Food Foundation        5
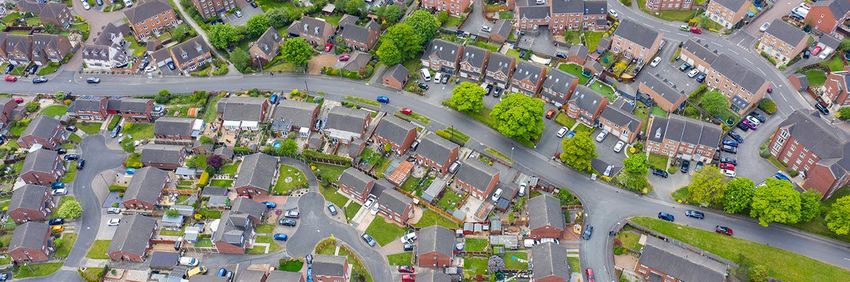
BROKEN PLATE THE The State of the Nation's Food System - Food Foundation
THEME:
                                              Make healthier options
                                              more appealing

                                              • METRIC 1: ADVERTISING
                                               Advertising and marketing mean that before we even decide what to eat, we’re influenced by mass
                                               media. People are constantly confronted with advertising for less healthy foods on social media,
                                               online and on TV (ASA, 2018). Evidence shows this has a direct (and indirect) impact on how much
                                               we eat (Critchlow et al., 2020). Moreover, children and adults from lower socio-economic groups are
                                               50% more likely to be exposed to ads for HFSS (high fat, salt and/or sugar) foods than those from
                                               higher socio-economic groups (Yau et al., 2021). Campaigns like Veg Power and ITV’s Eat Them to
                                               Defeat Them have shown that advertising healthier foods can have a positive effect on sales. We
                                               need to make it easier for people to make healthier choices by addressing the current imbalance in
                                               advertising spend between healthy and less healthy foods.

                                                         “What advertisers will do as well is blame individuals for
                                                         the choices we are making as do the government in a lot of
                                                         their campaigns. It’s like this is your choice, you’re making
                                                         the bad choice and you’re choosing these things, but
                                                         actually that’s not what happens, it’s not the individuals, it’s
                                                         the subliminal messaging and it’s the food environment.”
                                                          VEG ADVOCATE

6   Food Foundation | THE BROKEN PLATE 2021                                                                           THE BROKEN PLATE 2021 | Food Foundation   7
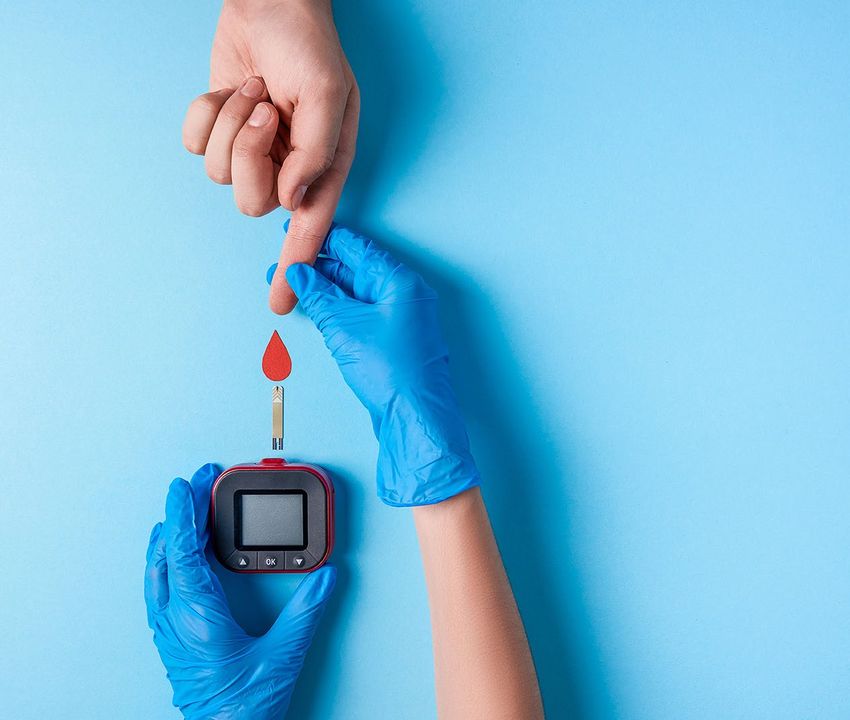
BROKEN PLATE THE The State of the Nation's Food System - Food Foundation
●        METRIC                                                                                                                                                                                                              THEME
    ●                           Advertising: We need more advertising of healthy foods
    ●           01              and to restrict advertising of foods high in fat, salt and sugar
                                                                                                                                                                                                                            MAKE HEALTHIER
                                                                                                                                                                                                                        OPTIONS MORE APPEALING

ADVERTISING
                                                                                                                                                        WHAT’S HAPPENING?
                           Advertising spend on fruit and vegetables remains very low, with                 WHAT DID WE DO?                             Advertising spend on foods high in salt, fat and sugar continues to be much higher
                                                                                                            We analysed data on advertising             than spend on fruit and vegetables. Despite a small but promising uplift in spend on
                           just 2.5% of total food and soft drink ad spend going towards fruit              spend in the UK for food and soft           fruit and veg advertising as a proportion of total food and soft drink advertising spend
                           and vegetables.                                                                  drinks (Nielsen Ad Intel, 2020),            between 2017 and 2019, in 2020 this dropped back down to 2017 levels. Overall, there
                                                                                                            covering advertising in cinema,             are no strong trends – spending on each of the four categories as a proportion of total
                                                                                                            direct mail, door drops, outdoor,           advertising spend has remained much the same over time, with only marginal changes
                                                                                                            press, radio and TV. We calculated          in either direction between 2017 and 2020.
                                                                                                            the percentage of advertising spend
                                                                                                            on four different categories of food        Although proportionally there have not been any major shifts in spend for our four
                                                                                                            and drink – fruit and vegetables,           categories, Covid-19 does appear to have impacted on advertising spend for some
                                                                                                            confectionary, sweet and savoury            individual products. Ad spend on home baking and cake mixes increased by 107%
                                                                                                            snacks, and soft drinks – comparing         between 2019 and 2020, while – perhaps unsurprisingly – spend on popcorn dropped
                                                                                                            ad spend for the three years                by 82% and spend on party snacks by 60%.
                                                                                                            between 2017 and 2020 where we
                                                                                                            have data.                                  Covid-19 also significantly impacted on total UK ad spend. Advertising revenue in
                                                                                                                                                        traditional media dropped by an estimated 20% in 2020 (Emarketer, 2020a), in part
                                                                                                                                                        driven by the closure of cinemas and less Out of Home advertising. Although digital
                                                                                                                                                        advertising (which is not included here) has risen during the pandemic (Emarketer,
                                                                                                                                                        2020b), it is unlikely that the ratio of spend on healthier foods compared to less healthy
                                                                                                                                                        foods is any different online. Young people aged under 18 in Britain are exposed to an
                                                                                                                                                        estimated 15 billion online ads for foods high in sugar, salt and fat every year (nearly
                                                                                                                                                        500 adverts per second) (Bite Back 2030, 2021).

                                                                                                                                                                                             “Young people during lockdown –
                                                                                                                                                                                             we just lived online lives. So while
    The proportion of ad spend on our four categories over time                                                                                                                              I’m doing online school I’m also
                                                                                                                                                                                             seeing ads for Just Eat, Deliveroo,
                                                                                                                                                                                             McDonalds, KFC next to me….so
                                                                                                                                                                                             100% it’s only gotten worse over
                                                                                                                                                                                             lockdown.” YOUNG FOOD AMBASSADOR

                                                                                                                       IS POLICY SUPPORTING PROGRESS?
                                                                                                                       In recent years several new policies have been proposed or       advertisements (in 2020). In the 2021 Queen’s Speech the
                                                                                                                       implemented which aim to reduce advertising for unhealthy        government confirmed that they would be proceeding
                                                                                                                       food. This is positive, but as most policies in this space are   with both these policies, though formal responses to the
                                                                                                                       quite recent, we have yet to see their impact.                   two consultations have not yet been published. Some local
                                                                                                                                                                                        areas have also taken action. In 2018 the Mayor of London
                                                                                                                       In 2007 the government limited advertising of junk food          announced that junk food advertising would be banned
                                                                                                                       on children’s TV channels and during TV programmes               on the entire Transport for London (TfL) network from
                                                                                                                       ‘directed to or of particular appeal to’ children. Since then    February 2019, and in early 2021 Bristol Council announced
                                                                                                                       the government has consulted on a 9pm watershed on               that they would be restricting advertising for junk food on
                                                                                                    With
                                                                                                   thanks              broadcast TV (in 2019) and a total online ban for junk food      council-owned spaces and on billboards.
    Source: Nielsen Ad Intel, 2017;2019;2020                                                         to

8    Food Foundation | THE BROKEN PLATE 2021                                                                                                                                                         THE BROKEN PLATE 2021 | Food Foundation      9
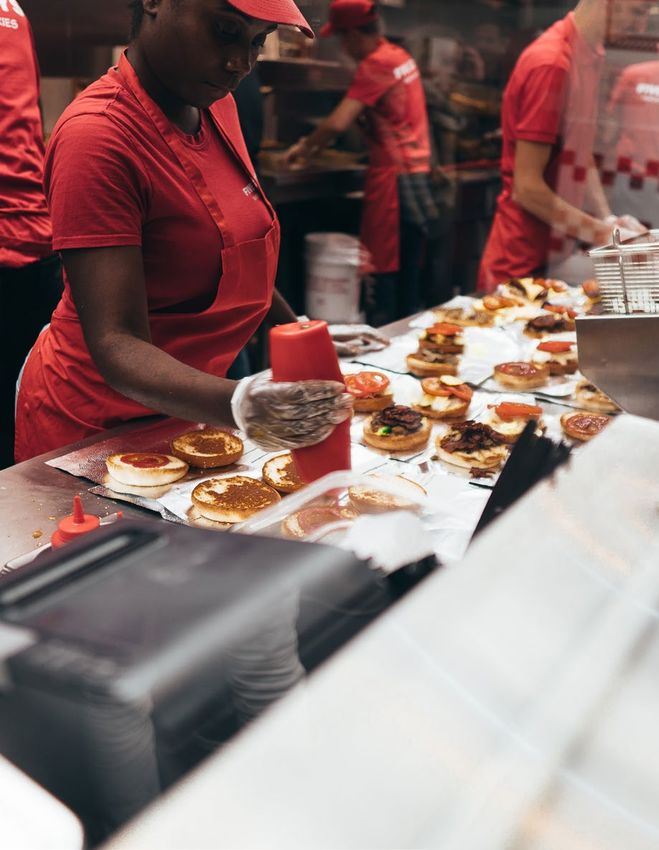
BROKEN PLATE THE The State of the Nation's Food System - Food Foundation
£

                                                                           THEME:
                                                                           Make healthier options
                                                                           more affordable

                                                                           • METRIC 2: THE AFFORDABILITY OF A HEALTHY DIET
                                                                            When we decide what to buy, we’re influenced by what we can afford. Many people in the UK have
                                                                            insufficient incomes due to low or precarious wages, as well as high outgoing costs of housing
                                                                            and other essentials. This means that very little money is left over after bills are paid, with the food
                                                                            budget often the easiest one to cut. Skipping meals or opting for the cheapest, most filling options –
                                                                            which are often the least healthy – has to suffice.

                                                                           • METRIC 3: FOOD PRICES
                                                                            What we decide to buy is often influenced by price. Shoppers routinely say price is the most
                                                                            important factor driving their food choices (IGD, 2015). We need to ensure that people aren’t
                                                                            incentivised to buy less healthy food because it is more affordable. We need to rebalance the
                                                                            relative cost of healthy and less healthy foods.

                                                                           • METRIC 4: WAGES
                                                                            Perhaps ironically, the people who work in the food industry are typically on very low wages. One
                                                                            in seven people had jobs in the food industry before Covid-19 (GOV.UK, 2020), but this sector has
                                                                            one of the highest rates of low paid jobs, in addition to having been heavily impacted by restrictions
                                               “ People can make the        during the pandemic. Given how important the food industry is for the UK’s economy, the people
                                               choice, but… depending       working in it deserve adequate pay.
                                               on your income you’re
                                               not going to be able to
                                               make those (healthier)
                                               choices, so it’s trapping
                                               everyone into making
                                               the same food choices ”             “And I think even if we have cheaper food compared to the rest of
                                               YOUNG FOOD AMBASSADOR               the world, it’s not really comparable, in a way because you have to
                                                                                   think about what people can actually afford here.” VEG ADVOCATE

10   Food Foundation | THE BROKEN PLATE 2021                                                                                                          THE BROKEN PLATE 2021 | Food Foundation   11
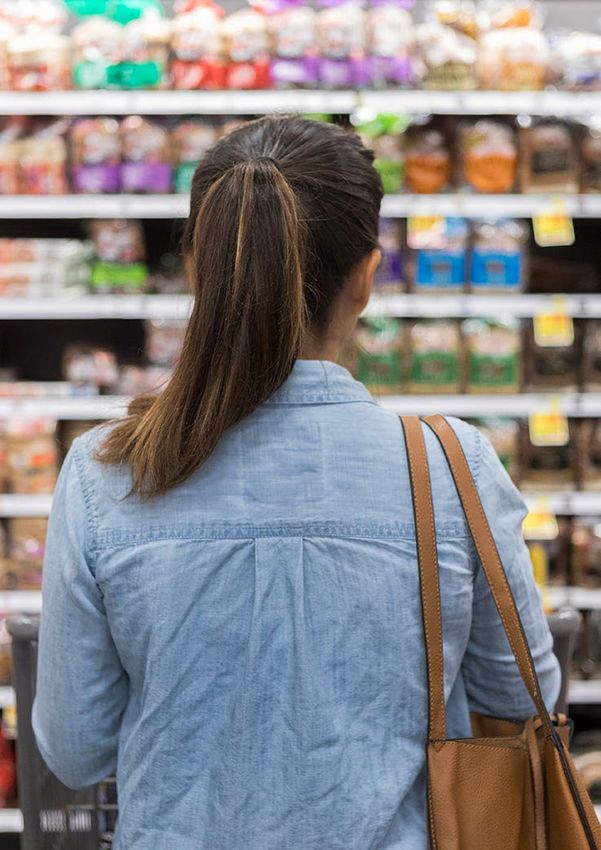
BROKEN PLATE THE The State of the Nation's Food System - Food Foundation
METRIC                                                                                                                                                                                                          THEME
 ●                             Affordability of a healthy diet:
 ●            02               Ensure that a healthy diet is an affordable diet
 ●                                                                                                                                                                                                                 MAKE HEALTHIER OPTIONS
                                                                                                                                                                                                                     MORE AFFORDABLE

AFFORDABILITY OF                                                                                                WHAT DID WE DO?
                                                                                                                                                                    WHAT’S HAPPENING?
                                                                                                                                                                    A stark difference is still apparent between the share of disposable

A HEALTHY DIET
                                                                                                                We used data on household income                    income that the lowest income groups must spend on a healthy diet
                                                                                                                (Households Below Average Income) from              compared to wealthier households. This year we calculate that the
                                                                                                                the Family Resources Survey for 2018/19 to          poorest fifth of households would have to spend 40% of their disposable
                                                                                                                look at the affordability of the Eatwell Guide,     income to meet the government’s recommended diet, compared to
                                                                                                                comparing the data to preceding years. This is      39% in last year’s analysis. Simultaneously, the wealthiest fifth saw the
                                                                                                                the government’s official guidance on a healthy     proportion of disposable income which they would have to spend fall
                             The poorest fifth of UK households would need to spend 40% of their                diet and includes those foods considered            from 8% according to last year’s analysis to 7% this year – a statistically
                             disposable income on food to meet Eatwell Guide costs. This compares               essential for a balanced and nutritious diet.       significant drop. As we have looked at data up until 2019 for this year’s
              £                                                                                                 The estimated cost of the Eatwell Guide (£5.99      report, it remains to be seen what impact the pandemic will have –
                             to just 7% for the richest fifth.                                                  per day) is based on optimisation modelling         something we will be exploring in next year’s report.
                                                                                                                previously commissioned by Public Health
                                                                                                                England in 2016, with optimisation undertaken
                                                                                                                in order to minimise deviation from current
                                                                                                                dietary patterns (Scarborough et al., 2016).
     Percentage of disposable income* used up if
     the cost of the Eatwell Guide was spent by all                                                             We then adjusted this cost based on household
     households, by income quintile                                                                             composition, as well as economies of scale
                                                                                                                that might affect the overall cost of food.
                                                                                                                The proportion of disposable income (after
                                                                                                                housing costs were removed) that would be
                                                                                                                used up by the recommended diet was then
                                                                                                                calculated, in line with previous methodology
                                                                                                                (Scott, Sutherland and Taylor, 2018). Data
                                                                                                                were analysed by income quintiles, which
                                                                                                                provide a more balanced view than income
                                                                                                                deciles. This is because the lowest income

                                                                                                                                  “And I dunno about the rest of you but I’ve got a family and y’know
                                                                                                                                  I don’t have a high income but I moan constantly how much of my
                                                                                                                                  salary goes on food and y’know it’s a massive proportion…Personally
                                                                                                                                  I feel that half of the money I earn goes onto food.” VEG ADVOCATE

                                                                                                                decile is made up of a diverse group of people,
                                                                                                                including some with little or no income as well                    IS POLICY SUPPORTING PROGRESS?
                                                                                                                as some in less precarious financial situations                    Several existing government schemes seek to make
                                                                                                                who may be between jobs or living on savings.                      healthy food more accessible to those living on a low
                                                                                                                Unfortunately, it is not possible to further                       income. These include the Healthy Start scheme (Best
                                                                                                                segregate this group by socio-economic status.                     Start Foods in Scotland), the School Fruit and Vegetable
                                                                                                                People who are homeless, sleeping rough or                         Scheme (England only), Free School Meals, and the
                                                                                                                in institutional settings are not included in the                  Holiday Activities and Food programme (England only).
                                                                                                                Family Resources Survey.                                           Despite these measures, the data presented here show
                                                                                                                                                                                   that a healthy diet remains out of reach of many. A major
                                                                                                                                                                                   challenge is that the cost of a healthy and sustainable
                             £                                                                              £                                                                      diet is not currently accounted for by the government
                                                                                                                                                                                   when setting benefits levels and minimum wage levels.
     *after housing costs. Source: Secondary analysis of the Family Resources Survey, 2017/18 and 2018/19

12     Food Foundation | THE BROKEN PLATE 2021                                                                                                                                                   THE BROKEN PLATE 2021 | Food Foundation     13
BROKEN PLATE THE The State of the Nation's Food System - Food Foundation
METRIC                                                                                                                                                                                                                                                                           THEME
 ●                             Food prices: Make healthier
 ●             03              foods more affordable
 ●                                                                                                                                                                                                                                                                                  MAKE HEALTHIER OPTIONS
                                                                                                                                                                                                                                                                                      MORE AFFORDABLE

FOOD PRICES                                                                                                                                                                WHAT DID WE DO?
                                                                                                                                                                           The Centre for Diet and Activity
                                                                                                                                                                           Research (CEDAR) unit at the
                                                                                                                                                                           University of Cambridge built on
                                                                                                                                                                           food price research first conducted
                             More healthy foods are nearly three times as expensive as less healthy                                                                        in 2014 (Jones et al., 2014) and
                             foods calorie for calorie                                                                                                                     matched price data for the 79 food
                                                                                                                                                                           and drink items that have been
                                                                                                                                                                           continuously tracked by the Office       WHAT’S HAPPENING?
                                                                                                                                                                           for National Statistics’ Consumer        Food price is a major determinant of food choice, with price rises disproportionately
                                                                                                                                                                           Price Index (CPI) between 2010-          affecting lower income groups. The price of more healthy foods continues to remain
                                                                                                                                                                           2021 to food and nutrient data from      much higher than less healthy foods, with little change in the cost of different food
     Average price of foods per 1,000 calories using the Food Standards Agency’s nutrient profiling score category                                                         Public Health England’s National         groups between 2019 and 2021. The FSA’s nutrient profiling model reveals striking
                                                                                                                                                                           Diet and Nutrition Survey. Each item     differences, with more healthy foods almost three times more expensive than less
                                                                                                                                                                           was then assigned to a food group        healthy foods for the equivalent number of calories. The mean cost of more healthy
                                                                                                                                                                           and categorised as either ‘more          foods in 2020 per 1,000 kilocalories was £7.00, compared to £2.41 for less heathy foods.
                                                                                                                                                                           healthy’ or ‘less healthy’ using the     Breaking the data down into the government’s five Eatwell Guide food categories tells
                                                                                                                                                                           nutrient profiling model developed       a similar story. While the mean price of fruit and vegetables per 1,000 kilocalories was
                                                                                                                                                                           by the Food Standards Agency             £8.21 in 2020 (rising to £8.60 during the first quarter of 2021), the average price per
                                                                                                                                                                           (FSA). We also assigned each food        1,000 kilocalories of food and drinks high in sugar and/or fat was just £3.42 – 40% of
                                                                                                                                                                           in the CPI basket to one of the five     the cost of more healthy products.
                                                                                                                                                                           Eatwell Guide food groups to better
                                                                                                                                                                           understand the relative cost of the      Although these data show that the price of fruit and vegetables and other food groups
                                                                                                                                                                           different food categories. Using         fell during 2020, the CPI data do not reflect local differences in price. Perhaps more
                                                                                                                                                                           price per kilocalorie is a helpful way   significantly, the CPI does not capture all price reductions from promotions. Data
                                                                                                                                                                           to understand the relative prices        from the Institute of Fiscal Studies found the share of food transactions on promotion
                                                                                                                                                                           of foods which make up diets and         dropped by around 15% between March and May 2020 leading to grocery prices
                                                                                                                                                                           meals, rather than comparing             increasing by 3%, which is not reflected in the CPI prices (O’Connell and Jaravel, 2020).
                                                                                                                                                                           individual products within specific
                                                                                                                                                                           food categories.

     Average price of foods per 1,000 calories by Eatwell Guide food group                                                                                                 The CPI data for Q2 of 2020 (April                      IS POLICY SUPPORTING PROGRESS?
                                                                                                                                                                           to June) included a very high                           The government has introduced several new policies in recent years
                                                                                                                                                                           number of missing values due to                         which may help to start rebalancing the cost of more healthy vs. less
                                                                                                                                                                           food products being temporarily                         healthy foods, though more ambitious action is likely to be needed in
                                                                                                                                                                           out of stock during the first wave                      future. In 2018 the government introduced a levy on sugary drinks (24p
                                                                                                                                                                           of pandemic, and as a result prices                     per litre of drink containing more than 8g of sugar per 100ml, and 18p per
                                                                                                                                                                           in the CPI index do not reflect the                     litre of drink containing between 5–8g of sugar per 100ml). In 2020 the
                                                                                                                                                                           reality at the time. To deal with                       government also confirmed that it will be regulating to restrict promotions
                                                                                                                                                                           this missing data, basket prices for                    of foods high in fat, salt and sugar (HFSS) by volume online and in store –
                                                                                                                                                                           Q2 across all years analysed were                       prohibiting HFSS products to be offered as part of ‘buy-one-get-one-free’
                                                                                                                                                                           removed from this year’s analysis,                      and ‘3 for 2’ offers, or similar. In 2021 the value of vouchers issued through
                                                                                                                                                                           as doing so did not materially affect                   the Healthy Start scheme was increased from £3.10 to £4.25, enabling
                                                                                                                                                                           annual prices of previous years.                        low income pregnant women and care-givers of children under 4 to more
                                                                                                                                                                                                                                   easily afford healthier foods such as fruit, vegetables and pulses.

                                                                                                                                                                                     “When I tried to go get a salad, it cost three pounds, which I don’t have, but I
                                                                                                                                                                                     can go McDonald’s and get a burger for a pound which fills me up very well.”
                                                                                                                                                                   With               YOUNG FOOD AMBASSADOR
     Source: CEDAR analysis using Consumer Price Index (CPI) average retail price food indices, 2010–2021 (ONS). Please note all averages are unweighted means.   thanks
                                                                                                                                                                    to

14     Food Foundation | THE BROKEN PLATE 2021                                                                                                                                                                                                                   THE BROKEN PLATE 2021 | Food Foundation       15
BROKEN PLATE THE The State of the Nation's Food System - Food Foundation
METRIC                                                                                                                                                                                                                                                                            THEME
 ●                            Wages: Pay people working in
 ●            04              the food sector a fair wage
 ●                                                                                                                                                                                                                                                                                  MAKE HEALTHIER OPTIONS
                                                                                                                                                                                                                                                                                      MORE AFFORDABLE

WAGES                                                                                                                                                                      WHAT DID WE DO?
                                                                                                                                                                           Using 2020 data from the Annual
                                                                                                                                                                                                                      WHAT’S HAPPENING?
                                                                                                                                                                                                                      With Covid-19 having led to prolonged restrictions for the hospitality industry
                                                                                                                                                                                                                      throughout 2020, it is perhaps not surprising to see the Out of Home sector’s ‘annus
                                                                                                                                                                           Survey of Hours and Earnings               horribilis’ reflected in the data. While the proportion of workers paid the minimum wage
                                                                                                                                                                           (ASHE) dataset (ONS, 2020), the            or below increased across the UK economy in 2020, the increase was steeper among
                                                                                                                                                                           largest survey of employees in the         food sector workers. There was an 8 percentage point increase in the proportion of
                            In 2020, 25% of workers in the food sector earned the minimum wage                                                                             UK, the Resolution Foundation              food sector workers paid at or below the minimum wage between 2019 and 2020
                            or below compared to 11% of workers across the UK.                                                                                             analysed the pay of people in the          compared to a 4 percentage point increase for workers across the UK.
                                                                                                                                                                           UK’s food sector. We looked at
                                                                                                                                                                           the general picture for the sector         Research undertaken by the Food Foundation also found that levels of food
                                                                                                                                                                           overall, as well as pay for different      insecurity among workers in the food sector were much higher than the population
                                                                                                                                                                           industries, including agriculture          average during the pandemic, with 14% of food sector workers having experienced
                                                                                                                                                                           and fishing, waiting staff, food retail,   food insecurity in the six months to January 2020, compared to 9% of the general
                                                                                                                                                                           kitchen staff, catering,                                                                                population (Food
                                                                                                                                                                           food manufacturing                                                                                      Foundation, 2021).
                                                                                                                                                                           and food wholesale.
                                                                                                                                                                                                                                                                                      Although the percentage
                                                                                                                                           Low paid = paid less than 2/3   This year we followed                                                                                      of those paid below
                                                                                                                                           of overall median hourly pay
                                                                                                                                           Minimum wage or less =          the ONS’s approach                                                                                         the Real Living Wage
                                                                                                                                           paid less than age-relevant     with these data, which                                                                                     (a voluntary wage rate
                                                                                                                                           minimum wage plus 1%
                                                                                                                                           Real Living Wage = the          is that the numbers                                                                                        that takes into account
                                                                                                                                           London or Rest of UK rates      include furloughed                                                                                         the cost of living and
                                                                                                                                           were applied, depending on
                                                                                                                                           the location of the worker.     workers. This means it                                                                                     inflation) remained
                                                                                                                                                                           is quite hard to interpret                                                                                 broadly stable in
                                                                                                                                                                           the 2020 data; pay data                                                                                    2020, there are large
                                                                                                                                                                           is affected by some                                                                                        differences at an industry
     Proportion of employees in the UK paid below the real Real Living Wage by industry                                                                                    furloughed workers not                                                                                     level. 84% of waiting
                                                                                                                                                                           having pay topped up,                                                                                      staff were paid below
                                                                                                                                                                           but also by a greater                                                                                      the Real Living Wage in
                                                                                                                                                                           proportion of low paid                                                                                     2020, a figure which has
                                                                                                                                                                           workers losing their                                                                                       not moved much since
                                                                                                                                                                           jobs and therefore                                                                                         2012, compared to just
                                                                                                                                                                           dropping out of the                                                                                        under a quarter (24%)
                                                                                                                                                                           dataset. It is therefore difficult to      of workers in food wholesale. More companies ought to be encouraged to pay the Real
                                                                                                                                                                           confidently identify trends as we do       Living Wage, particularly those industries not so adversely affected by the pandemic
                                                                                                                                                                           not yet know which of those factors        – such as food retail. Certainly, data on the proportion of workers defined as low paid
                                                                                                                                                                           is dominating. As a result, while          (paid less than 2/3 of the median hourly wage) demonstrates the differing impact of
                                                                                                                                                                           have compared the data                     Covid-19 on food workers. While there was a fall in the proportion of low paid workers
                                                                                                                                                                           from 2020 to 2019’s data, we have          in food retail in 2020 – continuing the positive downward of the past eight years - and
                                                                                                                                                                           also included 2012 data to provide         manufacturing and wholesale remained broadly stable, the same does not appear to be
                                                                                                                                                                           some context in terms of longer-           true for waiting and kitchen staff and those in catering where the numbers defined as
                                                                                                                                                                           term trends.                               low paid appear to have increased between 2019 and 2020.

                                                                                                                                                                                       IS POLICY SUPPORTING PROGRESS?
     Please note: We have used the following codes to extract trend data from the ASHE database: Industry groups (SIC 2007 codes):                                                     The government’s National Living Wage (for workers            this remains well below the Real Living Wage as
     Agriculture and fishing: 1 excl 1.7; Food retail: 47.2 excl 47.26, 47.11 and 47.81; Food wholesale: 46.3 excl 46.35 and 46.17; Catering
     (bars and kitchens): 56. Occupation groups (SOC 2010 codes): Kitchen staff: 5434, 5435, 9272 Waiters & waitresses: 9273.                                                          over the age of 23) is currently set at £8.91 per hour        calculated by the Living Wage Foundation, which is
     A different process had to be used this year in obtaining the data which means there may have been slight differences in some                                                     and the National Minimum Wage (for workers age                currently set at £9.50 per hour nationally and £10.85
     of the cleaning and filtering processes used. Additionally, the ONS regularly revise and update their datasets, which means                         With thanks to
     that there are some slight discrepancies between the percentages reported in this year's Broken Plate and last year's report.                                                     21 and over) at £8.36 per hour. There is no higher            in London, and is applicable for all workers over the
                                                                                                                                                                                       weighting for London. Despite a recent increase,              age of 18.
     Source: Resolution Foundation analysis of ONS, Annual Survey of Hours and Earnings, 2012-2020.

16    Food Foundation | THE BROKEN PLATE 2021                                                                                                                                                                                                                     THE BROKEN PLATE 2021 | Food Foundation     17
BROKEN PLATE THE The State of the Nation's Food System - Food Foundation
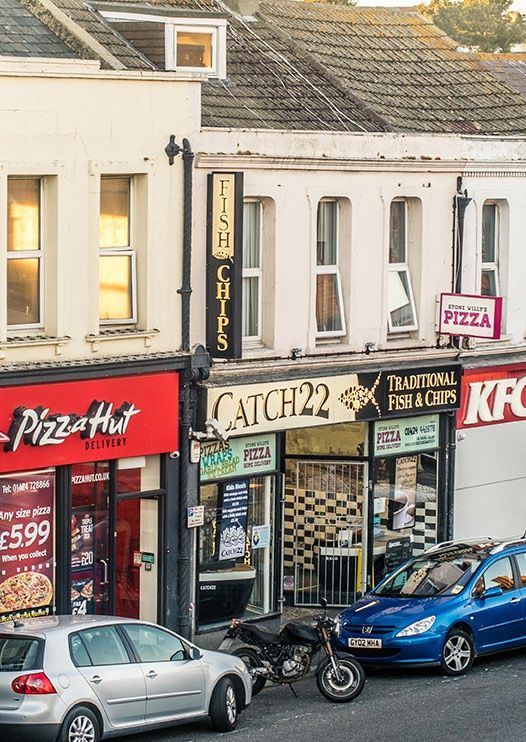
“If you’re busy, you’ve got kids,    “If I think to last year when I
             you want to get something            was doing a lot of train travel…
             quickly and get out the shop,        it used to drive me crazy
             I would say it takes a lot of        trying to eat healthy.... y’know,
             time and effort to be able to        between the combination of
             go through all the nutritional       trains and platforms on the
             content and decide which             station and landing at some
             is going to be best. And not
             everyone has the time to be able
                                                  hotel it was so hard not to buy
                                                  anything that wasn’t beige. And
                                                                                      THEME:
             to do that… you’re just going to
             pick the first one off the shelf ”
                                                  wasn’t really high in sugar. So
                                                  even with the best will in the      Make healthier and
                                                                                      sustainable options
             YOUNG FOOD AMBASSADOR                world you can take a packed
                                                  lunch for your first train
                                                  journey, but if you’re away for 2
                                                  or 3 days umm it’s pretty hard ”
                                                  VEG ADVOCATE                        more available

                                                                                      • METRIC 5: PLACES TO BUY FOOD
                                                                                       We’re influenced by what’s available in our local area. Living in areas with lots of takeaway outlets
                                                                                       is linked to a greater likelihood of having obesity (Burgoine et al., 2018). People are understandably
                                                                                       more likely to eat food which is convenient and readily available, so we need to ensure that healthy
                                                                                       food is included in this. It cannot be right that where people live affects their level of access to
                                                                                       healthier food.

                                                                                      • METRIC 6: PRODUCTS WITH TOO MUCH SUGAR
                                                                                       Our choices are influenced by the options available, not all of which are healthy. Many products
                                                                                       we routinely see on shelves are too high in fat, salt and sugar. If businesses reformulated the foods
                                                                                       which they sold, there would be less onus on individuals having to seek out information (and
                                                                                       decipher it) to determine whether what they are buying is harming their health or not.

                                                                                      • METRIC 7: PRODUCTS WITH TOO LITTLE VEG
                                                                                       Many meal options available have a high impact on the environment as well as our health. Eating
                                                                                       less meat and more veg can help to lower greenhouse gas emissions as well as having health
                                                                                       benefits in high income countries (Scheelbeek et al., 2020).

                                                                                         “I’m thinking of, at the top of our street, there’s maybe three or four
                                                                                         takeaways and a Sainsbury’s, but when I was growing up on the same
                                                                                         parade there was a bakery, a greengrocers and a fish mongers, they’ve
                                                                                         just all gone now they’re just replaced with fried chicken and Indian,
                                                                                         burger places, y’know and I always think we’re really missing a trick ”
                                                                                          VEG ADVOCATE

18   Food Foundation | THE BROKEN PLATE 2021                                                                                                                     THE BROKEN PLATE 2021 | Food Foundation   19
METRIC             Places to buy food: Use local authority town                                                                                                                                                                                                    THEME
 ●
 ●                             planning powers to reduce the availability of
 ●             05              unhealthy takeaways                                                                                                                                                                                                               MAKE HEALTHIER AND SUSTAINABLE
                                                                                                                                                                                                                                                                    OPTIONS MORE AVAILABLE

PLACES TO BUY FOOD                                                                                                                                                       WHAT DID WE DO?
                                                                                                                                                                         Working with the Food
                                                                                                                                                                         environment assessment tool
                                                                                                                                                                         (Feat) team from the University
                                                                                                                                                                         of Cambridge and using the same
                              1 in 4 places to buy food are fast food outlets. The proportion of fast                                                                    methodology as in previous years’
                              food outlets is higher in the most deprived local authorities compared                                                                     Broken Plate reports, we extracted
                              to the least deprived.                                                                                                                     and analysed data on the location
                                                                                                                                                                         of food outlets from Ordnance
                                                                                                                                                                         Survey’s Points of Interest
                                                                                                                                                                         dataset for June 2020. We then
                                                                                                                                                                         calculated takeaway food outlets
      Changes in proportion of food outlets that are fast food outlets from 2019 to 2020 (number of local authorities):
                                                                                                                                                                         as a proportion of all food outlets
                                                                                                                                                                         within local authorities in England.
         5% OR MORE
METRIC                                                                                                                                                                                                                                            THEME
 ●                    Products with too much sugar: Reformulate
 ●        06          products with too much sugar and too little fibre
 ●                                                                                                                                                                                                                                           MAKE HEALTHIER AND SUSTAINABLE
                                                                                                                                                                                                                                                OPTIONS MORE AVAILABLE

PRODUCTS WITH                                                                                                                          WHAT DID WE DO?
                                                                                                                                       Between March and May 2021,
                                                                                                                                                                             WHAT’S HAPPENING?
                                                                                                                                                                             Children’s cereals: There have been some small improvements in making breakfast cereals
                                                                                                                                                                             with packaging that may appeal to children less unhealthy. Positively, the proportion of these

TOO MUCH SUGAR
                                                                                                                                       Action on Salt and Action on          cereals that are classified as high in sugar using the government's Front of Pack nutrition
                                                                                                                                       Sugar collected data from             labelling guidance has decreased by 8 percentage points to 29%. However, the average
                                                                                                                                       nine major supermarkets (Aldi,        content per 100g has only reduced very slightly from 18.4 grams in 2020 to 18.0 grams in
                                                                                                                                       Asda, the Co-operative, Lidl,         2021. Unfortunately, the proportion of cereals that are high or medium in salt has remained
                                                                                                                                       Ocado – which covers Marks            relatively unchanged (60%), and the proportion low in fibre has increased (from 38 to 46%).
                                                                                                                                       and Spencer’s – Morrisons,
                     96% of yogurts and 92% of cereals marketed towards children                                                       Sainsbury’s, Tesco, and               Using the government’s traffic light labelling system, which categorises nutrients into high
                     contain high or medium levels of sugar.                                                                           Waitrose) to assess cereals           (red), medium (amber) and low (green), the majority would fail to obtain a green rating:
                                                                                                                                       and yogurts with child-friendly       92% failing for sugar, 60% failing for salt and 87% for fibre (using Action on Sugar’s cut-offs
                                                                                                                                       packaging. Due to pandemic            for fibre).
                                                                                                                                       restrictions, information was
                                                                                                                                       mostly collected online via           Some retailers have taken action to remove cartoon characters on packaging of cereals
                                                                                                                                       retailer websites – only Aldi         – however, many of these cereals still use packaging that is clearly designed to appeal to
     The proportion of breakfast cereals marketed at children categorised as high,                                                     and Lidl were collected in store.     children and so have been included in this analysis.
     medium and low in sugar, salt and fibre, 2019-2021.
                                                                                                                                       This time 126 breakfast               Children’s yogurts: This year, we have also looked at the sugar content of children’s yogurts.
                                                                                                                                       cereals qualified, and 100            Like cereals, many parents give yoghurts to their children in the belief that they are a healthy
                3%                                                                                                                     yogurts qualified. Products           option. However, only 4% of yogurts with packaging designed to appeal to children obtain
                                                                                                                                       were then assessed against            a green rating for sugar content under the government’s Front of Pack nutrition labelling
                                                                                                                                       the government’s Front                guidance. Per serving, the average total sugar content was 7.2g, which equates to 38% of the
                                                                                                                                       of Pack nutrition labelling           recommended sugar intake for 4-6 year olds and 30% for 7-10 year olds. But things are moving
                                                                                                                                       guidance. The data on cereals         in the right direction, with the average sugar content having decreased by 16% since 2016.
                                                                                                                                       has been compared to data
                                                                                                                                       from previous Broken Plate            While the average fat content of yogurts is generally low (77% obtain a green rating for
                                                                                                                                       reports to assess changes over        fat), the saturated fat content is less positive. 67% of yogurts with packaging appealing
                                                                                                                                       time. Data on yogurt has not          to children were either medium or high in saturated fat. As with sugar, this has improved
                                                                                                                                       previously been included in           slightly over the years showing a 10% reduction in average saturated fat content since
                                                                                                                                       Broken Plate, and so has been         2016. Although dairy products naturally tend to be relatively high in saturated fat, it is
                                                                                                                                       compared to research carried          interesting to observe that the two products with the highest saturated fat content were
                                                                                                                                       out by the University of Leeds        dairy-alternative products, which many believe to be healthier.
                                                                                                                                       between 2016 and 2019 (Moore
                                                                                                                                       et al., 2020).                        Unlike with children’s cereals, there have been no commitments in removing cartoon
                                                                                                                                                                             characters on packaging.

                                                 1%       1%        1%

                                                                                                                                                  IS POLICY SUPPORTING PROGRESS?
                                                                                                                                                  Two key government policies have been introduced to            committed to further action if results are not seen’.
                                                                                                                                                  encourage businesses to reduce the levels of sugar in
     The proportion of                                                                                                                            their products.                                                In 2018 the voluntary reduction programme was followed
                                         4%
     yogurts marketed                                                                                                                                                                                            by a new levy on sugary drinks (24p per litre of drink
                                                                          Key: High (red), medium (amber) and
     at children                                                          low (green) colour coding for salt,         With thanks to              In 2016 the government challenged industry to voluntarily      containing more than 8g of sugar per 100ml, and 18p
     categorised as                                                       sugar and saturated fat are based
                                                                                                                                                  reduce sugar levels across a variety of product categories     per litre of drink containing between 5-8g of sugar per
                                                                          on the government's Front of Pack
     high, medium and                                                     nutrition labelling guidance. High                                      by 20% by 2020. By 2019 (the third year of the                 100ml). This has been more successful – the amount
     low in sugar and                                                     (green), medium (amber) and low
                                                                                                                                                  programme) an average reduction of just 3% across the          of sugar purchased by households through soft drinks
                                                                          (red) colour coding for fibre based on
     saturated fat in                                                     Action on Sugar's criteria                                              relevant categories had been achieved (13% on breakfast        fell by 10% in the year following its introduction, due to
     2021                                                                 Colour coding source: Department of                                     cereals, yoghurts, fromage frais). The government              manufacturers reformulating their products to avoid the
                                                               2%         Health and Social Care. Guide to creating
                                                                          a front of pack (FoP) nutrition label for                               indicated in their 2020 Obesity Strategy that they will        levy and consumers switching to lower sugar alternatives
                                                                          pre-packed products sold through retail                                 continue to work with industry voluntarily but ‘remain         (Pell et al., 2021) (CEDAR).
                                                                          outlets. 2013.

22   Food Foundation | THE BROKEN PLATE 2021                                                                                                                                                                                  THE BROKEN PLATE 2021 | Food Foundation      23
METRIC                                                                                                                                                                                                                              THEME
 ●                          Products with too little veg: Reformulate
 ●            07            products so they contain more veg
 ●                                                                                                                                                                                                                                 MAKE HEALTHIER AND SUSTAINABLE
                                                                                                                                                                                                                                      OPTIONS MORE AVAILABLE

PRODUCTS WITH
TOO LITTLE VEG
                           22% of ready meals are vegetarian or plant-based, with a welcome drop
                           in price for vegetarian and plant-based meals since last year’s survey.

                                                                                                                                                                      WHAT’S HAPPENING?
                                                                                                                                                                      This year’s survey shows that the proportion of meat-free options has remained much
                                                                                                                                                                      the same as in last year’s survey. Encouragingly, there has been a significant change
     The proportion of ready meals that are vegetarian or plant-based                                                                                                 in the proportion of vegetarian ready meals which contain cheese. This has fallen from
                                                                                                                                                                      90% to 62% over the course of the past four years. Meat and cheese on average have
                                                                                                                                                                      higher greenhouse gas emissions than vegetables and pulses (Poore and Nemecek,
                                                                                                                                                                      2018), so providing more ready-meal options that are based around vegetables, plant-
                                                                                                                                                                      based proteins or meat alternatives, and legumes can lessen the impact of food on
                                                                                                                                                                      the environment. However, despite the progress made over the past four years, three-
                                                                                                                               WHAT DID WE DO?                        quarters of ready meals still contained meat or fish.
                                                                                                                               Working with the University of
                                                                                                                               Oxford’s foodDB team, Eating           What’s more, over half (51%) of those ready meals with meat contained red or processed
                                                                 “I think the main thing when we look at like an
                                                                                                                               Better surveyed 2,318 ready meals      meat. As well as health organisations globally recommending a reduction of red and
                                                                 English diet, it’s always like meat and two veg,              in 10 UK supermarkets (including       processed meat consumption in high income countries, there are also environmental
                                                                 we don’t really make the veg shine.” VEG ADVOCATE             Tesco, Asda, Ocado, Sainsbury’s and    implications of diets high in red meat. The livestock sector accounts for 35% of total
                                                                                                                               Morrisons) during March 2021. The      cropland use and 14.5% of greenhouse gas emissions globally (Garnett et al., 2017; FAO
                                                                                                                               survey includes meals sold as a hot    and LEAP, 2019) with 46% of all UK methane emissions coming from livestock farming
                                                                                                                               main dish, including both own-brand    (Department for Business Energy and Industrial Strategy, 2021).
                                                                                                                               and branded meals, and chilled and
                                                                                                                               frozen options. The ingredient text    Perhaps most encouraging is the fall in the average price for vegetarian and plant-based
                                                                                                                               for each ready meal was analysed       ready meals observed in this year’s survey. Per portion, vegetarian meals were on average
     The proportion of vegetarian meals containing cheese                                                                      to see which products contained        the most affordable option of those surveyed, with plant-based ready meals no longer the
                                                                                                                               meat or fish or could be categorised   most expensive option at any of the supermarkets surveyed (as they were in 2020’s survey).
                                                                                                                               as either vegetarian or plant-based
                                                                                                                               (vegan). The results were then
                                                                                                                               compared to Eating Better’s 2018
                                                                                                                               and 2020 surveys on ready meals.                      IS POLICY SUPPORTING PROGRESS?
                                                                                                                                                                                     Government action to date to encourage businesses to reformulate
                                                                                                                               These data have been compared                         their products has focussed on encouraging the reduction of salt,
                                                                                                                               against both the 2018 and 2020                        sugar and calories. There has not yet been much focus on encouraging
                                                                                                                               survey results, rather than just                      businesses to increase the healthier components of their food
                                                                                                                               2020’s, to more accurately identify                   products, including fruit and vegetables. Policies to increase vegetable
                                                                                                                               any changes over time. Given that                     consumption have tended to be restricted to public health educational
                                                                                                                               this is a snapshot survey, small                      campaigns (‘5-a-day’ messaging), support for low income households
                                                                                                                               year-on-year changes could be due                     (the Healthy Start scheme), school food (School Fruit and Vegetable
                                                                                                                               to a number of things, for example                    Scheme, School Food Standards) and public procurement (the
                                                                                                                               seasonality or temporary supply                       Government Buying Standard and ‘balanced scorecard’). Third sector
                                                                                                              With thanks to   issues.                                               campaigns such as Peas Please have advocated for the inclusion of
                                                                                                                                                                                     more veg in products such as ready meals.
     Source: Eating Better ready meal survey, 2018; 2020; 2021                               With thanks to

24     Food Foundation | THE BROKEN PLATE 2021                                                                                                                                                                    THE BROKEN PLATE 2021 | Food Foundation    25
“My brother, he’s like nine. He started putting on quite a lot of
                     weight during lockdown. And when he went back to school, people
                     started taking the piss out of him, bullying him a lot…. I think that
                     kind of relates to the wider stigma about it. Cause if he’s only nine
                     as well, it’s really hard to tell him he’s got a problem, and he hasn’t
                     really got a problem. It’s just, he’s got a lack of options and a lack
                     of opportunities.” YOUNG FOOD AMBASSADOR
                                                                                               THEME:
                                                                                               Act now and address
                                                                                               inequalities so that
                                                                                               everyone has the chance
                                                                                               of a longer healthier life

                                                                                               • METRIC 8: CHILDHOOD OBESITY
                                                                                                Levels of childhood obesity are greatest in those living in the most deprived areas. Obesity in
                                                                                                childhood can cause long term health problems, as well as impacting on self-esteem and mental
                                                                                                health. We need to create food environments that reduce these health inequalities and give all
                                                                                                children the best chance in life.

                                                                                               • METRIC 9: CHILD GROWTH
                                                                                                Whether children reach their full height potential or not is influenced by how deprived the
                                                                                                community they live in is. Short stature can indicate chronically poor nutritional status and lead to
                                                                                                inadequate development. This is not a situation we should be seeing in the world’s sixth largest
                                                                                                economy.

                                                                                               • METRIC 10: DIABETES
                                                                                                Adult health is also affected by our food environment, with complications from type 2 diabetes
                                                                                                continuing to rise. Complications arising from obesity and diet-related disease have a huge impact
                                                                                                on an individual's quality of life, especially in lower income groups, and come at a cost to our
                                                                                                healthcare system. We need to change the food environment so that people don’t reach the stage
                                                                                                where they are suffering from the preventable complications of diet-related disease.

26   Food Foundation | THE BROKEN PLATE 2021                                                                                                                              THE BROKEN PLATE 2021 | Food Foundation   27
METRIC        Childhood obesity: Obesity among children continues to be greater                                                                                                                                                THEME
 ●
 ●                     among the most deprived communities compared to the least deprived
 ●         08          and there has been little improvement in reducing these inequalities                                                                                                                               ACT NOW AND ADDRESS INEQUALITIES
                                                                                                                                                                                                                          SO THAT EVERYONE HAS THE CHANCE
                                                                                                                                                                                                                              OF A LONGER HEALTHIER LIFE

CHILDHOOD OBESITY                                                                                                        WHAT DID WE DO?
                                                                                                                         We gathered data collected by
                                                                                                                                                                  WHAT'S HAPPENING
                                                                                                                                                                  The percentage of children with obesity has only changed marginally over the past
                                                                                                                                                                  three years. There are different trends appearing across the three nations. In Scotland,
                                                                                                                         the various child measurement            levels of obesity have remained relatively consistent across both the most and least
                                                                                                                         programmes across Scotland, Wales        deprived groups. However, in Wales the gap between least and most deprived has
                                                                                                                         and England on child obesity in          increased as obesity in children in the most deprived quintile has risen, while remaining
                      Children in the most deprived fifth of households are almost twice                                 4–6-year-olds. Northern Ireland          stable in the least deprived quintile. In England, the gap is narrowing but this is due
                      as likely to have obesity as those in the least deprived fifth of                                  uses a different definition of obesity   to obesity in the least deprived group increasing, as opposed to being due to an
                      households by age 4–6.                                                                             and we were therefore unable             improvement in the most deprived groups.
                                                                                                                         to compare it to the other three
                                                                                                                         nations. The most deprived quintile
                                                                                                                         (fifth) has been compared with the
                                                                                                                         least deprived quintile.
     Percentage of children with obesity
                                                                                                                         Due to school closures as a result
                                                                                                                         of the Covid-19 pandemic in March
                                                                                                                         2020, it was not possible for as many
                                                                                                                         children as usual to be measured.
                                                                                                                         However, the data are still nationally
                                                                                                                         representative and comparable to
                                                                                                                         previous years.

                                                                               Sources:
                                                                               ENGLAND: National Child Measurement
                                                                               Programme 2017/18, 2018/19 and 2019/20.
                                                                               Age group – Reception (4-6-year-olds).
                                                                               SCOTLAND: Child Health Surveillance
                                                                               Programme 2017/18, 2018/19 and 2019/20.
                                                                               Age group – Primary 1 (4.5-6.5-year-
                                                                               olds).
                                                                               WALES: Child Measurement Programme
                                                                               2016/17, 2017/18 and 2018/19.
                                                                               Age group – 4-5-year-olds.

28    Food Foundation | THE BROKEN PLATE 2021                                                                                                                                                                 THE BROKEN PLATE 2021 | Food Foundation    29
METRIC                                                                                                                                                                                                                                   THEME
 ●                      Child growth: Ensure children have access to a
 ●          09          nutritious diet during the first 1,000 days and beyond
 ●                                                                                                                                                                                                                                ACT NOW AND ADDRESS INEQUALITIES
                                                                                                                                                                                                                                  SO THAT EVERYONE HAS THE CHANCE
                                                                                                                                                                                                                                      OF A LONGER HEALTHIER LIFE

CHILD GROWTH
                                                                                                                                              Average height of White British children aged 10-11, by deprivation group               Source: Analysis of National Child
                                                                                                                                                                                                                                      Measurement Programme, 2019-20.

                       Children in the UK are on average shorter than children in other comparable high
                       income countries. In England, children living in deprived communities are on average
                       shorter than children living in wealthier communities by the time they reach age 11.

     WHAT DID WE DO?
     Working with Public Health
     England, we used National Child
     Measurement Programme data
     from the 2019/20 academic year
     to calculate the average height
     of children in Year 6 (aged 10–11                                                                                                                   Please note: the y axis starts at 143 cm, rather
                                                                                                                                                         than 0 cm, to more clearly show height disparity
     years) by deprivation group using
     the Income Deprivation Affecting                                                                                                         INTERNATIONAL COMPARISON:
     Children Index (IDACI). The data                                                                                                         Average height in high income western countries: female, aged 5, 2019
     were analysed by ethnic group, as
     there are some natural differences
     in average height by the time

                                                                                                                                                               UK
     children reach puberty across
     ethnic groups. We have shown the
     data for White British ethnicities
     here but further assessment
     of other ethnicities is required.
     We conducted linear regression
     analysis across deprivation deciles        WHAT’S HAPPENING?
     for each gender in each year to            We would not expect the average height of White British children to have changed in
     test whether the gradient has              such a short time frame, so unsurprisingly we see a very similar pattern as in previous
     changed over time.                         Broken Plate reports: there continues to be a concerning deprivation gradient whereby
                                                children in the most deprived groups are on average shorter than their peers in
     This year we have also reported            the least deprived groups. The analysis revealed a slight reduction in the inequality
                                                                                                                                              Average height in high income western countries: male, aged 5, 2019
     data comparing the average                 gradient for girls in the most recent year, and no improvement for boys.
     height of children aged 5 in               Due to school closures as a result of the Covid-19 pandemic in March 2020, the
     the UK with other high income              National Child Measurement Programme was unable to measure as many children

                                                                                                                                                        UK
     western countries. This data               as usual. However, sufficient numbers of children were measured for the data to be
     is from a recent Lancet report             nationally representative.
     (Rodriguez-Martinez et al., 2020)
     that pooled studies from 200               The international data reveals that children in the UK are on average shorter than
     countries to explore the high              those in nearly all other high income countries by age 5. Height up to age 5 is largely
     variability in height of school-aged       influenced by environments and nutrition, rather than genes or ethnicity (Jelenkovic
     children. The study grouped                et al., 2016). Child growth is therefore an important indicator of our food system, as
     together high income countries             whether children reach their full growth potential is an indicator of both nutritional
     in the Global North within the             status and the environment in which they are growing up in. The UK data therefore
     category ‘high income western              raise questions about the nutritional quality of food that our children are able to access,
     countries’.                                in addition to wider socio-economic forces that shape the conditions for the optimal
                                                growth of young children during their first few years.
                                                                                                                                              Source: NCD RisC, 2020

30    Food Foundation | THE BROKEN PLATE 2021                                                                                                                                                                         THE BROKEN PLATE 2021 | Food Foundation              31
METRIC              Diabetes: Ensure that the food                                                                                                                                                     THEME
 ●
 ●                              environment isn’t conducive to diet-related
 ●             10               disease and its serious complications                                                                                                                                ACT NOW AND ADDRESS INEQUALITIES
                                                                                                                                                                                                     SO THAT EVERYONE HAS THE CHANCE
                                                                                                                                                                                                         OF A LONGER HEALTHIER LIFE

DIABETES                                                                                              WHAT DID WE DO?
                                                                                                      We used data from Public Health
                                                                                                                                              WHAT’S HAPPENING?
                                                                                                                                              Amputations are a major complication resulting from severe cases of diabetes that can
                                                                                                                                              seriously impact people’s quality of life. There were 9,594 diabetes-related amputations
                                                                                                      England’s Diabetes Foot Care            on average per year for the period 2016/17 to 2018/19. This has increased by 1,861
                                                                                                      Profiles, which are based on data       amputations (24%) over five years. Moreover, 27% of the amputations in 2016/17 to
                                                                                                      from Hospital Episode Statistics,       2018/19 were major amputations (above the ankle). Although England’s population
                              There are almost 10,000 diabetes-related amputations carried out on     the National Diabetes Audit,            grew by 6% between 2011 and 2019 with a growing proportion of people aged 65 and
                              average per year, an increase of 24% in the past five years.            and the Quality and Outcomes            over, which will likely have impacted on the absolute numbers seen here, this is still a
                                                                                                      Framework. These data are               shockingly large increase in diabetes-related amputations, which continue to rise.
                                                                                                      reported for 3-year periods, from
                                                                                                      which we took a yearly average.         There are currently approximately 3.2 million people in England diagnosed with type
                                                                                                      Amputations due to both type 1          2 diabetes, with a much higher proportion of these being in more deprived groups
                                                                                                      and type 2 diabetes are included        (NHS Digital, 2021). 24% of type 2 diabetes registrations are among people in the most
     The average annual number of individuals requiring diabetes-related amputations, 2011-2019       within these data, although type        deprived quintile compared with 15% in the least deprived quintile. This once again
                                                                                                      2 diabetes is strongly associated       demonstrates that people in more deprived groups are disproportionately affected by
                                                                                                      with obesity and deprivation and        diet-related illness.
                                                                                                      comprises the majority (90%) of
                                                                                                      diabetes cases in the UK. There
                                                                                                      is therefore a real need for better
                                                                                                      data to be made available to be
                                                                                                      able to distinguish between type
                                                                                                      1 and type 2 diabetes-related
                                                                                                      amputations, as the risk of
                                                                                                      developing type 2 diabetes can
                                                                                                      be modified by improving diets
                                                                                                      and food environments, while
                                                                                                      type 1 diabetes cannot. With the
                                                                                                      prevalence of diabetes in the UK
                                                                                                      having doubled between 1998
                                                                                                      and 2018, and with an estimated 2
                                                                                                      million people in England at risk of
                                                                                                      developing type 2 diabetes in 2020
     Source: Public Health England’s Diabetes Foot Care Profiles, 2011/12 – 2018/19                   (Diabetes UK, 2018; NHS England,
                                                                                                      2020), more disaggregated data on
     Share of individuals with type 2 diabetes in each quintile of deprivation                        diabetes should be made publicly
                                                                                                      available.

                                                                                                      Data on amputations are not
                                                                                                      available broken down by
                                                                                                      deprivation group. Instead, we
                                                                                                      used data from the National
                                                                                                      Diabetes Audit on the proportion
                                                                                                      of individuals registered with type
                                                                                                      2 diabetes (and other types of
                                                                                                      diabetes excluding type 1) in each
                                                                                                      quintile of deprivation as defined by
                                                                                                      the Index of Multiple Deprivation.

                                  £                                                               £

     Source: National Diabetes Audit, 2020-21

32     Food Foundation | THE BROKEN PLATE 2021                                                                                                                                           THE BROKEN PLATE 2021 | Food Foundation    33
THE CURRENT AND
                                                                                                                                                             What’s the future for every 100 children born in 2021 if nothing changes?

                                                                                                                                                                Trajectory for children born in 2021
          FUTURE HEALTH OF                                                                                                                                       ● Overweight ● Obesity ● Severe obesity ● Dead

          CHILDREN BORN IN 2021
                                                                                                                                                                 AT AGE 5/RECEPTION: FORECAST 2026

          Modelling the health of this year’s birth cohort
                                                                                                                                                                 AT AGE 11/YEAR 6: FORECAST 2031
          WHAT DID WE DO?                1

          We calculated the projected health implications of current diets for children
          born in England in 2021. The trajectory was modelled using projected figures
          based on current trends, thus showing us what the rates of overweight, obesity
          and diet-related disease will be for these children if things continue as they are.
          These diseases are not exclusively related to overweight and obesity, but there                                                                        AT AGE 21: FORECAST 2041
          is a strong association between having a high BMI and being at an increased
          risk of several diet-related chronic diseases. It is also worth noting that some
          individuals will have multiple comorbidities, living with several of the conditions
          on our trajectory showing the future health outcomes for
          2021’s birth cohort.
                                                                                                                                                                 AT AGE 65: FORECAST 2086

                                                                                                                                                                                                   AT AGE 65: DIABETES T1+T2

                                                                                                                                                                                                   AT AGE 65: CARDIOVASCULAR DISEASE

                                                                                                                                                                       AT AGE 65:
                                                                                                                                                                      IN DETAIL
                                                                                                                                                                                                   AT AGE 65: CANCERS*

                                                                                                                                                                                                   AT AGE 65: OSTEOPOROSIS

                                                                                                                                                                                                   AT AGE 65: TOOTH DECAY
                                                                                                                                                                     ● Dental decay
                                                                                                                                                                     ● People who've
                                                                                                                                                                       lost all teeth
                                                                                                                                                                     ● Dead

                                                                                                                                                                 Note: Overweight is defined as a BMI of 25 - 29.9, obesity (excluding severe obesity) is defined as a BMI of 30-39.9, and severe obesity as a BMI of 40 or higher. For children
                                                                                                                                                                 at age 5 and 11, we used the UK90 reference charts, defining overweight and obesity at the 85th and 95th centile cut-offs, and the 99.6th centile for severe obesity.
                                                                                                                                                                 * a third of cancers are now estimated to be a result of poor diets and low levels of physical activity, with 13 forms of cancer associated with obesity
     1
         For further information on the methodology and sources used in these infographics please see our technical report on the Food Foundation website.       (Cancer Research UK, 2021) (WCRF)

34       Food Foundation | THE BROKEN PLATE 2021                                                                                                                                                                                                                                           THE BROKEN PLATE 2021 | Food Foundation                 35
You can also read