Brook Silver, David Hand, Todd Gilmore, Jesse Rivera, and Doug Olson - Spring Chinook ...
←
→
Page content transcription
If your browser does not render page correctly, please read the page content below
Warm Springs National Fish Hatchery - Spring Chinook
        Salmon Program FY 2020 Annual Report
           Brook Silver, David Hand, Todd Gilmore, Jesse Rivera, and Doug Olson
   Columbia River Fish and Wildlife Conservation Office 1211 SE Cardinal Court, Suite 100
                                   Vancouver, WA 98683
                                         March 31, 2021

In 1966, congress authorized the Warm Springs National Fish Hatchery to stock salmon and
trout within the Confederated Tribes of the Warm Springs Reservation of Oregon reservation to
increase tribal harvest opportunities. The current focus of the Warm Springs National Fish
Hatchery is to produce spring Chinook Salmon for tribal harvest in the Deschutes and Columbia
River and for on-reservation distribution to tribal members. The facility is managed as an
integrated hatchery program to minimize genetic divergence between Warm Springs River
hatchery and wild stocks. The Columbia River Fish and Wildlife Conservation Office conducts
monitoring and evaluation of this hatchery program. This report summarizes broodstock need,
juvenile production levels, and marking and tagging information for the past ten years. After
juvenile release, the detection rates at Bonneville Dam, juvenile survival, adult returns, smolt-to-
adult survival rates inferred from coded-wire tag recoveries, and adult age structures are
reported. Special studies and recommendations for future studies supported by U.S. Fish and
Wildlife Service funds are also discussed.

For previous Columbia River Fish and Wildlife Program Office reports, please see:
https://www.fws.gov/columbiariver/publications.html

                                                 1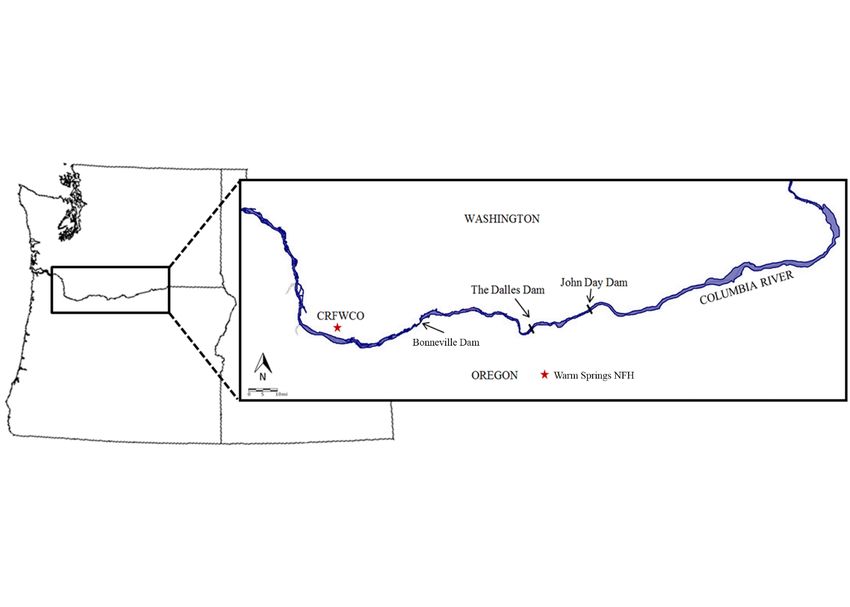
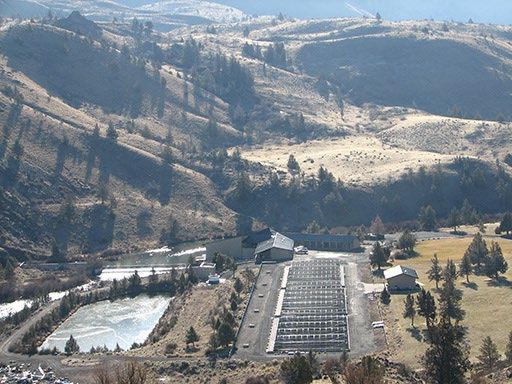
On the Cover: Aerial photograph of Warm Springs NFH located along the Warm Springs
River, within the Warm Springs Reservation of OR. U.S. Fish and Wildlife Service stock
photograph.

Table of Contents
Introduction ................................................................................................................................................................ 3
    Program Description .......................................................................................................................................... 4
    Past Objectives ...................................................................................................................................................... 5
    Present Objectives............................................................................................................................................... 6
Hatchery Operations Summary .......................................................................................................................... 7
    On-Station Juvenile Production ..................................................................................................................... 7
         a) Egg-to-Smolt Survival .............................................................................................................................. 7
         b) Juvenile Marking, Tagging, and Release Data ............................................................................... 8
    Off-Station Juvenile Production..................................................................................................................... 9
         a) PIT Tagging Program ............................................................................................................................... 9
         b) Juvenile Survival ..................................................................................................................................... 11
    Adult Returns: Smolt-to-Adult Survival, Detections, Age Structure, and Harvest Data ..... 13
         a) Adult Returns ........................................................................................................................................... 13
         b) Bonneville Dam and Ladder Detections ....................................................................................... 16
         c) Age Structure ............................................................................................................................................ 17
         d) Adult Harvest ........................................................................................................................................... 18
2020 Run Reconstruction .................................................................................................................................. 20
2020 Wild Return and Management ............................................................................................................. 23
2021 Run Forecast ................................................................................................................................................ 25
Transfers ................................................................................................................................................................... 26
Other Fish counted and passed above Warm Springs NFH ................................................................ 28
Past M&E Studies ................................................................................................................................................... 30
Summary and Future Studies ........................................................................................................................... 32
         Future M&E Studies .................................................................................................................................... 33
    Acknowledgements ......................................................................................................................................... 34
References ................................................................................................................................................................ 34

                                                                                      2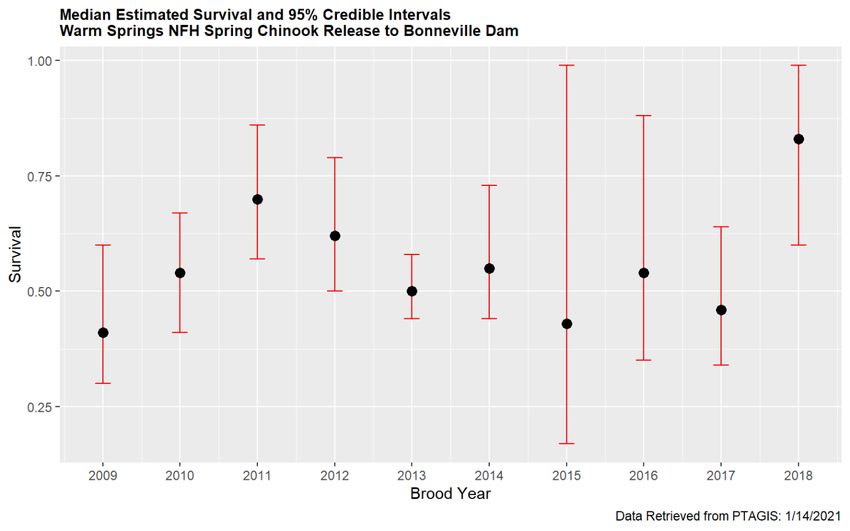
Introduction
Salmon are an integral part of the spiritual and cultural identity of the Confederated Tribes of the
Warm Springs Reservation of Oregon (CTWSRO) and are an essential component of their
traditional and contemporary diet. Each year, returning salmon allow the transfer of traditional
values from generation to generation. It is a tribal priority to meet current and future needs of the
resource as well as those of the Tribe. Because the CTWSRO tribal population is growing, the
need for salmon is more important than ever.
The tribes, states, and federal government share the responsibility to protect fish habitat and
enhance fish runs in all waters. The Treaty of 1855 recognizes tribal sovereignty as the right of
the CTWSRO to govern their members and manage their territories and resources. Furthermore,
the federal government and its implementing agencies owe an affirmative duty to use their
expertise and authority in meaningful consultation with CTWSRO and safeguard natural
resources of crucial importance to self-government and prosperity. In 1959, the CTWSRO
requested the U.S. Fish and Wildlife Service (USFWS) investigate the possibilities of salmon
and steelhead enhancement on the Reservation. It was determined that operation of a national
fish hatchery on the Reservation was pivotal for the enhancement of the anadromous fish runs.
On May 31, 1966, Warm Springs National Fish Hatchery (WSNFH) was authorized by Federal
Statute 184 to stock salmon and trout within the CTWSRO reservation to increase tribal harvest
opportunities. Since 1978, WSNFH has supplemented fish for harvest in the waters of the Warm
Springs Reservation. Production from the hatchery is considered essential for the enhancement
of spring Chinook Salmon (Oncorhynchus tshawytscha) populations and meeting tribal trust
responsibilities.
The CTWSRO has the principal management responsibility for fishery resources on the Warm
Springs Reservation. Since 1977 the USFWS and CTWSRO have worked together to draft
hatchery operations and management plans to assure the operation of the hatchery is compatible
with and compliments the Tribe’s fishery management goals. This cooperative management of
the hatchery provides tribal and sport harvest opportunities, enhances anadromous fish runs in
Reservation waters, and meets the future needs of the resource and those of the Tribes while
protecting wild fish populations.
The current focus of the WSNFH is to produce spring Chinook Salmon for tribal harvest in the
Deschutes and Columbia River and for on-reservation distribution to tribal members. The facility
is managed as an integrated hatchery program. The Service and Tribes have taken this integrated
approach to managing the hatchery to not only produce fish, but also minimize genetic
divergence between Warm Springs River hatchery and wild stocks, as well as determine what
effects hatchery fish have on the ecosystem into which they are released (Olson et al. 2004). The
Warm Springs River is one of two rivers in the Deschutes River subbasin that supports natural
production of spring Chinook Salmon. Although spring Chinook Salmon are not listed under the
Endangered Species Act (ESA), the WSNFH program does cause interactions with listed Mid-
Columbia River summer Steelhead (Olson and Spateholts 2001). The safe passage of all wild
fish populations, both downstream and upstream of WSNFH, is also an important goal. The
hatchery is operated in compliance with the ESA (National Marine Fisheries Service (NMFS)
2007) and consistent with the 2018-2027 United States v. Oregon Management Agreement

                                                  3
(NMFS 2018). The purpose of this report is to summarize programs conducted at the facility
over the past ten years and describe special studies conducted and supported by USFWS funds.
Program Description
Warm Springs NFH is located at river kilometer (rkm) 16 of the Warm Springs River, within the
Warm Springs Reservation of Oregon, approximately 23 km north of the town of Warm Springs
(Fig. 1). The Warm Springs River enters the Deschutes River at rkm 135, which enters the
Columbia River 329 kilometers from the Pacific Ocean. It is upstream of two main-stem dams on
the Columbia River, Bonneville (rkm 235) and The Dalles (rkm 308), and downstream of the
Pelton/Round Butte (rkm 161) dams on the Deschutes River. The facility is part of the Columbia
River Gorge Complex and operated by the USFWS on land and water leased from the
CTWSRO. The water intake structure and pumps are located at the hatchery site just upstream of
a barrier dam across the Warm Springs River, adjacent to the hatchery facility. Prior water
intake, water passes through a trash rack and traveling screen. The primary prevention of fish
entrainment is the drum screens located in the intake structure behind the trash racks. In addition,
a redundant fish bypass located in front of the traveling screens may deposit small fish below the
barrier dam.
The hatchery currently has a staff of five full-time USFWS employees; the hatchery manager,
three animal caretakers, and a maintenance mechanic. The Pacific Region Fish Health Program
(PRFHP) manages fish health and disease prevention in accordance with USFWS Fish Health
Policy and Implementation Guidelines and IHOT policies (USFWS 1995, 2004; Integrated
Hatchery Operations Team (IHOT) 1995) and with protocols of Oregon Department of Fish and
Wildlife (ODFW). Fish health personnel promptly manage any health problems to limit mortality
and reduce disease transmission.
Figure 1. The Warm Springs NFH is located within the Warm Springs Reservation of Oregon
and uses funds from the USFWS to support its rearing program.
4Past Objectives
Fish production began in 1978 with eggs from wild spring Chinook Salmon and steelhead (O.
mykiss) captured from the existing natural runs passing the hatchery site. The steelhead program
was terminated in 1981 because of disease, growth problems and physical limitations of the
facility. To protect wild steelhead, only wild steelhead are passed above WSNFH and all known
hatchery origin steelhead are sacrificed and distributed to the CTWSRO.
In 1984, the CTWSRO asserted that separating the hatchery and natural producing fish would
best serve the fish and the needs of the tribal people. The CTWSRO proposed a two-stock
concept, whereby only wild (unmarked) fish are passed above the hatchery. To this end, 100
percent of fish released from the hatchery are marked with a coded-wire tag (CWT) and an
adipose fin-clip (AD) to distinguish them from wild fish. The differential marking of hatchery
and wild fish provides consistent long-term data on the life-history patterns and possible changes
that may occur within stocks. It also allows for maintenance of the genetic integrity of the
naturally producing stock. The hatchery tries to maintain the genetic and life-history
characteristics of the wild population in the hatchery environment by incorporating wild fish into
its broodstock, but only when wild returns are greater than 1,000 adults. The minimum
escapement goal for naturally produced spring Chinook salmon above the hatchery is 1,000
adults, with a long-term goal of a run of 2,800, similar to runs before the hatchery was
constructed (CTWSRO and USFWS 2007).
In 1996, WSNFH installed an automated fish passage system to minimize handling of natural
fish and reduce pre-spawn mortality by separating out returning hatchery spring Chinook salmon
with CWTs. During the spring Chinook migration period, generally from April 15th to
September 30th, the barrier dam directed fish into the adult ladder. Fish swam through a tube in
the adult ladder, which triggered a pneumatic gate if a CWT was detected. The goal was to have
all CWT hatchery fish shunted to a holding pond and pass non-tagged fish to another catch pond
where an underwater video camera monitored them as they swam out through the ladder and
upstream of the hatchery. The minimum operating standard for the system was the removal of 95
percent of the fish with CWTs and 95 percent accuracy in counting upstream bound fish.
However, the passage system failed to meet the efficiency standards and cost for upgrade was in
excess of $75,000 (Archibald 2013). In 2014, the system was decommissioned, and hatchery
personnel manually sort all fish trapped in the holding ponds.
The release goal for juvenile spring Chinook released from the hatchery has ranged from
400,000 to 1.2 million during 1978 through 1991. From 1992 to the present, the juvenile release
goal has been consistently set at 750,000. From brood years (BY) 1979 to 2007, there have been
two release strategies, spring and fall. For brood years 1979 to 1992, a graded fall release
strategy was employed. During this time, raceways were graded, with the larger fish being
released into the Warm Springs River during the fall. Between brood years 1993 and 2007, a fall
volitional release strategy was used at WSNFH. The fall volitional release strategy was a partial
volitional release, where raceways were opened for approximately 4 weeks, between October
and November, and fish could volitionally exit the hatchery and enter the Warm Springs River.
Based on PIT tag monitoring of the fall release, anywhere from 10% to 60% of the fish in a
raceway would exit during the fall period. Once the fall volitional release period ended, the
raceways were closed and the remaining fish would be released the following spring, generally
5during a spring volitional release period of late-March through April. Fish remaining at the end
of April were forced out to make room for the next year’s brood. Studies from the 1980s
indicated that most smolts released in the spring reached the estuary within three to four weeks,
the behavior of fish released in the fall was not clear (Cates 1992). Scale analysis of adult returns
indicated that most fall-released fish that ultimately survived to adulthood over-wintered in fresh
water before migrating to the ocean the following spring. Follow-up studies from 2000 to 2003
indicated that some fish released in the fall (5% to 36% of the total release each year) quickly
migrated downstream and exited the Deschutes River within days of release; however, the
majority of the fish released in the fall overwintered in the Deschutes River (Reagan et al. 2005).
The size at release of fish at the hatchery was reduced during the early 2000s, from a size at
spring release of 10-15 fish per pound to 20-30 fish per pound. It was thought that the smaller
size of fish reared at WSNFH may have contributed to the overwintering behavior of the fall
released fish (Reagan et al. 2005). Subsequent studies (brood years 2005-2007) using PIT tag
detections of fish leaving the hatchery found that very few fish that left the hatchery during the
fall survived to migrate downstream to Bonneville Dam or survived to adult return. The fall
volitional release strategy ended with brood year 2007. A spring only release has been used at
the hatchery since brood year 2008.
Present Objectives
Operations at the hatchery presently consist of adult collection, egg incubation and rearing of
spring Chinook salmon. The current hatchery broodstock objective is to spawn 650 - 693
Chinook Salmon adults with a 60:40 female:male spawning ratio with jacks (< 60 cm in length)
making up 5% of the broodstock (USFWS 2019). To account for 10% mortality between
collection and spawning, 726-770 adults will be collected for broodstock proportionately through
the run based on wild stock timing and may be adjusted if temperatures exceed 16 °C. To
maintain the stock integrity and genetic diversity of hatchery and wild spring Chinook salmon,
approximately 10 percent natural origin fish have been incorporated into broodstock collection
based on pre-season forecasts and in-season run size updates. However, if the wild run is less
than 1,000 fish, no wild fish will be collected for broodstock. In a USFWS review of the
WSNFH spring Chinook salmon program, the Hatchery Review Team (USFWS 2006)
recommended that the program maintain the current goal of a minimum of 10 percent natural-
origin spring Chinook Salmon in the broodstock and continue to limit hatchery-origin spring
Chinook salmon on the spawning grounds to less than 10 percent. Remaining surplus hatchery
origin spring Chinook salmon are dispatched and provided to the CTWSRO for tribal needs.
After spawning, spring Chinook salmon are either placed in a landfill or are used for nutrient
enhancement after they have been screened for disease and treated (eviscerated and heat-baked)
to prevent disease transmission.
During years of low returns to the hatchery or unexpected losses to production, consideration has
been given to augmenting the hatchery production with eggs or juveniles from other hatchery
programs. The primary source of eggs during years of shortfall is from ODFW’s Round Butte
Hatchery (RB), located within the Deschutes River basin. In recent years, eggs and juveniles
from Parkdale Hatchery, located within the Hood River basin, have also been used to augment
the WSNFH production. To maintain the WSNFH genetic stock, any releases from non-WSNFH
stocks are differentially marked (e.g. left or right ventral clip) and coded-wire tagged to
distinguish them from WSNFH fish upon return. These stocks are excluded from the broodstock
6and distributed to the CTWSRO or to RB if needed. If returns to WSNFH are projected to be
below broodstock needs, RB fish returning to WSNFH may be spawned and their progeny reared
and marked separately from WSNFH stock.
The current production goal is on-station spring release of 750,000 (+/- 10%) externally marked
smolts into the Warm Springs River (NMFS 2018). All juvenile fish released from the hatchery
are marked (CWT and AD) to differentiate them from naturally produced fish upon return.
Approximately 15,000 juveniles have been PIT tagged annually since BY 2005 (migration year
2007).
Hatchery Management Goals (USFWS 2019)
1. Produce Spring Chinook Salmon consistent with U.S. v. Oregon production goals for
annual tribal harvest opportunity in Deschutes River and Columbia River fisheries
2. Provide for distribution to tribal members and the community freezer at CTWS
3. Provide safe passage for wild fish consistent with CTWSRO management of the Warm
Springs River
CRFWCO Monitoring and Evaluation Objectives:
1. Monitor and evaluate on-station rearing strategies
2. Monitor and evaluate juvenile releases, off-station juvenile survival, and migration
3. Monitor release to adult return survival
4. Develop run-reconstruction of adult returns, including contribution to harvest and returns to
the hatchery
5. Produce run forecasts for wild and hatchery returns
6. Track passage of wild fish
7. Conduct special studies as needed in consultation with the Warm Springs Hatchery
Evaluation Team
Hatchery Operations Summary
On-Station Juvenile Production
a) Egg-to-Smolt Survival
Survival metrics during the early life stages include:
1. 95% or higher survival from the egg to eye up stage
2. 90% survival from the egg to fry stage; and
3. 97% survival from fry to smolt stage
Mortality can occur during each of these life stages due to disease, injury, predation, starvation,
deformities, and genetic anomalies. Throughout the rearing cycle, the hatchery has a maximum
Flow Index < 1.0 and Density Indexrearing and release practices are needed to improve on-station survival when warranted. This
data is collected by hatchery staff and is not part of this report.
b) Juvenile Marking, Tagging, and Release Data
Funds distributed by the USFWS are used to meet annual juvenile release goals, process adult
returns, for costs associated with PIT tagging, and for equipment maintenance. The facility has
an annual release goal of 750,000 spring Chinook salmon into the Warm Springs River. Fish
released contribute to sport, commercial, and tribal fisheries while also providing for adequate
escapement for hatchery production. The actual number of juveniles produced at WSNFH has
varied by release year (Table 1) with a total annual mean of 566,352 juveniles released since
release year (RY) 2011.
Since RY 2011, the facility has achieved a mean juvenile size of 32.8 fish/lb. at the time of
release. While all juveniles are given an AD clip and coded wire tag, the actual number of fish
with clips and tags at release is estimated based on clip quality and tag retention sampling.
Approximately 97% of the total number of juveniles released are AD and CWTed, with the
remaining 3% released as AD only due to coded-wire tag loss. The actual number of juveniles
that are mass-marked annually are presented below (Table 1). CWT codes are stored in the
USFWS Columbia River Information System (CRiS) database at the CRFWCO and reported
annually to the Regional Mark Information System (RMIS).
In fall 2017, WSNFH requested surplus eggs from Round Butte state hatchery due to concerns
about another year of high egg loss. Fortunately, the brood year 2017 production did not
experience elevated losses, however this led them to have extra juveniles on station above their
750,000 +/- 10% target (~65,000 above the high end 825,000 allowable). A one-time release of
the extra 65,000 spring Chinook juveniles on-station was determined not to have a substantial
effect on ESA-listed species above and beyond what was considered in the USFWS BiOp
covering the WSNFH program (Rich Turner, 3/18/2019).
8Table 1. Annual juvenile spring Chinook release dates from Warm Springs NFH into the
Warm Springs River. Releases include Warm Springs Stock, Round Butte Stock (A), and
Parkdale Stock (B). Round Butte stock fish were identified by a left ventral mark and
Parkdale stock fish were identified by a right ventral mark in addition to the AD to
distinguish stocks. Data includes marking and tagging information, number of juveniles
released, release type forced (F), volitional (V), or accidental (A), and mean juvenile size at
release. Data retrieved from CRiS 12/14/2020.
Relea Brood Rel. Dates Rel. AD + AD CWT Total Mean Size
se Year Type CWT Only Retention Released (Fish/lb)
Year
2011 2009 4/13 – 4/27 V 311,296 8,591 97.3 319,887 29
2011 2009 (A) 4/4 – 4/11 V 216,162 1,231 99.3 217,393a 34
2012 2010 4/2 – 4/26 V 471,834 9,110 96.4 480,944 29
2013 2011 3/27 – 4/10 V 770,451 13,095 99.3 783,546 24
2013 2012 6-May A 19,908 242 98 20,150 160
2014 2012 3/31 – 4/4 F 713,563 13,379 98 726,942 24
2015 2013 3/30 – 3/31 F 344,834 26,621 93.1 371,455 28
2016 2014 30-Mar F 129,349 3,682 93.5 133,031 22
2017 2015 30-Mar F 396,864 17,451 95.8 414,315 24
2017 2015 (B) 30-Mar F 112,460 6,939 94.2 119,399b 30
2018 2016 29-Mar F 533,560 7,881 98.9 541,441 22
2019 2017 4/3, 4/5 F 736,730 27,510 96.4 764,240 26
2019 2017 (A) 3-Apr F 120,045 3,496 97.2 123,541a 30
2020 2018 8-Apr F 277,211 3,922 98.6 281,133 24.8
2020 2018 (A) 8-Apr F 228,470 1,840 99.2 230,310a 24.3
2020 2018 (B) 8-Apr F 135,798 0 100 135,798b 23.3
Mean by Warm Springs 427,782 11,953 96.8 439,735 38
Stock Round Butte (A) 188,226 2,189 98.6 190,415 29
Parkdale (B) 124,129 3,470 97.1 127,598 27
Total Annual Mean 551,854 14,499 96.8 566,352 32.8
a
Left ventral clip to distinguish as Round Butte Stock
b
Right ventral clip to distinguish as Parkdale Stock
Off-Station Juvenile Production
a) PIT Tagging Program
PIT tagging provides real-time tracking data as fish migrate from the Warm Springs River to the
Columbia River, over Bonneville Dam (BONN), and to the Pacific Ocean. All data is stored in a
regional database called the Columbia Basin PIT Tag Information System (PTAGIS) and utilized
by staff at CRFWCO to estimate juvenile post-release migration and survival, track adult returns,
and estimate stray rates. In release years (RY) 2011-2020, approximately 15,000 juvenile spring
9Chinook were annually tagged with passive integrated transponder (PIT) tags in later January or
early February during the year of release from WSNFH (Table 2).
The detection rate of PIT tagged fish at BONN is a function of a) migration survival from release
to BONN and b) the detection efficiency of the PIT antenna arrays at the dam. Since RY 2011,
an average 15,269 juveniles have been PIT tagged at and released from WSNFH each year. The
mean annual number of detections at BONN is 1,105, a detection rate of 7.1%. Average mean
juvenile travel time to BONN after release is approximately 26 days with some juveniles
spending up to 121 days between the facility and BONN before migrating downstream. Juveniles
travel downstream and pass over BONN as quickly as 14 days or less after release (10th
percentile mean). However, the majority of fish (90th percentile) pass over BONN within 37 days
after release.
10Table 2. The number of juvenile spring Chinook PIT tagged in a given release year and
travel times to Bonneville Dam (BONN) following release from Warm Springs NFH.
Migration times to BONN may be underestimated in release years 2011 -2013 due to PIT
tagged fish having the option to exit ponds volitionally eight days before being forced into
the Warm Springs River. Releases include Warm Springs Stock, Round Butte Stock (A),
and Parkdale Stock (B). Data retrieved from PTAGIS 12/14/2020.
Release Year # PIT # Det. at % Travel Time (Days)
Tagged BONN Det.
Mean Range Percentile
10 th
50th 75th 90th
2011 14,924 661 4.4 32 5 – 114 21 32 38 41
2012 14,862 906 6.1 35 5 – 106 21 37 41 45
2013 14,965 1,244 8.3 28 3 – 102 15 29 31 35
2014 14,898 1,107 7.4 30 4 – 121 19 31 35 41
2015 14,915 1,425 9.6 21 3 – 96 7 23 28 33
2016 14,975 1,345 9 19 3 – 118 8 17 23 30
2017 9,896 289 2.9 25 3 – 84 7 27 34 37
2017 (B) 4,972 95 1.9 34 4 – 56 15 36 41 51
2018 14,903 955 6.4 24 4 – 56 9 26 33 36
2019 12,887 1,141 8.9 24 3 – 94 11 23 30 35
2019 (A) 2,097 160 7.6 30 8 - 48 22 30 35 38
2020 7,944 775 9.8 18 4.5 - 121 10 17 21 27
2020 (A) 6,566 598 9.1 18 4.5 - 111 10 18 21 25
2020 (B) 3,884 353 9.1 18 4.5 - 106 10 17 21 27
Warm Springs 13,517 985 7.3 26 13 13 31 36
Round Butte (A) 4,332 379 8.4 24 16 16 28 32
Parkdale (B) 4,428 224 5.5 26 12 12 31 39
Total Annual 15,269 1,105 7.1 26 14 27 32 37
Mean
b) Juvenile Survival
PIT tag detection histories are used to estimate the apparent juvenile survival from release at
WSNFH downstream to BONN. A PIT tagged downstream migrating juvenile fish can pass
BONN using a variety of routes, some of which have PIT tag detection arrays and some of which
do not. For example, tagged fish passing through the turbines or through spillways would not be
detected, while a fish passing through the juvenile bypass or corner collector could be detected.
Since there is not 100% detection capability at BONN, detection probability must be estimated in
order to separate out a tagged fish that died before reaching BONN from a tagged fish that was
alive but was not detected as it passed BONN. For this analysis, apparent survival from release to
BONN was estimated using the live recapture Cormack-Jolly-Seber model in Program MARK.
The model uses encounter histories of tagged fish to estimate the detection probability at BONN
and estimate the apparent survival of fish from release to BONN. Survival estimates are reported
11on a scale from 0.0 to 1.0 (Table 3, Figure 2). As a note, the term “apparent survival” is used to
indicate that a tagged fish that is alive, but never migrates past BONN, is considered a
“mortality” in the model.
Estimated apparent juvenile survival of the Warm Springs NFH spring Chinook for brood years
2009-2018 (release years 2011-2020) ranged from 0.41 to 0.83 (Table 3; Figure 2).
Table 3. Juvenile Spring Chinook survival from release at Warm Springs NFH to
Bonneville Dam. Release year is two years after brood year. Estimates are median survival
and lower and upper credible intervals. The Markov chain Monte Carlo Bayesian
parameter estimation method in MARK was used to estimate the variance of the estimated
survival. Data retrieved from PTAGIS:1/14/21.
Release Year Brood Year Median Survival 95% Lower 95% Upper
2011 2009 0.41 0.30 0.60
2012 2010 0.54 0.41 0.67
2013 2011 0.70 0.57 0.86
2014 2012 0.62 0.50 0.79
2015 2013 0.50 0.44 0.58
2016 2014 0.55 0.44 0.73
2017 2015 0.43 0.17 0.99
2018 2016 0.54 0.35 0.88
2019 2017 0.46 0.34 0.64
2020 2018 0.83 0.60 0.99
Mean 0.56 0.41 0.77
12Figure 2. Juvenile Spring Chinook survival from release at Warm Springs NFH to Bonneville
Dam. Estimates are median survival with 95% lower and upper credible intervals (2009 -
2018).
Adult Returns: Smolt-to-Adult Survival, Detections, Age Structure, and
Harvest Data
a) Adult Returns
Adult returns to WSNFH are estimated by hatchery personnel and the marking and biosampling
crew from CRFWCO. Coded Wire Tag recoveries maintained in the RMIS database are used to
estimate the number of harvested adults and spawning ground recoveries (Table 4). At WSNFH,
the number of hatchery returns and harvested adults has fluctuated since brood year (BY) 2004.
Collectively, the facility has produced a mean of 2,772 adults annually since BY 2004 resulting
in a mean smolt-to-adult survival rate (SAR) of 0.47%. This is above the target SAR of 0.39%
set from brood years 1978 – 2001 (CTWSRO 2007).
13Table 4. The estimated number of hatchery returns, harvested adults, and fish present on
the spawning grounds for spring Chinook released from Warm Springs NFH. Adult
returns are based on coded wire tag recovery expansion data from RMIS. Hatchery return
estimates include returns to Warm Springs NFH. Strays to non-federal hatcheries are
included in the Total # of Adults. Data retrieved from CRiS Database 3/25/2021.
Brood Hatchery Columbia Ocean Spawning Total # Smolt-to-
Year Returns River Harvest Harvest Grounds Adults Adult
Survival (%)
2004 2,175 866 3 0 3,044 0.45
2005 2,147 507 3 0 2,657 0.43
2006 1,561 387 3 0 1,951 0.56
2007 2,938 507 1 0 3,446 0.59
2008 1,387 373 11 0 1,771 0.25
2009 1,366 73 5 0 1,444 0.27
2010 1,552 787 8 0 2,347 0.49
2011 6,451 1,555 26 0 8,032 1.03
2012 384 1,076 13 0 1,473 0.20
2013 1,350 197 9 0 1,556 0.42
Mean 2,325 633 8 0 2,772 0.47
Due to delays in reporting to RMIS, CWT recoveries may be adjusted every year for accuracy
An average 754 CWTs have been recovered each year at Warm Springs NFH since 2011 (Table
5). The Warm Springs NFH spring Chinook program accounts for 98.5 percent of all recoveries;
spring Chinook from other programs include Round Butte (0.6%) and Irrigon (0.5%), both state
hatcheries in Oregon; returning spring Chinook from other programs account for < 0.1% of all
recoveries.
14Table 5. Coded Wire Tag (CWT) recoveries for all hatchery programs collected at Warm
Springs NFH 2011 – 2020. Number of CWT recoveries are not expanded and do not reflect
sample or tagging rates.
Return Year CWT Recoveries Hatchery Origin % of Total Annual Return
2011 2 Clearwater Hatchery 0.1
1 Coleman NFH 0.1
1 Cottonwood Cr Pond 0.1
22 Irrigon Hatchery 1.5
2 Little White Salmon NFH 0.1
1 NPT Hatchery 0.1
10 Round Butte Hatchery 0.7
7 Wallowa Hatchery 0.5
1,465 Warm Springs NFH 97.0
2012 3 Lookingglass Hatchery 0.4
3 Round Butte Hatchery 0.4
699 Warm Springs NFH 99.1
2013 4 Lookingglass Hatchery 0.5
1 NPT Hatchery 0.1
1 Parkdale 0.1
7 Round Butte Hatchery 0.9
1 Sawtooth Hatchery 0.1
798 Warm Springs NFH 98.3
2014 1 Rapid River Hatchery 0.1
3 Round Butte Hatchery 0.3
982 Warm Springs NFH 99.6
2015 5 Irrigon Hatchery 0.2
1 Little White Salmon NFH < 0.1
2 Magic Valley Hatchery 0.1
3 Round Butte Hatchery 0.1
2,192 Warm Springs NFH 99.5
2016 1 Cle Elum Hatchery 0.3
1 Cottonwood Cr Pond 0.3
4 Irrigon Hatchery 1.4
4 Round Butte Hatchery 1.4
279 Warm Springs NFH 96.5
2017 1 Irrigon Hatchery 4.3
22 Warm Springs NFH 95.7
2018 7 Round Butte Hatchery 3.1
222 Warm Springs NFH 96.9
2019 1 Imnaha Pond 0.3
1 Klickitat Hatchery (YKFP) 0.3
3 Round Butte Hatchery 0.9
326 Warm Springs NFH 98.5
2020 6 Round Butte Hatchery 1.3
2 Sawtooth Hatchery 0.4
443 Warm Springs NFH 98.2
Mean 754
15b) Bonneville Dam and Ladder Detections
Spring Chinook adults return and pass Bonneville Dam as early as Mar-20 and as late as Jul-20.
The average median Bonneville Dam passage date of PIT tagged Spring Chinook adults (Ages 3,
4, and 5) released from WSNFH is May-09 (Table 6).
Table 6. Median Bonneville Dam passage date of adult spring Chinook PIT tagged and
released from Warm Springs NFH (≥ Age 3).
Return Median First Last # of Bonneville Expansion Hatchery Hatchery
Year Passage Det. Det. Fish (95% CI) * Count Count/Bonn
Date Date Date Det. Exp. *100
2011 May-20 May-01 Jun-23 22 1,041 (691 - 1,655) 3,826 368%
2012 May-10 Apr-23 Jun-16 32 1,462 (999 - 2,097) 1,354 93%
2013 May-10 Apr-26 Jul-01 58 1,597 (1,087 - 2,304) 1,818 114%
2014 May-05 Apr-05 Jun-21 136 5,180 (4,058 - 6,711) 2,478 48%
2015 Apr-27 Mar-20 Jul-04 195 10,348 (8,691 - 12,483) 6,635 64%
2016 May-07 Apr-06 Jul-01 142 6,724 (5,517 - 8,119) 782 12%
2017 May-23 May-04 Jul-20 76 1,620 (1,156 - 2,067) 1,748 108%
2018 May-07 Apr-23 Jun-11 46 456 (289 - 520) 260 57%
2019 May-09 Apr-30 May-13 9 371 (172 - 772) 391 105%
2020 May-07 Apr-22 Jul-13 19 759 (361 - 1,012) 542 71%
Mean May-09 Apr-18 Jun-24 74 2,956 1,983 104%
* Confidence limits do not include detections of five fish or less per age group to reduce the variability
and increase the accuracy of the estimate
Since Return Year 2011, spring Chinook adults (≥ Age 3) PIT tagged and released from Warm
Springs NFH returned to the Warm Springs NFH Ladder as early as Apr-14 and as late as Sep-07
with the average median May-27 (Table 7).
16Table 7. Median passage date at Warm Springs NFH Ladder of adult spring Chinook PIT
tagged and released from Warm Springs NFH (≥ Age 3).
Return Median First Last # of Hatchery Expansion Hatchery Hatchery
Year Passage Det. Det. Fish (95% CI) * Count Count/Hat.
Date Date Date Det. Exp. *100
2011 Jun-04 May-14 Sep-02 10 473 (260 - 982) 3,826 809%
2012 May-31 May-15 Aug-13 16 705 (398 - 1,207) 1,354 192%
2013 May-29 May-11 Sep-04 47 1,300 (806 - 1,902) 1,818 140%
2014 May-22 Apr-24 Jul-27 79 3,015 (2,186 - 4,270) 2,478 82%
2015 May-15 Apr-18 Sep-07 138 7,310 (5,933 - 9,123) 6,635 91%
2016 May-25 May-03 Sep-06 59 2,788 (2,026 - 3,499) 782 28%
2017 Jun-11 May-20 Aug-28 43 926 (571 - 1,274) 1,748 189%
2018 May-23 May-12 Aug-26 24 213 (147 - 327) 260 122%
2019 May-23 May-19 May-27 4 162 (NA - NA) 391 241%
2020 May-26 Apr-14 Aug-16 12 505 (174 - 711) 542 107%
Mean May-27 May-06 Aug-15 43 1,740 1,983 200%
* Confidence limits do not include detections of five fish or less per age group to reduce the variability
and increase the accuracy of the estimate
c) Age Structure
Monitoring adult returns to the hatchery provides information on sex ratios, length information,
and age structure Table 8: brood year; Table 9: return year. USFWS staff uses CWT recoveries
and scale sampling to age fish. Since return year 2011, approximately 89% of adults have
returned to the facility at Age-4 (Table 8). Additionally, approximately 10% have returned as
jacks at Age-3, and 1% have returned at Age-5. No Age-6 returns have been documented. The
facility has a mean of 2,125 adult returns each year. There is a goal to have between 2% and 5%
of jacks in the broodstock based on the percentage of jacks in the wild population and their
estimated contribution during spawning (CTWSRO 2007).
17Table 8. Estimated age structure of adult spring Chinook returns to Warm Springs NFH
by brood year. Non-Warm Springs stock are excluded from this table. Data from CRiS Age
Composition Report 3/25/2021
Brood Year Age-3 Age-4 Age-5 Age-6 Total # Adults
2005 246 2,649 38 0 2,933
2006 591 2,501 71 0 3,163
2007 553 3,047 59 0 3,659
2008 708 1,249 45 0 2,002
2009 46 1,425 7 0 1,478
2010 348 2,082 39 0 2,469
2011 389 6,207 29 0 6,625
2012 389 748 40 0 1,177
2013 5 1,509 2 0 1,516
2014 199 243 7 0 449
2015* 15 354 8 NA NA
2016* 30 373 NA NA NA
2017* 161 NA NA NA NA
Mean 283 1,866 31 0 2,547
Table 9. Total number of adult spring Chinook returns to Warm Springs NFH and
estimated age structure by return year. Non-Warm Springs stock are excluded from this
table. Data from CRiS Age Composition Report 3/25/2021
Return Year Age-3 Age-4 Age-5 Age-6 Total # Adults
2011 708 3,047 71 0 3,826
2012 46 1,249 59 0 1,354
2013 348 1,425 45 0 1,818
2014 389 2,082 7 0 2,478
2015 389 6,207 39 0 6,635
2016 5 748 29 0 782
2017 199 1,509 40 0 1,748
2018 15 243 2 0 260
2019 30 354 7 0 391
2020 161 373 8 0 542
Mean 229 1,724 31 0 1,983
d) Adult Harvest
The WSNFH provides salmon to supplement tribal and sport harvest opportunities in the
Deschutes and Columbia Rivers. Estimates of wild and hatchery spring Chinook are based on
ODFW and CTWSRO creel surveys (Table 10).
18Table 10. Deschutes harvest estimates of wild and WSNFH spring Chinook salmon 2011 -
2020. Estimates based on ODFW and CTWSRO creel surveys. 2011 Warm Springs NFH
harvest is composed of both WS stock and RB (Age 3 and 4) hatchery stock that were
reared and released at WSNFH. Dashed line indicates limited Tribal harvest; however, no
creel survey took place in 2020 due to COVID-19 safety precautions.
Return Wild Harvest Warm Springs NFH Harvest Total
Year Harvest
Adult Jack Adult Jack Adult Jack Adult Jack
Sport Sport Tribal Tribal Sport Sport Tribal Tribal
2011 0 0 10 0 643 265 407 29 1,354
2012 0 0 10 0 156 8 138 3 315
2013 0 0 2 0 0 0 40 134 176
2014 0 0 21 0 436 189 124 22 792
2015 0 0 17 0 0 0 365 23 405
2016 0 0 0 0 955 21 643 19 1,638
2017 0 0 0 0 0 0 172 11 183
2018 0 0 0 0 57 3 9 0 69
2019a 0 0 0 0 0 0 22 0 22
2020a 0 0 - - 0 0 - - -
Mean 0 0 7 0 225 49 213 26 550
a
No Sport Harvest in 2019 or 2020
During the spring Chinook salmon migration period (April 15 - August 30) all fish ascending the
fish ladder are diverted into catch and holding ponds. Fish are sorted, and either passed up stream
if wild appearing (i.e. adipose fin marked), vaccinated and held for broodstock, or surplussed and
given to tribal representatives for distribution. Disposition of fish depends on number of returns,
their condition, and origin (Table 11).
19Table 11. Disposition of hatchery (all stocks) and wild spring Chinook salmon at Warm
Springs NFH, 2011 - 2020. Numbers include spring Chinook salmon adults (age 4-5) and
jacks (age 3) that were surplussed to hatchery broodstock needs before being distributed to
the CTWSRO. Number distributed based on hatchery fish-removal-file records of
distribution of adult fish that returned to Warm Springs NFH prior to August 1 of each
year. Total may include uses not listed.
Hatchery Fish Wild Fish
Surplus Surplus
Year Upstream Donated Dump Brood Transfer Mort Total Upstream Brood Mort Total
2011 39 2,145 5 665 0 155 3,009 809 0 8 817
2012 34 310 0 560 0 65 969 380 0 5 385
2013 63 689 0 482 0 184 1,418 397 0 3 400
2014 0 996 0 194 35 c 486 1,711 761 0 6 767
a
2015 78 4,901 145 615 0 188 6,635 1,369 0 12 1,381
b
2016 0 1,550 3 758 323 d 150 2,784 335 0 13 348
2017 - - - 747 - 80 1,555c - - - 193 e
2018 0 5 0 206 0 47 260 247 0 0 247
2019 0 0 39 259 0 94 394 204 0 0 204
2020 3 0 70 360 0 79 566 10 35 5 50
Mean 24 1,177 26 498 40 161 1,924 501 4 6 479
a
All fish spawned at Little White NFH in 2015
b
645 fish spawned at Little White NFH in 2016
c
Transferred to ODFW for research
d
Transferred to Round Butte
e
No data recorded for other uses of fish in 2017
Data retrieved from Fish Removal file 3/26/2021
2020 Run Reconstruction
Run reconstruction estimates the number of age 3, age 4, and age 5 fish that returned to the
mouth of the Deschutes River for a given brood year. Run reconstruction methods and data can
be found in the annual run forecast reports (Lovtang et al. 2011). In 2020, an estimated 50 wild
and 508 hatchery Warm Springs River spring Chinook (Tables 12 and 13) and 259 Round Butte
hatchery spring Chinook (Table 14) returned to the Deschutes River.
There was limited tribal harvest and no sport harvest in 2020. During the 2020 Deschutes-
Sherars Falls Spring Chinook Harvest, it is likely 50 fish may have been harvested. However,
there were no spring or fall creel surveys due to COVID-19 safety precautions (Mark Manion,
CTWSR).
20Table 12. Run reconstruction of wild spring Chinook salmon from the Warm Springs
River, 2020. Run reconstruction performed 12/18/2020, aging for age 3 fish based on
hatchery records of jacks (fish < 60cm), ages 4 and 5 were estimated based on historical data
(85% of fish > 60cm Age 4).
Location Wild Stock Disposition Age 3 Age 4 Age 5 Total 4 + 5 Total
To WSNFH Upstream of WSNFH 0 9 1 10 10
WSNFH Broodstock 2 28 5 33 35
DIPS/Jumpouts/killed 0 5 0 5 5
Total 2 42 6 48 50
Harvest Sport 0 0 0 0 0
Tribal 0 0 0 0 0
Total 0 0 0 0 0
Below WSNFH Spawned 0 0 0 0 0
Total Estimated Return 2 42 6 48 50
Table 13. Run reconstruction of hatchery spring Chinook salmon from the Warm Springs
River, 2020. Run reconstruction performed 12/18/2020.
Location Hatchery Stock Disposition Age 3 Age 4 Age 5 Total 4 + 5 Total
To WSNFH Upstream of WSNFH 0 0 0 0 0
Surplus 0 0 0 0 0
WSNFH Broodstock 147 352 9 361 508
Strays 0 0 0 0 0
Total 147 352 9 361 508
Harvest Sport* 0 0 0 0 0
Tribal† 0 0 0 0 0
Total 0 0 0 0 0
Total Estimated Return 147 352 9 361 508
*No sport harvest in 2020
†Limited Tribal harvest in 2020
21Table 14. Run reconstruction of hatchery spring Chinook salmon from the Round Butte
Hatchery, 2020. Run reconstruction performed 12/18/2020.
Location Hatchery Stock Age Age Age Total 4 + Total
Disposition 3 4 5 5
To Pelton Trap* Hatchery 33 203 6 209 242
Harvest Sport† 0 0 0 0 0
Tribal‡ 1 16 0 16 17
Total 1 16 0 16 17
Total Estimated Return (RB Stock) 34 219 6 225 259
*Based on size (AD only fish)
†No sport harvest in 2021
‡Limited tribal harvest in 2021
222020 Wild Return and Management
The wild Spring Chinook Salmon population in the Warm Springs River has been below the
minimum escapement goal of 1,000 adults upstream of Warm Springs NFH in nine out of the
last ten years (Table 11). Additionally, pre-spawn mortality of wild fish upstream of the hatchery
(defined as the number of fish per redd) has been increasing in the past 10 years (ranging 10 -15
fish per redd). With the 2020 preseason forecasts for wild adult (ages 4 and 5) Spring Chinook
Salmon returns to the Deschutes Basin ranging from 50 to 300 total returns, the CTWSRO
developed a plan to transport some of the wild adults from Warm Springs NFH to the spawning
areas in the upper watershed. The hope was that transporting the fish would move them upstream
of a possible thermal barrier that was hypothesized to block upstream migrating fish from
reaching the spawning grounds.
In addition to transporting wild adult fish, the CTWSRO began having discussions with the
Service about collecting some of the wild fish for on-hatchery spawning and rearing at Warm
Springs NFH. The preliminary 2020 wild fish plan was to transport 1/3 of the wild adults, collect
1/3 of the wild adults for on-hatchery spawning and rearing, and pass 1/3 of the adults upstream
of the hatchery. Due to the Covid-19 outbreak in March of 2020, and subsequent working
restrictions, no fish were transported upstream and only 10 wild fish were passed upstream
(Table 12). The decision was made in mid-May to collect all wild fish for holding and spawning
at the hatchery. A total of 40 fish were collected at the hatchery, with five of these fish dying
prior to broodstock collection (Table 15, Figure 3).
Monitoring adult returns at the hatchery provided information on sex ratios, length information,
and age structure based on scale samples. Approximately 80% of adults collected at the facility
were Age-4, 10% were jacks at Age-3, and 10% were Age-5; zero Age-6 fish were documented.
(Table 15).
The wild-origin broodstock were sexed by ultrasound, injected with Draxxin, and held separately
from hatchery-origin broodstock in the broodpond closest to natural sunlight. Spawning took
place between August 31st and September 11th and occurred in three takes. A 2x2 spawning
matrix was used to increase the number of family groups and genetic diversity for the
supplementation production. With 2x2 spawning, each wild female's eggs were split into 2
buckets, and 2 wild males were spawned with each female (Figure 4). After time to allow for
fertilization, the 2 buckets of eggs were recombined and placed into incubation trays.
With the supplementation program bringing wild fish into the hatchery program, it was possible
to integrate wild fish into the hatchery population to minimize genetic divergence between Warm
Springs River hatchery and wild stocks. Excess milt from each wild male was spawned with a
hatchery female in standard 1x1 spawning (Figure 4). These wild x hatchery crosses are being
tracked and kept separate during incubation and ponding until a decision is made on their final
disposition (e.g. leave all unmarked and release into the wild or use 50% for hatchery production
and 50% for unmarked wild release).
23Table 15. Total number of wild adult spring Chinook returns to WSNFH, estimated age
structure, and disposition. Data from CRiS Age Composition Report 3/25/2021.
Total Passed Held at WSNFH Hatchery Disposition
Adult Upstream
Return Age 3 Age 4 Age 5 Mortality Spawned
Male 20 1 5 14 0 2 17
Female 28 7 0 16 5 3 18
Unknown 2 2 0 0 0 0 0
Total 50 10 5 30 5 5 35
Wild Adult Return 50 Total Wild
Adult Return
10 Passed
Distribution Upstream (1
Male, 7 Females,
40 Held at
WSNFH
2 Unknown)
Hatchery Survival 5 Mortaltiy 35 Spawned
Wild x Wild 17 Males 18 Females
Spawned
Wild x Hatchery 17 Hatchery
Spawned Females
Figure 3. Wild adult spring Chinook returns to WSNFH and their distribution. Ten fish were
passed upstream, and thirty-five fish were spawned at the hatchery. An additional seventeen
hatchery females were spawned with wild males to integrate wild fish genetics into the hatchery
population.
24Figure 4. A 2x2 spawning matrix was used to increase wild adult spring Chinook family groups
and genetic diversity. Each wild female's eggs were spawned with 2 wild males. Excess milt from
each wild male was spawned with one hatchery female in standard 1x1 spawning.
2021 Run Forecast
There is high confidence that wild adult returns (age 4 and age 5) will be less than 500 fish.
Recent year trends (10-year dataset) indicate >61% probability that the return will be less than
500 fish (Table 16). There is high confidence that hatchery adult returns will be greater than
1,000 fish (Table 16).
Table 16. Forecast Model Predictions of Spring Chinook Salmon Returns to the Deschutes
River in 2021 based on Hand and Haeseker (2011)
Std Reg Std Reg Return Ratio % Age Model
(All data) (10 yr Data) (10 yr Data) (10 yr Data)
Wild Fish Age 4 240 186 28 18
Wild Fish Age 5 8 NA 6 6
Wild Fish Total 248 186 34 24
Prob.Transfers
In recent years, the primary issues related to meeting release goals has been maintaining
broodstock health after they have returned to the hatchery, achieving eye-up, and survival until
marking. This facility has transferred spring Chinook between other state, tribal and federal
hatcheries to make up for loss of eggs, provide relief from high water temperatures, and
accommodate power outages due to hatchery construction. WSNFH stock has been transferred to
Round Butte State Fish Hatchery and vice versa. Round Butte hatchery stock are the preferred
stock for backfilling production shortfalls at WSNFH. Parkdale Hatchery stock have been reared
and released from WSNFH; however, the Parkdale program has been trying to develop their
own, Hood River, stock and the genetic and phenotypic differences between the Parkdale stock
and the WSNFH stock are not fully known. Early results from release of Parkdale stock fish
from WSNFH indicated lower adult returns than the WSNFH stock. An evaluation-of the brood
year 2018 on-hatchery and off-hatchery performance of the WSNFH, Round Butte, and Parkdale
stocks will provide additional information on the similarities and differences Lastly, both adults
and juveniles have been transferred from WSNFH to the Little White Salmon NFH for spawning
and temporary rearing before being transferred back to WSNFH again (Table 17).
Table 17. Transfer dates and total number of spring Chinook from three stocks, (WS)
Warm Springs, (RB) Round Butte, and (P) Parkdale. Transfer locations were to or from
(WS) Warm Springs NFH, (RB) Round Butte State Fish Hatchery, (P) Parkdale Hatchery,
and (LW) Little White NFH.
Transfer Transfer Brood Stock Life stage Transfer Transfer Total #
Year Dates Year From To Transferred
2015 Spring NA WS Adults WS LW 680
2015 Spring NA WS Adults WS RB 708
2015 November 2015 WS Eggs LW WS 926,679
2015 November 2015 WS Eggs RB WS 401,954
2016 Spring 2015 P Juveniles P WS 130,000
2016 Spring 2015 RB Juveniles RB WS 45,000
2016 Summer 2015 WS, RB, P Juveniles WS LW 450,000
2016 July NA WS Adults WS LW NA
2016 November 2016 WS Eggs LW WS NA
2017 June NA WS Adults WS LW NA
2017 Fall 2017 RB Eggs RB WS NA
2018 September 2018 P Eggs P WS 153,538
2018 September 2018 RB Eggs RB WS 249,186
2019 April 2018 RB Fingerlings RB WS 15,000
• 2010 – In early 2007, the water supply to egg trays at WSNFH was inadvertently shut-off
and resulted in egg loss. Round Butte stock (BYs 2006 and 2007) were reared and released
as juveniles at WSNFH to make up for the loss of eggs. In 2010, these fish returned as age 4
and were not included in Warm Springs Broodstock.
26• 2011 - Round Butte stock adults returning as ages 4 and 5 were segregated and not included
in Warm Springs Broodstock (see 2010 note). WSNFH collected eggs surplus to their
production needs. The resulting surplus Warm Springs stock juveniles (approximately
107,000), were marked and released as sub-yearlings into Shitike Creek in spring of 2012.
No monitoring was conducted to determine the fate of Shitike releases.
• 2012 - Round Butte stock adults returning as ages 5 and 6 were segregated and not included
in Warm Springs Broodstock (see 2010 note).
• 2013 - In 2009, the hatchery spawned Warm Springs stock males (~63) with Round Butte
stock females (no data on how many females). Adult returns in 2013 included these Round
Butte-Warm Springs stock crosses but they were not used as broodstock.
• 2014 – High broodpond mortality (70%) was due to disease outbreaks.
• 2015 - Warm Springs stock adults were transferred to Round Butte hatchery to meet Round
Butte program shortfalls.
– ~450,000 Warm Springs stock fertilized eggs were transferred back to WSNFH
from Round Butte State Hatchery in November of 2015. Almost all 92% (>400,000)
eggs died approximately 7-10 days after their transfer. USFWS’s Fish Health
program did an investigation and write-up (Thompson and Goodwin 2016); no cause
for egg loss was identified.
– In July 2015, the remaining Warm Springs stock adults were transferred from
WSNFH to Little White NFH where they were spawned and the eggs moved for
incubation to the Spring Creek National Fish Hatchery (SCNFH) until eye-up, and
then back to the WSNFH for hatching.
– 926,679 green eggs were collected from spawning at Little White NFH and
transferred to WSNFH. There was an unexplained egg loss with an estimated
mortality of 47% (~491,143 eggs survived).
• 2016 - In the spring of 2016, ~ 130,000 Parkdale stock juveniles and ~45,000 Round Butte
stock juveniles were transferred to WSNFH to supplement the 2015 egg loss (all non-WS
stock fish given Left Ventral clip). In summer 2016, concerns about electrical power
interruption during construction prompted the transfer of 450,000 juveniles to Little White
Salmon NFH; ~90,000 juveniles remained at WSNFH. Mortality (marking to release) of
fish transferred to Little White NFH was higher than the fish that remained at WSNFH.
• 2017 - Due to the fear of another year of high egg loss, the hatchery requested surplus brood
year 2017 Spring Chinook salmon eggs from Round Butte state hatchery to help them
cushion expected high egg mortality.
• 2018 - Low Warm Springs stock adult returns in 2018 led to WSNFH requesting and
receiving eggs from both Parkdale hatchery and Round Butte hatchery to augment hatchery
production. These fish were segregated according to their source and received both an
adipose clip and left ventral clip (Round Butte) or right ventral clip (Parkdale) to distinguish
them from the Warm Springs stock upon their return.
27• 2019 - Upon examination of records and better than usual survival, Round Butte State Fish
Hatchery had an excess of approximately 15,000 +/- of brood year 2018 Spring Chinook
salmon fingerlings. These fish were surplus to the needs and above the carrying capacity of
the Round Butte facility and were made available to WSNFH. Warm Springs NFH was
under its station release goal of 750,000 for brood year 2018 due to low returns of brood
fish and a higher than normal post eyed egg loss to a single take of eggs. Warm Springs
NFH was already rearing approximately 234,000 Round Butte source fingerlings on station
from the same brood year. These fish were segregated from the other populations on station,
and received both an adipose clip and left ventral clip to remain consistent with the program
for fish coming from the Round Butte source (Frejie 2019).
Other Fish counted and passed above Warm Springs NFH
The number of stray hatchery steelhead counted at the fish ladder at WSNFH increased
beginning in 1987 but have decreased since 2003. From 1982 to 1986, stray hatchery steelhead
composed a mean of 13.6% (range of 6.6% to 23.0%) of the total number of steelhead counted at
the ladder. Between 1987 and 2003, a mean of 50.9% (range of 34.7% to 66.4%) of the steelhead
counted were stray hatchery fish (Hand and Olson 2003). Since 2011, stray hatchery fish have
decreased to a mean of 10.8% (range of 3% to 16%) of the total number of steelhead counted at
the ladder (Table 18).
Except for Steelhead, counts of other species of fish are intermittent and may not necessarily
reflect total number of fish each year (i.e. dashed lines in Table 18 indicate no data recorded).
Numbers of fish passed upstream of the ladder have declined in recent years. Zero fall and
summer Chinook have been counted passing upstream since 2015. Similarly, the count of
Rainbow and Bull Trout has been below the 10-year mean since 2013. Northern Pikeminnow
have always been rare at the ladder. Since a Lamprey Passage Structure (LPS) was installed in
2018, 40 Pacific Lamprey were counted when a total of seven were counted in the previous
seven years combined.
28Table 1. Counts of wild Steelhead, hatchery Steelhead, Fall Chinook (wild and hatchery combined), Coho (wild and hatchery
combined), Rainbow Trout, Bull Trout, Whitefish, Northern Pikeminnow, Sucker, and Pacific Lamprey counted at the Warm
Springs NFH fish ladder 2009 - 2019. Except for Steelhead, counts are intermittent and may not necessarily reflect total
number of fish each year (-- indicates no data recorded).
Wild Hatchery Fall/Summer Rainbow Bull Northern Pacific
Year Coho Whitefish Sucker
Steelhead Steelhead Chinook Trout Trout Pikeminnow Lamprey
2011 830 131 0 1 100 18 392 0 266 0
2012 219 16 12 206 52 10 190 0 536 6
2013 379 71 3 87 21 9 163 2 697 1
2014 196 30 2 269 16 0 150 0 521 0
2015 356 34 0 -- 17 1 783 0 471 0
2016 280 30 0 -- 17 1 -- 0 236 0
2017 262 8 -- -- -- -- -- -- -- --
2018 -- -- -- 3 -- -- -- -- -- 13a
2019 24 4 0 443 7 0 0 0 0 24a
2020 52 7 6 747 14 1 0 0 0 3a
Mean 289 37 3 251 31 5 240 0 341 5
a
Counted in LPS
Data retrieved from Fish Removal files 2/25/2021
29Past M&E Studies
• 2007 – Comparing Two Methods Used to Mark Juvenile Chinook Salmon: Automated and
Manual Marking (Hand et al. 2010). A study compared the automated fish-marking trailer
to the manual-marking trailer. The automated fish-marking trailer had higher clip quality
and tag retention with no increase in rates of injury or marking to release survival.
• 2008 – Distribution and Survival of Adult Hatchery Spring Chinook Salmon Radio-Tagged
and Released Upstream of Warm Springs NFH in 2008 (Conder et al. 2010). During the
spring and summer of 2008, 35 hatchery-origin spring Chinook salmon were radio-tagged
and released upstream of the hatchery. We studied their movement patterns, identified
potential holding areas, estimated survival, and approximated their contribution to
spawning. Based on tag movements during the spawning period, 60% of the tagged fish
survived to spawning and 31% of the radio-tagged hatchery fish contributed to natural
spawning.
• 2008 – Use of Parentage Analysis to Determine Reproductive Success of Hatchery-Origin
Spring Chinook Salmon Outplanted into Shitike Creek, Oregon (Baumsteiger et al. 2008).
In 2002 and 2003, 83 and 265 adult hatchery salmon, respectively, were outplanted into
Shitike Creek. The number of (juvenile) offspring attributed to an individual (adult)
outplant was variable, ranging from 1 to more than 10. This study shows that under the right
conditions, outplanted adult hatchery fish taken from localized hatchery stocks can
contribute to the overall juvenile production in a natural stream. Outplanting adult salmon
from Warm Springs NFH into Shitike Creek continued through 2005 (Hand et al. 2005).
• 2010 – Feasibility of live spawning wild male spring Chinook salmon at Warm Springs
NFH, 2010 Report (Hand et al. 2014b). We evaluated the feasibility of using live-spawned
wild males to provide a genetic contribution to both the hatchery broodstock and natural
production by live-spawning five wild males and releasing the fish back into the Warm
Springs River. It appeared that live-spawning of wild males may be a feasible method to
include wild genetics into the hatchery broodstock while not compromising the overall wild
production.
• 2012 – Effectiveness of an integrated hatchery program: Can genetic-based performance
differences between hatchery and wild Chinook salmon be avoided? (Hayes et al. 2013).
The authors evaluated the performance of fish from hatchery, wild, and crossed populations
in hatchery and stream environments. Hatchery fish performed differently than wild fish
possibly because they were accustomed to rearing at higher densities in a hatchery setting
(domestication) leading to genetic divergence. Future studies are needed to evaluate which
hatchery techniques are most useful for reducing performance differences and reducing risk
to wild populations.
• 2013 – An Evaluation of Rearing Densities to Improve Growth and Survival of Hatchery
Spring Chinook Salmon (Olson and Paiya 2013). For three consecutive brood years
(BY2000-02), density treatments consisted of low, medium, and high groups in 57.8-m3
raceways with approximately 16,000, 24,000, and 32,000 fish/raceway, respectively. Fish
reared at high density exhibited the highest on-hatchery mortality rate during two brood
30You can also read