BRT REA VAYA PHASE 1A AND 1B, SOUTH AFRICA - VCS Project Document Version 1.1 20/04/2011 - carbonn ...
←
→
Page content transcription
If your browser does not render page correctly, please read the page content below
VCS Project Document
BRT REA VAYA PHASE 1A AND 1B, SOUTH
                              AFRICA

                              Version 1.1

                              20/04/2011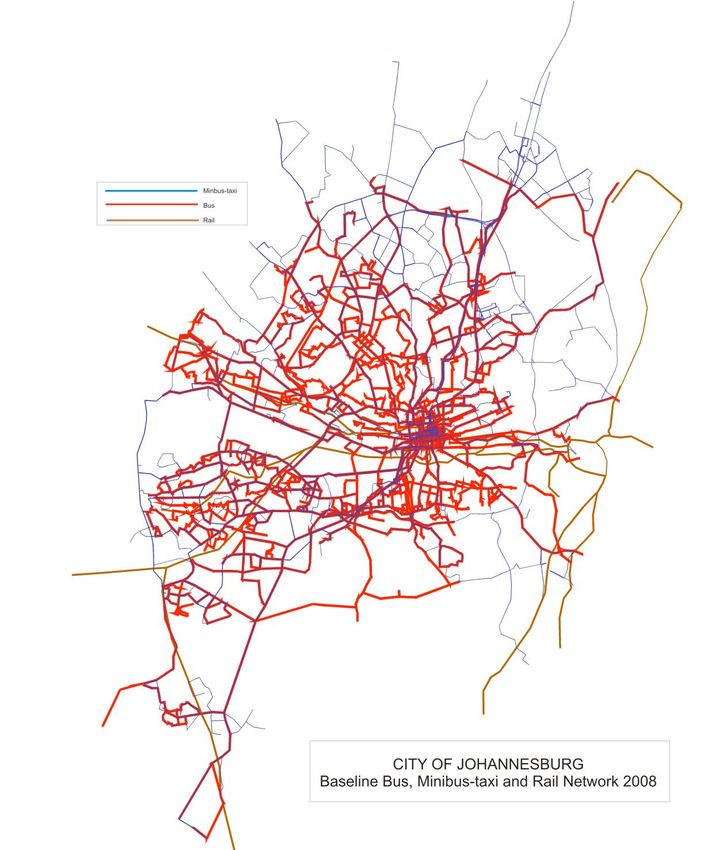
BRT Rea Vaya Phase 1A and 1B, South Africa

Project Title                                Date of Issue
BRT Rea Vaya Phase 1A and 1B, South Africa   20/04/2011
Version                                      Report Prepared By
1.1                                          Jürg M. Grütter, Grütter Consulting AG
                                             Thiersteinerstr. 22/5, 4153 Reinach, Switzerland
                                             jgruetter@gmail.com
                                             www.transport-ghg.com

Grütter Consulting                                                                        Page 2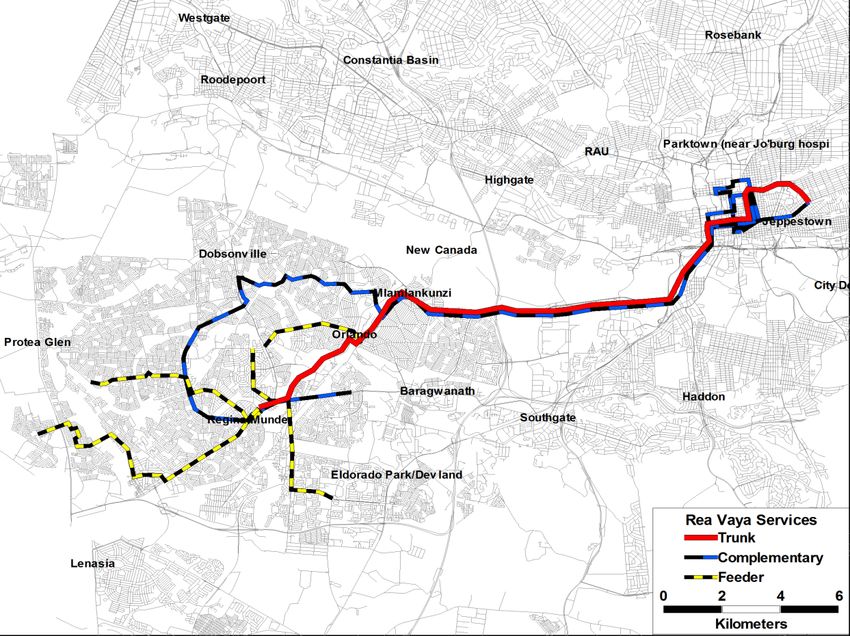
BRT Rea Vaya Phase 1A and 1B, South Africa

Table of Contents
1.     PROJECT DETAILS                                                             5
       1.1.    Summary Description of Project                                      5
       1.2.    Sectoral Scope and Project Type                                     5
       1.3.    Project Proponent                                                   5
       1.4.    Other Project Participants                                          6
       1.5.    Project Start Date and Project Crediting Period                     7
       1.6.    Estimated GHG Emission Reductions of Removals                       7
       1.7.    Description of Project Activity                                     8
       1.8.    Project Location                                                   20
       1.9.    Conditions Prior to Project Initiation                             20
       1.10.   Compliance with Laws, Statues and Other Regulatory Framework       25
       1.11.   Participation under Other GHG Programs                             26
       1.12.   Other Forms of Environmental Credit                                27
       1.13.   Additional Information Relevant to the Project                     27
2.     APPLICATION OF METHODOLOGY                                                 27
       2.1.    Title and Reference of Methodology                                 27
       2.2.    Applicability of Methodology                                       27
       2.3.    GHG Sources, Sinks and Reservoirs                                  28
       2.4.    Baseline                                                           29
       2.5.    Demonstration and Assessment of Additionality                      33
       2.6.    Methodology Deviations                                             38
3.     MONITORING                                                                 39
       3.1.    Data and Parameters Available at Validation                        39
       3.2.    Data and Parameters Monitored                                      44
       3.3.    Description of the Monitoring Plan                                 48
4.     EX-ANTE CALCULATION OF GHG EMISSION REDUCTIONS AND REMOVALS                50
       4.1.    Baseline Emissions                                                 50
       4.2.    Project Emissions                                                  58
       4.3.    Leakage                                                            59
       4.4.    Net GHG Emission Reductions and Removals                           63
Grütter Consulting                                                            Page 3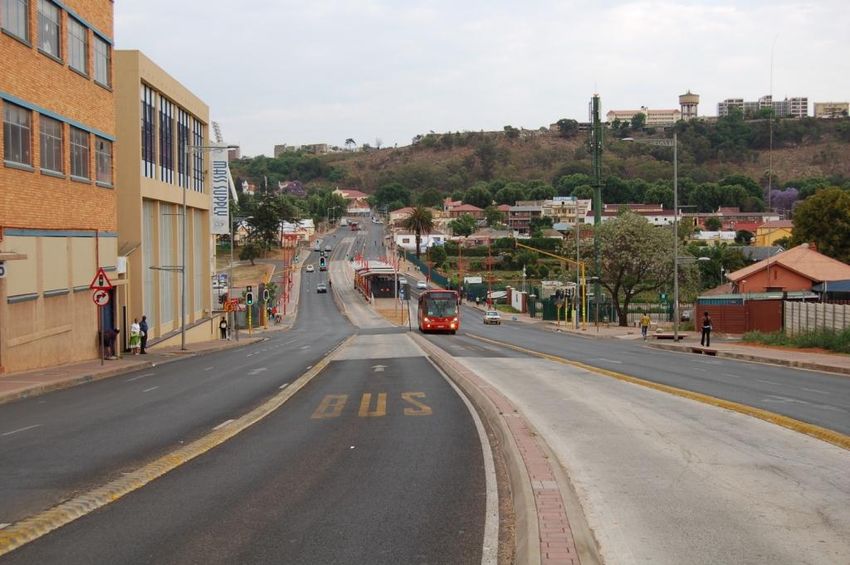
BRT Rea Vaya Phase 1A and 1B, South Africa

5.     ENVIRONMENTAL IMPACT                                     65
6.     STAKEHOLDER COMMENTS                                     67
7.     OWNERSHIP                                                69
       7.1.   Proof of Title                                    69
       7.2.   Emissions Trading Programs                        69
ANNEX 1A: ROUTES REA VAYA PHASE 1A                              70
ANNEX 1B: ROUTES REA VAYA PHASE 1B                              70
ANNEX 2: PASSENGER SURVEY                                       72
ANNEX 3: REFERENCED FILES                                       76

Grütter Consulting                                          Page 4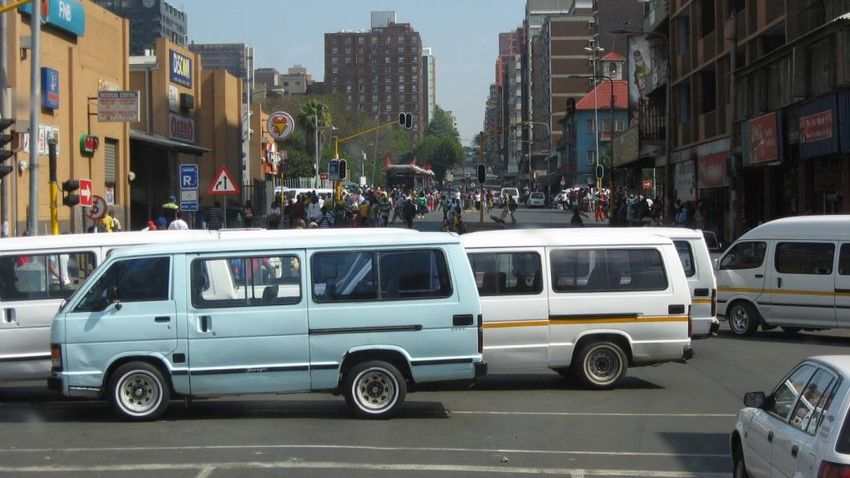
BRT Rea Vaya Phase 1A and 1B, South Africa

      1. Project Details

      1.1.     Summary Description of Project

The objective of the BRT (Bus Rapid Transit) Rea Vaya in Johannesburg, South Africa is to establish an
efficient, safe, rapid, convenient, comfortable and effective modern mass transit system based on a
BRT system. The Metropolitan area of the city of Johannesburg has a population of around 3.2
million inhabitants distributed over 1,644 sqkm1. The situation before the project is around 1 million
vehicles plying the streets of the City of Johannesburg comprising around 800,000 private cars,
40,000 motorcycles, 50,000 taxis and around 50,000 public transit mini-buses and buses2. The city
has also a rail system operating into the city for suburban trips.

The PD includes Phase 1A and 1B of Rea Vaya with 2 exclusive BRT bus lanes plus their
complementary and feeder lines. The first line entered operations August 30th 2009 while the 2nd line
is under construction. The geographical boundary of the project is the metropolitan area of the city
of Johannesburg. Gases included are CO2, CH4 and N2O.

The pre-project situation as well as changes in detail with the project is described in chapter 1.7. The
baseline situation is that passengers would use conventional modes of transport including buses,
minibus-taxis, cars, suburban train, motorcycles and Non-Motorized Transport thus causing baseline
trip emissions in absence of the project. Project emissions are based on the actual fuel consumption
of buses forming part of the project. Leakage emissions are caused by changes of congestion and
speed resulting potentially in a rebound and a speed effect plus potential change of load factors of
remaining buses and minibus-taxis in the city. Emission reductions are the result of reduced GHG
(Greenhouse Gases) emissions per passenger trip comparing the baseline with the project situation.

Average expected emission reductions of the project are 39,829 tCO2 avoided per annum.

      1.2.     Sectoral Scope and Project Type

Sectoral scope 7: Transport

Grouped project: No

VCS 2007.1 is used for this PD.

      1.3.     Project Proponent

Organization:               City of Johannesburg: Transportation Department
Street/P.O.Box:             Johannesburg Roads Agency Building, 66 Sauer Street, Johannesburg
City:                       Johannesburg
Postfix/ZIP:                2017

1
    File 10, see http://www.joburg-archive.co.za/2007/pdfs/joburg_overview2.pdf
2
    File 1
Grütter Consulting                                                                              Page 5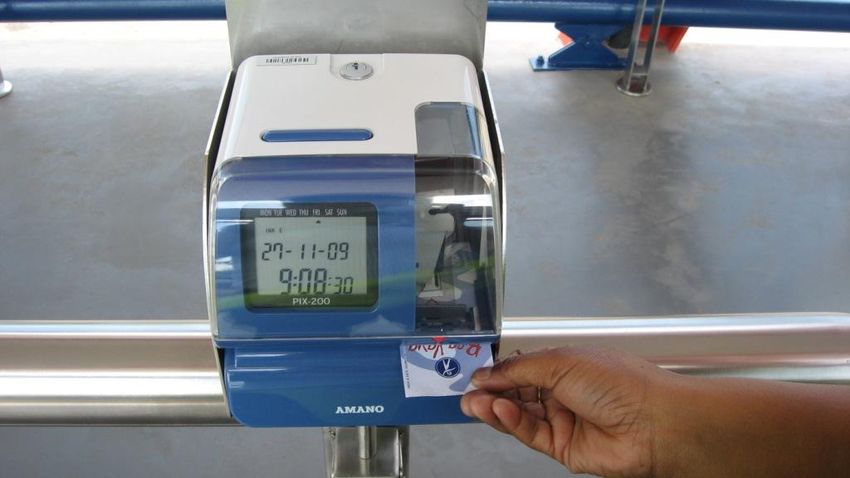
BRT Rea Vaya Phase 1A and 1B, South Africa
Country: South Africa
Telephone: +27 11 870 4500
E-Mail: andrevan@joburg.org.za
URL:
Represented by: Andre van Niekerk
Title: Mr
Last Name: Van Niekerk
Middle Name: Jacobus
First Name: Andre
Mobile: +27 83 785 1384
Direct Tel: +27 11 870 4608
Personal E-Mail: N/A
The project proponent “Transportation Department” is responsible for:
Project investment;
Project implementation;
Project operation; and
VCS Project monitoring.
1.4. Other Project Participants
Organization: City of Johannesburg: Environment and Infrastructure Department
Street/P.O.Box: 118 Jorissen Street, 6th Floor Traduna House
City: Johannesburg
Postfix/ZIP: 2017
Country: South Africa
Telephone: +27 11 587 4251
E-Mail: LindaP@joburg.org.za
URL: www.joburg.org.za
Represented by: Linda Phalatse
Title: Head of Climate Change & Resilience
Last Name: Phalatse
Middle Name:
First Name: Linda
Mobile: +27 83 544 0998
Direct Tel: +27 11 587 4251
Personal E-Mail: Linda.Phalatse410@gmail.com
This project participant is responsible for:
2. Promoting design, coordination and implementation of projects that reduce Greenhouse
Gases
3. Overall Environmental Management Policy and Planning
Grütter Consulting Page 6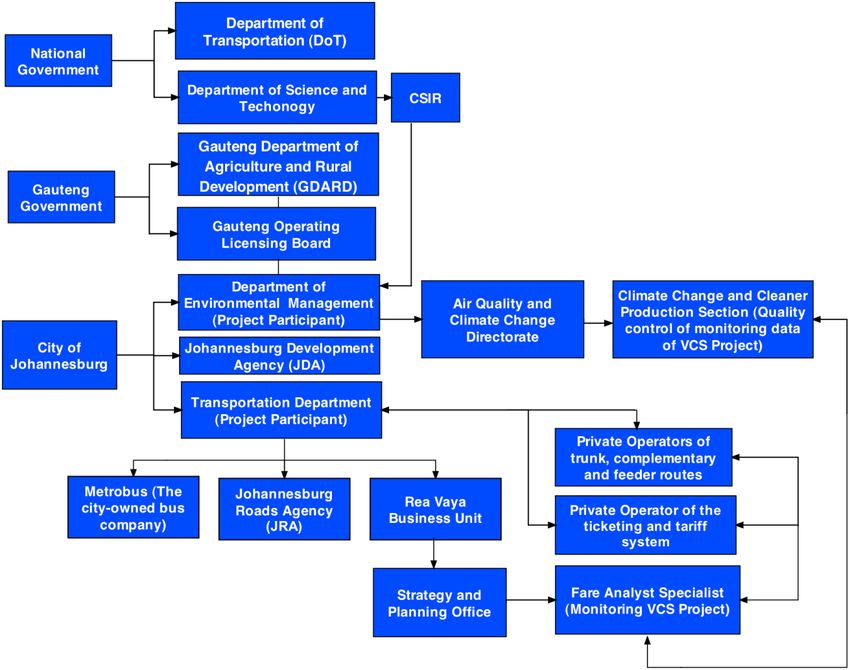
BRT Rea Vaya Phase 1A and 1B, South Africa
4. Ensure data and information quality control in the crediting period
Organization: Grütter Consulting AG
Street/P.O.Box: Thiersteinerstr. 22/5
City: Reinach
Postfix/ZIP: 4153
Country: Switzerland
Telephone: ++591 2278 84 74
E-Mail: jgruetter@gmail.com
URL: www.transport-ghg.com
Represented by:
Title: CEO
Last Name: Grütter
Middle Name: Michael
First Name: Jürg
Mobile: ++591 705 82 987
Direct Tel: ++591 2278 84 74
Personal E-Mail: jgruetter@gmail.com
Grütter Consulting is responsible for all aspects concerning relation of the project to carbon finance
including:
Methodology formulation (author of the CDM methodology AM0031 used for this project);
Project document formulation.
Grütter Consulting has no property rights on emission reduction credits.
1.5. Project Start Date and Project Crediting Period
Based on VCS Program Document 2010 the definition of the project start date is the “date on which
the project began generating GHG emission reductions or removals”.
Project start date: 30/08/20093
First Project crediting period: 01/01/2012 to 31/12/2021
1.6. Estimated GHG Emission Reductions of Removals
Scale: Project according to VCS.
Table 1: Estimated GHG Emission Reductions
Year Estimation of emission reductions in tCO2eq
2012 42,463
3
File 11, see: http://www.reavaya.org.za/photo-gallery/historic-day/category/2
Grütter Consulting Page 7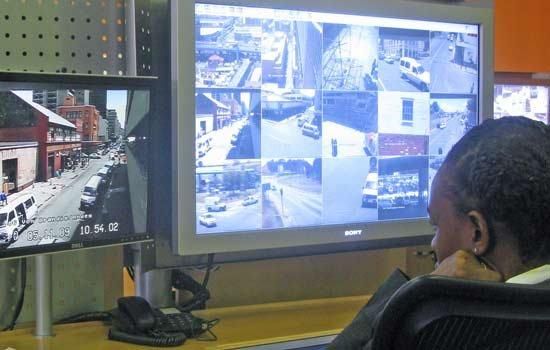
BRT Rea Vaya Phase 1A and 1B, South Africa
2013 41,862
2014 41,267
2015 40,678
2016 40,095
2017 39,517
2018 38,946
2019 38,380
2020 37,819
2021 37,265
Total 398,292
1.7. Description of Project Activity
Project Chronology
Step (expected date)
Project start date 30/08/2009
PD finalization 02/2011
Crediting period start 01/2012
Monitoring reports Annual; 1st report early 2013
1st crediting period 1/2012 to 12/2021
Project termination Not limited, minimum 35 years
Organizational Aspects
From an organizational viewpoint the System has regulators, managers and operators:
The national Department of Transport (DoT) of South Africa4 is a national public entity, which
is in charge of national transportation policies, regulations and plans.
The Council for Scientific and Industrial Research (CSIR5) is a statutory research council,
established by Government. The CSIR is part of the Department of Science and Techonology6
(national public entity). The CSIR performed the environmental baseline study for
Department of Environmental Management.
4
http://www.transport.gov.za
5
http://www.csir.co.za/
6
http://www.dst.gov.za
Grütter Consulting Page 8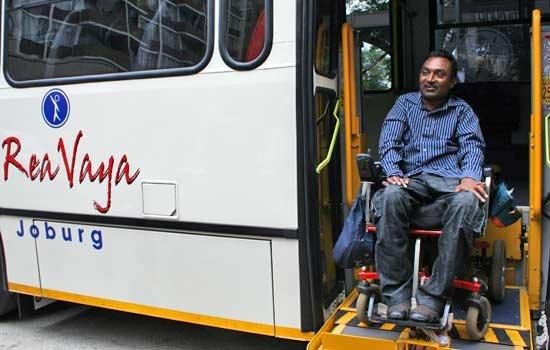
BRT Rea Vaya Phase 1A and 1B, South Africa
The provincial Gauteng Operating Licensing Board is responsible for issuing operating
licenses required for the operation of public transport services in Johannesburg.
The Gauteng Department of Agriculture and Rural Development (GDARD)7 is the
environmental authority of the Government of Gauteng, which issues technical concepts and
authorizations regarding the mitigation measures of environmental impacts.
The City of Johannesburg’s Department of Environmental Management8 is a public entity,
which is responsible for environmental policy and strategy in the City of Johannesburg. The
Department of Environmental Management through its Air Quality and Climate Change
directorate promotes the design, coordination and implementation of projects that reduce
Greenhouse Gases in the City of Johannesburg.
The Transportation Department9 is the regulatory authority for the City of Johannesburg. It is
responsible for the development of strategy and programmes and plans to direct and
manage the private, business and public transport systems in Johannesburg10. The
Transportation Department must approve any operating license before it is issued by the
Gauteng Operating Licencing Board, and it is responsible for planning transportation services
and road infrastructure in the City of Johannesburg.
The Transportion Department oversees two other City entities: the Johannestburg Roads
Agency (JRA) 11 and Metrobus12. The JRA is responsible for the design, maintenance, repair
and development of Johannesburg's road network and maintains the trunk complementary
and feeder route infrastructure, and Metrobus is the City's public transport provider (the
city-owned bus company).
The Johannesburg Development Agency (JDA)13 is a public entity that promotes productive
partnerships and cooperation between all relevant stakeholders of the BRT system. It has
been responsible for the construction of the depots, trunk routes and stations of Rea Vaya
Phase 1A and 1B.
Rea Vaya14 is the system manager and is a business unit within the Transportation
Department. The system manager plans, manages and controls the BRT system.
A private operator15 (in the future potentially various private operators), which invests in
buses and operates the trunk, feeder and complementary routes of Rea Vaya. Operators
have a termed contract awarded in a procurement process, which was a negotiated process
in Phase 1A, by the Transportation Department.
A private operator, which acquires, installs and operates the ticketing and tariff system and is
responsible for the fare collection and distribution. The operator has a termed contract
awarded in an open and competitive bidding process by the Transport Department
7
http://www.gdard.gpg.gov.za
8
http://www.joburg.org.za/index.php?option=com_content&task=view&id=968&Itemid=114
9
http://www.joburg.org.za/content/view/1226/78/
1010
The Transportation Department designs polices and laws for minibus taxi and conventional buses
(Metrobus and PUTCO).
11
http://www.joburg.org.za/content/view/58/71/
12
http://www.joburg.org.za/index.php?option=com_content&task=view&id=59&Itemid=71&limit=1
13
http://www.jda.org.za/what-we-do
14
http://www.reavaya.org.za/
15
Note: Phase 1A operations are presently being (until February 2011) by a temporary company (special
purpose vehicle) established by the City of Johannesburg. This company, called Clidet 957 (Pty) Ltd, will be
taken over by the shareholders from the taxi industry.
Grütter Consulting Page 9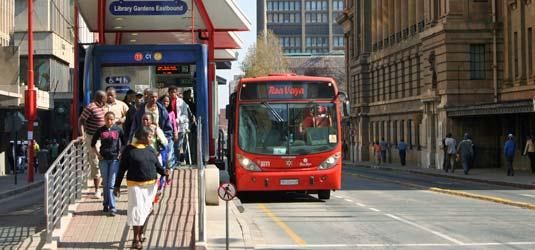
BRT Rea Vaya Phase 1A and 1B, South Africa

The entities that take part in the development and monitoring of the VCS Project are:

    1. The Transportation Department through the Strategy and Planning Office (Fare Analyst
       Specialist) in the Rea Vaya business unit is the focal point of the VCS Project. This directorate
       will be in charge of managing all data and the monitoring reports in relation to the VCS
       project.
    2. The Department of Environmental Management through the Air Quality and Climate Change
       is a project paticipant. The Climate Change and Cleaner Production Section of Air Quality and
       Climate Change directorate is in charge of performing data and information quality control of
       the VCS project in the crediting period.

Figure 1: Organization Chart of the Project

Features of the System

Features of the BRT Rea Vaya include exclusive right-of-way lanes, rapid boarding and alighting, pre-
board fare collection and fare verification for trunk routes, enclosed trunk route stations, clear route
maps, real-time information displays, automatic vehicle location technology to manage vehicle
movements, effective reform of the existing institutional structures for public transit, clean vehicle

Grütter Consulting                                                                             Page 10
BRT Rea Vaya Phase 1A and 1B, South Africa
technologies and excellence in marketing and customer service. The technology deployed has 4 main
components being infrastructure, buses, transit management and fare system.
Infrastructure
The project plans to establish in total 43 km of exclusive separated bus lanes including new bus-
stations16. Phase 1A and 1B included in the PD has a total distance of trunk routes of 43 km. The
system has trunk, complementary and feeder routes:
Rea Vaya Trunk route: Busway located between mixed traffic lanes, purpose-built to carry
the weight of high-frequency, fully laden, articulated buses, with stations allowing level
boarding built in the bus way for the exclusive use of buses designed to interface with them,
typically through right-handed bus doors and a bus floor 940mm from the ground. Routes
connect major passenger origins and destinations.
Rea Vaya Complementary routes: Routes using a combination of normal mixed traffic roads
and Rea Vaya trunk route/s, and connecting major passenger origins and destinations, served
by buses able to interface with both kerbside Rea Vaya bus stops and median Rea Vaya
stations (with left-handed and right-handed doors).
Rea Vaya Feeder routes: Routes terminating or commencing at a Rea Vaya station, using
normal mixed traffic roads, and connecting areas of significant passenger origins to a Rea
Vaya trunk or complementary route, either kerbside outside the station, or at the station
itself (such buses requiring left-handed and right-handed doors).
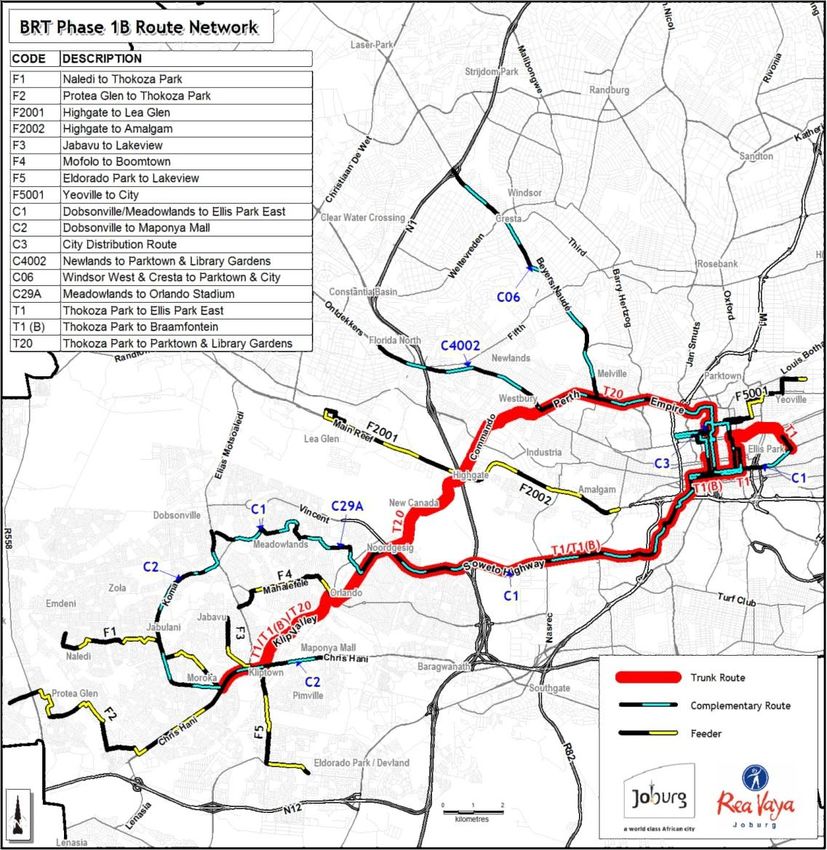
The Phase 1A trunk route17 has a length of 25km18 and 27 stations. It is complemented by 5 feeder
routes totalling 54km to increase the catchment area (See Annex 1). The 4 complementary routes
totalling 90km improve the system coverage. Figure 1 shows the Routes of Phase 1A. A list of routes
of Phase 1A is included in Annex 1A.
The Phase 1B trunk route19 has a length of 18km. It is complemented by 12 feeder routes totalling
62km20 to increase the catchment area and 6 complementary routes totalling 82km21 to improve the
system coverage22. Figure 2 shows the Routes of Phase 1A and 1B. A list of routes of Phase IB is
included in Annex 1B.
Figure 1: BRT Rea Vaya Phase 1A Routes
16
File 9, p.3
17
See File 13; Phase 1A was revised in 2008
18
One-way, File 13, slide 2
19
See File 14 p.5; Phase 1B was revised downwards 2010
20
One-way, File 14, p. 14
21
One-way, File 14, p. 14
22
File 14, p. 8/9
Grütter Consulting Page 11BRT Rea Vaya Phase 1A and 1B, South Africa Source: File 13, slide 4 Grütter Consulting Page 12
BRT Rea Vaya Phase 1A and 1B, South Africa

Figure 2: BRT Rea Vaya Phase 1A and 1B Routes

Source: File 14, p. 9

Routes of feeder and complementary lines as well as distances might change over time due to city
development, experience with operations of lines as well as changing transit demand.

Grütter Consulting                                                                      Page 13
BRT Rea Vaya Phase 1A and 1B, South Africa

Photo 1: Trunk Route BRT Rea Vaya

In the city centre the stations have a distance between each of 500m23. Each station has a modular
design to ensure uniformity of the corridor’s image with obstacle-free waiting areas and elevated
level-access to articulated buses with a high platform. All trunk route stations have access ramps for
mobility-impaired passengers.

Photo 2: BRT Rea Vaya Stations

Bus Technology

Technology used is Euro IV diesel units with particle filter for trunk, complementary and feeder
buses24. According to national standards only Euro III would have been required i.e. the project buses

23
     File 15, slide 24
24
     File 16, see http://www.reavaya.org.za/component/content/article/84-january/81-success
Grütter Consulting                                                                            Page 14
BRT Rea Vaya Phase 1A and 1B, South Africa over-achieve the national standards25. Trunk buses are new articulated 18m units with a design capacity of 112 persons with platform-level access including room for disabled persons. Feeder and complementary buses have a design capacity of 81 passengers26. As projected in total around 81 articulated buses and 197 complementary and feeder buses will be used in the project for Phase 1A and 1B27. The number of units can change due to actual passenger demand and experience gained during operations. Photo 3: Rea Vaya Trunk and Complimentary/Feeder Bus Diesel used by the project has 50ppm of sulphur28. The Particle Matter (PM) and NOx emissions of project buses are significantly lower compared to conventional baseline buses operating currently in Johannesburg which have an average model year of 2001 for buses and of 1997 for minibuses meaning that a large number of conventional buses are Euro II, Euro I or elder.29 Also Euro IV is better than the minimum standard for new diesel buses (Euro III) legally required. Figure 4 compares the emission of different Euro categories of HDVs (Heavy Duty Vehicles). Project vehicles thereby comply with the standard Euro IV. Particle matter emissions of Euro IV engines are factor 20 lower than Euro I and for NOx Euro IV emissions are 3 times lower than Euro I units thus demonstrating the highly significant local emission reductions of project versus baseline buses. Particle as well as NOx (an important pre-cursor of ground-level ozone) emissions are thereby critical components of local air quality. Figure 4: Emissions of Particle Matter and NOx (Indexed)30 25 File 16, p.3 26 File 16, p.3 27 See File 7 for bus data 28 File 16, p.3 29 File 1; Metrobus e.g. runs Euro 0, II and III buses, see File 17 30 Euro 0 standard had no particulate limits Grütter Consulting Page 15
BRT Rea Vaya Phase 1A and 1B, South Africa

               120
               100
               80
       Index

               60
               40
               20
                0
                      Euro 0            Euro I           Euro II      Euro III       Euro IV

                                                 Particle Matter    NOx

Source: Regulations 88/77/EWG for Euro 0; 91/542/EWG for Euro I and II; 1999/96/EG for Euro III
and IV

The bus manufacturer has offered driver and technical (mechanic) training transformation of skills by
providing SETA accredited business principles, management training and executive coaching to
enhance the business skills of the Phase 1A Operators to ensure the smooth running of the unit
responsible for the maintenance and repairs of the vehicles to achieve maximum up time31.

Transit Management

The operational fleet centre manages trunk bus dispatch, informs passengers, produces reports and
maintains records. Trunk buses are equipped with GPS (Global Positioning System) to identify their
position and track distance driven32. This is linked to the operation centre.

31
     File 16, p.5
32
     File 24, see http://www.joburg.org.za/content/view/4399/266/
Grütter Consulting                                                                          Page 16
BRT Rea Vaya Phase 1A and 1B, South Africa Photo 4: Rea Vaya Operation Centre The novelty of the operational fleet centre is that an efficient management of bus fleets and bus dispatch can take place optimizing load factors through coordinated scheduling of service. Also passengers have real-time information about the next available bus and are informed of potential transit problems. Fare System The system is based on pre-board ticketing. Tickets can be bought at Rea Vaya stations or at selected and clearly marked shops near the stations33. This streamlines the boarding process, allows drivers to concentrate on bus operations and plays a key role in optimizing operations. Tickets are separated in inner-city circular routes, trunk routes and feeder + trunk routes34. Currently Rea Vaya operates with a paper ticketing system which will be replaced with automatic fare collection gates around April 2011. 33 Vendor information can be found on the Rea Vaya website see http://www.reavaya.org.za/consumer- information/ticket-information- 34 see http://www.reavaya.org.za/consumer-information/ticket-information- Grütter Consulting Page 17
BRT Rea Vaya Phase 1A and 1B, South Africa

Photo 5: Ticketing

Relation to Existing Transport Sector and Fleet Scrapping

The existing public transit routes will be re-organized and units are taken out of service in the
metropolitan area of Johannesburg as the new system requires fewer buses and mini-buses for the
same level of service through the usage of larger units and through improved occupation rates35. The
shareholders of the Phase 1A Bus Operating Company were all operating minibus-taxis on the routes
affected by Phase 1A. It was agreed in the negotiations between the City of Johannesburg and
representatives of affected minibus-taxi operators that 585 minibus-taxis must be withdrawn from
the affected BRT Phase 1A routes and that their operating licences allowing them to operate a public
transport service must be cancelled. This is covered in the Participation Framework Agreement and
confirmed in the Negotiation Closure Agreement36. The City agreed to pay compensation for loss of
income to the owners removing their vehicles in the interim stages. Several compensation for loss of
income agreements were signed between the City and taxi representatives. In South Africa there is a
minibus-taxi recapitalisation programme. Taxi owners can submit old minibus-taxis to the
government-appointed Taxi Scrapping Agency for scrapping, and they receive a payment of R 54,300.
They have to have all the correct documentation and operating licence for the vehicle. By October
2010, a total of 313 minibus-taxi owners had submitted 579 vehicles and operating licences to the
City in order to become the final shareholders. The six vehicles allocated to Faraday Taxi Association
are excluded as their members did not participate in the negotiations. However, their shares are
being reserved for a year, and they may come forward and remove these minibus-taxis from the
road. In return for surrendering their vehicles and operating licences, the owners will receive one
share per vehicle surrendered in the Phase 1A Bus Operating Company that will operate Phase 1A.

35
   See File 15 slide 18 for the original design of affected, diverted and reduced routes for entire Phase I (original
Phase I planning, which was significantly longer than new Phase 1A and 1B )
36
   See File 18 for vehicle scrapping details; File 19 for signed Participation Framework Agreement; File 20
Negotiation Closure Agreement; File 21 Letter Scrapping Agency; File 22 Plenary Resolution Annexure; File 23
taxi scrapping database
Grütter Consulting                                                                                          Page 18
BRT Rea Vaya Phase 1A and 1B, South Africa
The company will be 100%-owned by these former taxi operators. They must each invest R 54,000
equity per share into the company. Phase 1A operations are presently being operated by a
temporary company (special purpose vehicle) established by the City of Johannesburg. This company,
called Clidet, will be taken over by the shareholders from the taxi industry. Takeover is likely to
happen in January 2011, when the 12-year operating contract will commence.
Technology Transfer
The project uses EST (Environmentally Sound Technologies) and best practices in BRT including Euro
4 buses, electronic tracking of buses and pre-board ticketing. The first BRT was established in
Curitiba, Brazil in the 70ties. Bogota/Colombia then took a leading role early this Century in world-
class BRT systems. The system approach of Bogota was then reproduced in the BRT Rea Vaya37.
Various international organizations or companies have been involved in the BRT Rea Vaya and in
technology transfer from other countries including ITDP (Institute for Transportation & Development
Policy; see File 12), GTZ, the Clinton Foundation and Logit (Brazilian company responsible for design
of Phases 1A and full Phase 1, see e.g. File 15). Buses for Phase 1A were imported from Brazil38.
Emission Reduction Measures of Rea Vaya
The BRT Rea Vaya reduces GHG emissions by improving the resource efficiency of transporting
passengers in the urban area of Johannesburg i.e. emissions per passenger trip are reduced
compared to the situation without project. This is realized through the following changes:
Improved efficiency: new and larger buses are used which have an improved fuel efficiency
per passenger transported compared with those used in the absence of the project39. On
trunk routes the project uses articulated buses with a design capacity of 112 passengers,
which is factor 7 the minibus-taxi capacity of 16 passengers replaced basically40.
Mode switching: The BRT system is more attractive to clients due to reduced transport times,
increased safety and reliability and more attractive buses. It can thus attract private car and
minibus-taxi users with higher emission rates to switch to BRT buses.
Load increase or change in occupancy: The BRT has a centrally managed organisation
dispatching vehicles on trunk routes. The occupancy rate of vehicles can thus be increased
due to organisational measures. The baseline public transit system is characterized through a
large number of private companies competing for the same passengers resulting in an
oversupply of mini-buses and low occupation rates.
Reduction of the existing fleet of minibus-taxis and buses through public transit re-
organization and minibus-taxi scrapping (see former paragraph). This is an integral part of
the BRT project.
Sustainable Development Impact
The project contributes to sustainable development in a significant manner:
37
See e.g. File 12 of the scoping study for the BRT Rea Vaya performed by ITDP.
38
File 16, p.4
39
Increased efficiency basically due to usage of larger units with less fuel consumption per passenger plus bus-
only lanes which allow for higher average speeds and less stop and go traffic of buses.
40
File 1 capacity of minibus-taxis; see scrapping and relation to existing transport system for bus type replaced
Grütter Consulting Page 19BRT Rea Vaya Phase 1A and 1B, South Africa
Improved environment through less GHG and other air pollutant emissions, specifically
particle matter, NOx and sulphur dioxide. This is achieved through a more efficient transport
system and through new buses.
Improved social wellbeing as a result of less time lost in congestion, less respiratory diseases
due to less particle matter pollution, less noise pollution and fewer accidents per passenger
transported.
Fewer accidents due to improved public transit organization and management.
Socio-economic and environmental benefits due to reduced time for transport41, less
congestion, and improved air quality.
Policies
The national « Transport Legislation, Policies and Strategies” published 200942 includes the
national strategies on transport.
No policy with a measurable impact on GHG emissions related to the project has been identified.
In terms of NMT Johannesburg has a NMT framework43. However this has no incidence on the
project.
In terms of alternative fuels South Africa has a national biofuel strategy proposing a 2% biofuel
blend44. If implemented the project monitors the biofuel blend based on AM0031.
1.8. Project Location
The project is located within the Metropolitan Area of Johannesburg which includes 7 regions45. The
geographical boundary of the project is the routes from origin to destination used by the people. The
project itself includes all feeder, complementary and trunk bus routes of the BRT Rea Vaya Phase 1A
and 1B. In the baseline situation people make the same trips but would have used potentially
different routes. The geographical location of the project is thus the Metropolitan Area of
Johannesburg.
The city of Johannesburg has the geographical coordinates of 26° 12′ S, 28° 2’ E. 46
1.9. Conditions Prior to Project Initiation
The pre-project scenario is the usage of buses, minibus-taxis, metered taxis, passenger cars,
motorcycles, sub-urban train and NMT (Non-Motorized Transit) for transit purposes. All of these
transit modes are partially substituted by the project. The baseline situation is that in absence of the
project activity these modes of transit would continue to operate being renovated under BAU
41
File 25 p. 23
42
File 39
43
File 40
44
File 41, p. 3
45
File 10, section 4
46
http://en.wikipedia.org/wiki/Johannesburg
Grütter Consulting Page 20BRT Rea Vaya Phase 1A and 1B, South Africa
(Business As Usual). This is reflected in the technology improvement factor applied to baseline
emission factors per mode of transport.
The share of public transit in trips has been steadily declining. In 1995 the ratio of private to public
modes was 40% to 60%, in 1998 43% to 57% and in 2002 53% to 47% i.e. in less than a decade the
share of public transit users dropped by 13 percentage points47. This trend is not solely the result of
increasing car ownership, but also of the relative decline in that segment of trip makers who chose to
use public transport (the so called ‘selective’ segment of the trip making population). Figure 5 shows
the mode usage as of 2001 for all modes and figure 6 for motorized modes only. Car, followed by
walking and minibus-taxi are the dominant trip modes accounting for over 90% of all trips made.
Considering only motorized trip modes the predominant part is by cars with over 50% followed by
minibus-taxis with 35%. Other modes play a minor role.
47
File 6, p. 50
Grütter Consulting Page 21BRT Rea Vaya Phase 1A and 1B, South Africa
Figure 5: Share of Modes for All Trips in Johannesburg 2001 (Include all Modes)
Series1, Bus, Series1, Bicycle, Series1, Series1, Other
44002, 3% 3166, 0% Motorbike, Mode
1321, 0% Combinations,
Series1, Train,
24392, 2%
71979, 4%
Car
Walk
Series1, Car, Minibus-taxi
Series1, Minibus- 580988, 37%
taxi, 371737, 23% Train
Bus
Other Mode Combinations
Bicycle
Motorbike
Series1, Walk,
491018, 31%
Source: File 6 Table 3.29, p 53
Figure 6: Share of Modes for Motorized Trips in Johannesburg 2001
Series1, Bus, Series1,
44002, 4% Motorbike, 1321,
Series1, Train,
0%
71979, 7%
Car
Minibus-taxi
Series1, Minibus- Train
taxi, 371737, 35% Series1, Car,
580988, 54% Bus
Motorbike
Source: Based on File 6 Table 3.29, p 53 (author has excluded NMT)
Grütter Consulting Page 22BRT Rea Vaya Phase 1A and 1B, South Africa
Figure 7 shows the share of public transit modes in total public transit. Clearly minibus-taxis are the
predominant mode of public transit in Johannesburg. Photo 6 gives an idea of this type of transport.
A clear trend towards minibus-taxis and away from rail and bus can be observed48.
Figure 7: Share of Public Modes for Trips in Johannesburg 2001
Series1, Bus,
44002, 9%
Series1,
Train,
71979, Minibus-taxi
15% Train
Series1, Minibus-
taxi, 371737, 76% Bus
Source: Based on File 6 Table 3.29, p 53 (author has included only public transit means)
Photo 6: Minibus-Taxi
Prior project the baseline bus and minibus-taxi system is composed of:
Around 5,000 large basically diesel powered buses with an average model year of 200149.
The main bus services are provided through services contracted and subsidized by the
48
File 6, table 3-31, p. 53
Grütter Consulting Page 23BRT Rea Vaya Phase 1A and 1B, South Africa
province (mainly from Soweto, Eldorado Park, Lenasia and the Deep South), and by the city-
owned bus company Metrobus. These services are provided by just over 960 buses. 300 to
500 small operators with 1,500 to 2,000 buses run mainly unscheduled, unsubsidized
services for private hires, learner transport and inter-city services50.
Around 40,000 basically gasoline powered minibus-taxis (includes inter-city minibus-taxis)
with a capacity of 16 persons and an average model year of 199751.
The average occupation rate of minibus-taxis is 42% while the occupation rate of buses is only 24%52
which is an indicator of rather low current efficiency of the system.
Map 5 shows the baseline routes of minibus-taxis, buses and suburban rail.
Map 5: Baseline Public Transit Network of Johannesburg (2008)
49
File 1; includes also inter-urban and non-public transit buses
50
File 25, p. 5
51
File 1, sheet “model year”
52
File 2, City of Joburg, 2009
Grütter Consulting Page 24BRT Rea Vaya Phase 1A and 1B, South Africa
1.10. Compliance with Laws, Statues and Other Regulatory Framework
The most important pieces of legislation that governs the transport sector in South Africa are the
following53:
Urban Transport Act, 1977 (Act 78 of 1977)
53
File 6, p 312
Grütter Consulting Page 25BRT Rea Vaya Phase 1A and 1B, South Africa
National Road Traffic Act, 1989 (Act 29 of 1989)
National Road Traffic Act, 1996 (Act 93 of 1996)
National Land Transport Interim Arrangements Act, 1998 (Act 45 of 1998)
National Land Transport Act, 2000 (Act 5 of 2009)
National Land Transport Strategic Framework, 2002-2007
National Environment Implementation Plan, First Edition (Notice 3410 of 2002; Government
Gazette No 24140 of 13 December 2002)
Transport legislation in the Gauteng Province includes the following:
Gauteng Public Passenger Road Transport Act, 2001 (Act 7 of 2001)
Gauteng Transport Infrastructure Act, 2001 (Act 8 of 2001)
Gauteng Transport Framework Revision Act, 2002 (Act 8 of 2002)
Gauteng Transport Framework Amendment Bill, 2001
Gauteng White Paper on Transport Policy
The key land use legislation from a national perspective is the following:
Development Facilitation Act, 1995 (Act 67 of 1995)
Local Government Municipal Systems Act, 2000 (Act 32 of 2000)
White Paper on Spatial Planning and Land Use Management, July 2001
Also important are54:
National legislation mandates the inclusion of accessibility issues in the provision and
planning of transport.
The Promotion of Equality and Prevention of Unfair Discrimination Act (2000) goes further by
outlawing discrimination on the grounds of disability. This principle echoes the objective for
transport articulated by the disability sector itself, as provided for in the White Paper on an
Integrated National Disability Strategy (1997): “To develop an accessible, affordable multi-
modal public transport system that will meet the needs of the largest numbers of people at
the lowest cost, while at the same time planning for those higher cost features which are
essential to disabled people with greater mobility needs.”
The project is part of the Integrated Transport Plan of the City of Johannesburg which has listed and
follows all these guidelines and regulations55.
The BRT Rea Vaya Phase 1A and 1B has also all environmental permits as required56.
1.11. Participation under Other GHG Programs
The project does not participate under any other GHG Program.
54
File 6, p. 288
55
File 25
56
File 26 composed of 26a to 26i
Grütter Consulting Page 26BRT Rea Vaya Phase 1A and 1B, South Africa
1.12. Other Forms of Environmental Credit
The project does not receive any other form of environmental credit.
1.13. Additional Information Relevant to the Project
Eligibility Criteria
The project is not a grouped project and therefore this part is not relevant to the project.
Leakage Management
Leakage is considered in the methodology used.
Commercially Sensitive Information
No commercially sensitive information has been used.
Further Information
No further information is included.
2. Application of Methodology
2.6. Title and Reference of Methodology
CDM Methodology
AM0031, Version 03.1.0, Baseline Methodology for Bus Rapid Transit Projects
2.7. Applicability of Methodology
The methodology is applicable to project activities that reduce emissions through the construction
and operation of a Bus Rapid Transit (BRT) system for urban road based transport. Table 2 relates the
specific baseline as well as monitoring applicability conditions of the methodology with the proposed
project.
Table 2: Applicability Conditions
Applicability condition Project situation
The project has a clear plan how to reduce existing The BRT Rea Vaya Phase 1A and 1B system
public transport capacities either through includes trunk, complementary and feeder lines
scrapping, permit restrictions, economic and replaces partially the current transport
instruments or other means and replacing them by system with a modern and efficient new system.
a BRT system. The project has eliminated baseline units through
withdrawal of public transport operating licenses
and scrapping or sale of the vehicles to which they
Grütter Consulting Page 27BRT Rea Vaya Phase 1A and 1B, South Africa
certain57.
Local regulations do not constrain the No regulations constraining the establishment of
establishment or expansion of a BRT system. BRTs exist. The BRT Rea Vaya Phase 1A and 1B
forms part of the public transport policy58.
Any fuels including (liquefied) gaseous fuels or bio- Baseline vehicles use gasoline and diesel and for
fuel blends, as well as electricity, can be used in the the rail system electricity. Project units use diesel
baseline or project case. only.
The project activity BRT system is road-based. The The BRT Rea Vaya Phase 1A and 1B system is road
baseline public transport system and other public based. The baseline public transit system is road
transport options are road- or rail-based (the and rail based (suburban rail). The suburban rail is
methodology excludes air and water based systems not affected by the BRT Rea Vaya Phase 1A and 1B
from analysis). However the methodology is not and continues operations and is not replaced by
applicable if the project activity BRT system the project.
replaces an urban rail-based Mass Rapid Transit
System (MRTS), i.e. if the MRTS stops operating
after project implementation due to the project
activity.
The BRT system partially or fully replaces a The BRT Rea Vaya Phase 1A and 1B replaces
traditional public transport system in a given city. partially the existing public transport system.
The methodology cannot be used for BRT systems Public transport is available in Johannesburg in
in areas where currently no public transport is areas of operation/influence of the BRT Rea Vaya
available. Phase 1A and 1B 59.
The methodology is applicable if the analysis of Section 2.4. of the PDD identifies the baseline as a
possible baseline scenario alternatives leads to the continuation of the current public transport
result that a continuation of the current public system.
transport system is the scenario that reasonably
represents the anthropogenic emissions by sources
of greenhouse gases (GHG) that would occur in the
absence of the proposed project activity (i.e. the
baseline scenario)
2.8. GHG Sources, Sinks and Reservoirs
The spatial project boundary is the metropolitan area of Johannesburg. It is based on the origins and
destinations of passengers using the project system and is based on the outreach of the project
system including BRT trunk, complementary and feeder routes.
The conceptual project boundary is given in Figure 8.
Figure 8: Conceptual Project Boundary
Emission sources not Emission sources included
Other emissions
included
57 included as leakage
File 18
58
File 27, p.7
Change of baseline
See File 15 slide 18 for the original design of affected, diverted and reduced routes forfactors monitored
59
entire Phase I
during project and
Grütter Consulting Page 28
included as leakage:
a). Change of load
factors of minibus-taxis
provoked indirectly byBRT Rea Vaya Phase 1A and 1B, South Africa
Direct project and baseline
Emissions caused by the
emissions
remaining transport
Emissions caused by passengers
system which continues
transported by the BRT project
to circulate in the
(trunk, complementary and feeder
project area (taxis, cars,
units)
conventional public
transport) Downstream emissions included as
leakage
Congestion change provoked by
Emissions caused by project resulting in (inter alia):
freight, ship, rail and air - Increased vehicle speed
transport - Rebound effect
Table 3: Emissions Sources Included in the Project Boundary
Source Gas Included? Justification /
Explanation
Baseline
Mobile source emissions of different modes of CO2 Yes Main source
transport passengers transported by the project CH4 Yes
would have used in absence of the project BRT N2O Yes
BRT bus emissions of trunk, complementary and CO2 Yes Main source
activity
Project
feeder route services CH4 Yes
N2O Yes
Change of occupation rates of baseline buses and CO2 Yes Main source
Leakage
minibus-taxis as well as congestion related leakage
CH4 Yes
N2O Yes
Trunk as well as complementary and feeder route locations, distances and routings might still change
as the current information is based on planning data and projections. Annex 1A and 1B includes the
list of all routes.
2.9. Baseline
Steps followed to identify the baseline are:
Step 1: Identify all alternatives
Step 2: Analyze options using the latest version of the CDM “Tool for the demonstration and
assessment of additionality”
Step 3: If step 2 results in more than one possible scenario, the baseline scenario is the one with the
lowest emissions.
Step 1: Identification of Options
Grütter Consulting Page 29BRT Rea Vaya Phase 1A and 1B, South Africa
Basically the city has the option to choose between transport alternatives that favour more the
usage of private cars and options that favour more public transport. The trend in mode share
towards private and away from public transit in Johannesburg shows clearly that private transport
means have been favoured in the past (see chapter 1.9). Concerning public transit following basic
options for Johannesburg exist:
1. Implementation of a rail-based mass transit system such as metro or Light Rail Transit (LRT);
2. Continuation of the current road-based transit system;
3. Public transit sector re-organization;
4. Implementing the project without carbon finance.
The alternatives of rail-based MRTS (Mass Rapid Transit Systems) have also been considered in the
scoping study for BRT realized by ITDP November 200660.
Step 2: Assessment of Options
ALTERNATIVE 1: RAIL- BASED MASS TRANSIT SYSTEM
Three types of rail-based mass rapid transit (MRT) systems are in general considered61:
Light Rail Transit (LRT) which also includes trams operating as single rail car or as short train
of cars typically on exclusive right-of-way lanes at surface levels. LRTs can also be elevated.
LRTs have carrying capacities comparable to BRTs with less than 30,000 phd (passenger per
hour per direction per line) and trams have capacities in the order of 15,000 phd.
Metros which can function underground, elevated or on surface level. The core difference to
LRTs is the larger capacity of passenger transport. Metros have capacities in the range of
50,000 to 80,000 phd per line62.
Sub-urban or inter-urban rail with some stations in the city. The main difference to LRTs is
that carriages are heavier, distances travelled are longer and transport is between cities or
between the city and its sub-urban areas.
The core difference between metro and BRT is the investment cost and the carrying capacity
passengers per hour per line. For the area of operation of the BRT no passenger transit demand as
required by metros is available. Table 4 shows differences between BRTs/Bus Lane systems, LRTs and
metros and table 5 gives examples of the carrying capacity of various MRTS worldwide.
Table 4: Comparison BRTs, LRTs and Metros
Characteristic BRT / Bus lane LRT / Tram /Monorail Metro
Passenger carrying 15-35,000 10-25,000 50-80,000
63
capacity (phd)
Average operating 15-25 15-25 30-40
speed (km/h)
Space requirement 2-4 lanes taken away 2-4 lanes taken away Separate from
from existing road space from existing road space roadway corridors
60
File 12
61
Adapted from File 28: GTZ training course “Mass Transit”, 2004, box 2, page 13
62
See Table 5
63
See examples following table
Grütter Consulting Page 30BRT Rea Vaya Phase 1A and 1B, South Africa
Source: IEA, Bus Systems for the Future, 2002, Table 2.1.
Table 5: Passenger Carrying Capacity of Metros/LRTs vs. Planned BRT Lines Johannesburg (phd per
line64)
System/City phd (passenger per hour per direction) capacity
65
Metro Mumbai 1 81,000
Metro Sao Paulo 60,000
Metro Bangkok 50,000
LRT Kuala Lumpur 30,000
LRT Tunis 12,000
BRT Bogota 33,000
BRT Quito 15,000
BRT Curitiba 15,000
BRT Rea Vaya Phase 1A 8,000
BRT Rea Vaya Phase 1B 13,000
Source: GTZ/ITDP sustainable transport sourcebook 3A, Mass Transit Options, 2005, Table 10 (File
29); for LRT Tunis table 1, p.5; BRT Rea Vaya File 7 sheet ”DATE_KM_ PHD”
The expected ridership of the BRT Rea Vaya lines is around 8,000-13,000 phd or far less than the phd
of metros or LRTs. Based on the expected passenger demand metro or LRT is thus not a viable
alternative for Johannesburg as the very high investment for rail systems will not be viable with the
expected passenger numbers. The required investment of LRT, metro and BRT options have a
significant difference66:
LRT at level with costs between 13-38 million USD per kilometre;
Elevated LRT or monorail with costs between 50-102 million USD per kilometre;
Metro with costs between 41-350 million USD per kilometre;
BRT Rea Vaya as originally estimated around 3 million USD per kilometre67.
Metros and LRTs are clearly far more expensive than BRTs. As the passenger demand in
Johannesburg is sufficient to be covered through a BRT (see former table) it makes no sense to invest
significant additional resources in a metro or LRT. This was also confirmed by the scoping study for
the BTR Rea Vaya realized by ITDP68. It is also reflected in the public transport action plan formulated
by the Department of Transport which focuses on BRT69.
Summarized a metro or LRT is due to the expected passenger demand and the high investment cost
of LRTs/metros not a feasible option for Johannesburg.
ALTERNATIVE 2: CONTINUATION OF THE CURRENT SYSTEM
64
The carrying capacity of each line is independent of other lines and thus carrying capacities of lines cannot be
summed. The logic of a carrying capacity is to see which system along a certain stretch is required i.e. “x”
passengers demand transit services between A and B. The question is thereafter which transport system i.e.
metro, LRT, BRT, simple bus service etc matches best the passenger flow demand along that corridor.
65
See PDD published on UNFCCC website
66
See L. Wright, GTZ, Training Course: Mass Transit, 2004, page 16, table 6 (File 28) for LRT, and metros.
67
File 12, p. 90 (21.6 million Rand at 11.2006 exchange rate of 0.133 USD /Rand)
68
File 12, p.13
69
File 27
Grütter Consulting Page 31BRT Rea Vaya Phase 1A and 1B, South Africa
A continuation of the current transport system complies with all applicable legal and regulatory
requirements. A continuation of the current system has various advantages compared to all other
options:
No large-scale public investment requiring additional subsidies;
Lowest risk of all options.
The continuation of the current situation is thus clearly a realistic and attractive alternative. The
carrying capacity of the current public transport system is in line with the actual transport demand.
The current occupation rate of only 24% of buses and 42% of minibus-taxis70 is a clear reference that
the current system can fulfil the passenger demand. Increasing passenger demand can be
accommodated through improved occupation rates or by establishing new routes using also
alternate roads. Also bus operators can add new routes and new units as the current system is
profitable for them. This is what has occurred in the last few decades in the city i.e. growing
passenger demand has been accommodated without major problems especially by increasing
minibus-taxi service. The existing transport system relies not on single or fixed routes like a BRT but
on a multitude of possible routes and modes of transport using the existing road infrastructure and
modes of transit. It is thus highly flexible and can accommodate passenger flows in excess of any
single-route based BRT.
ALTERNATIVE 3: PUBLIC TRANSIT RE-ORGANIZATION
This scenario implies a completely integrated, centrally managed and re-structured transport system
which is a comprehensive and complete change of the current public transport system. No new
infrastructure or hard-ware is required in this case. Currently the transport system has numerous
companies especially in the minibus-taxi sector with many individual bus owners competing between
each other for passengers. The proposed re-organization would include a centrally managed control
of all units, dispatching them upon demand, a management and integration of tariffs, a re-definition
of routes and significant structural changes from current operations relying on independent small
bus-owners to transit operators embedded in a centrally controlled operation centre of fleet.
The barrier to implementing such a system is clearly of organizational and management nature with
the considerable risk of non-functioning and the resistance to change of the existing transport sector.
To manage such a change the entity in charge of transport management needs to be very strong and
the involved parties i.e. the existing transport companies, need to agree upon the change. The
political difficulties with the existing minibus-taxi sector which dominates public transit is also clearly
outlined in the scoping study performed by ITDP71. Also simple organizational measures, while
politically difficult to implement, will not resolve major problems of the public transit sector as
identified in the Public Transport Action Plan page 5ff72, and are thus not a more attractive
alternative than to simply continue with the system as currently operating.
ALTERNATIVE 4: THE PROJECT WITHOUT CDM
70
File 2
71
File 12, p. 100
72
File 27
Grütter Consulting Page 32BRT Rea Vaya Phase 1A and 1B, South Africa Alternative 4 is detailed in Chapter 2.5 which makes an assessment of this option and shows why the project without CDM is not feasible. Step 3: If Step 2 results in more than one possible alternative baseline scenario, the most likely baseline scenario is the scenario with the lowest baseline emissions Step 2 only results in one possible baseline alternative i.e. a continuation of the current public transit system. 2.10. Demonstration and Assessment of Additionality The additionality of the project is determined using the CDM “Tool for the demonstration and assessment of additionality (version 05.2, EB 39 Annex 10)”. Step 1. Identification of alternatives to the project activity consistent with current laws and regulations Sub-step 1a. Define alternatives to the project activity Chapter 2.4 step 1 identified the four available options. Step 2 of the same chapter assessed the feasibility of the 4 options and excluded option 1 and option 3. The remaining options are thus the project in absence of carbon finance or a continuation of the current transit system. Sub-step 1b. Consistency with mandatory laws and regulations: All alternatives identified are consistent with mandatory laws and regulations. No special law or requirements exist for BRTs. The most relevant laws have been listed in chapter 1.10. Grütter Consulting Page 33
BRT Rea Vaya Phase 1A and 1B, South Africa
Step 2. Investment analysis
The project proposal is public financed concerning infrastructure. The infrastructure is fully public
financed. The user is currently paying only 40% of the bus operating costs. Financing of the capital
costs as well as operational subsidies has been to date through73:
National government has financed through the Public Transport Infrastructure and Systems
Grant R 2,627 million towards capital investment and R 180 million towards operational
expenditures (transitional and transformation costs).
The City of Johannesburg has contributed R 277 million towards capital expenditure and R 59
million towards operational expenditure.
External donors have funded R 37 million towards expenditures being basically marketing
and communication, legal fees, taxi industry support and project management.
The system is thus not repaid by the system users through tariffs charged. In accordance with the
methodology as the project is at least partially public financed concerning investment no investment
analysis is made and the barrier analysis is applied. As no investment analysis is applied no cost-
benefit analysis is applied.
Step 3. Barrier analysis
Sub-step 3a. Identify barriers that would prevent the implementation of the proposed CDM project
activity
Three important barriers exist for the implementation of the BRT Rea Vaya:
Resistance of minibus-taxi operators;
Risk of operational deficits of the system;
Prevailing practice barrier.
RESISTANCE OF MINIBUS-TAXI OPERATORS
The resistance of current operators was identified from the very start as a risk for the BRT system
(see scoping study, 2006, p. 100)74.
The policy approach in Rea Vaya is to offer the affected public transport operators 100%
shareholding in the Bus Operating Company that runs the new services. In the case of Phase 1A the
routes run by members of ten minibus-taxi associations were affected. All were invited to negotiate
withdrawal of competing services and the formation of a bus operating company that would be given
the bus operating contract. The leaders of the two umbrella taxi associations, Greater Johannesburg
Regional Taxi Council and Top Six Taxi Management, participated in the process, along with several
hundred taxi owners from nine of the ten associations. However, many owners and leaders and taxi
association executive committees decided to oppose it. The latter formed an organisation in
December 2008 to oppose Rea Vaya BRT called United Taxi Association Forum (UTAF). The door to
their participation was kept open throughout negotiations, but they remained opposed. They
73
File 30
74
File 12
Grütter Consulting Page 34BRT Rea Vaya Phase 1A and 1B, South Africa
organised various major “strikes” by the majority of taxi owners and drivers in Johannesburg, and as
taxis provide 72% of public transport, these strikes caused widespread disruption in the City. Strikes
took place on:
March 24th 2009 (during this stayaway, thousands of taxi owners marched on the
Johannesburg City centre, and presented a petition opposing BRT to the secretary-general of
the ruling party, the African National Congress).
September 1st 2009 (the second day of Rea Vaya starter service operations).
March 12th 2010 and March 15-17 2010 (when Rea Vaya feeder services were launched).
On April 20th 2009, two days before national elections were held, the national taxi umbrella body
called SANTACO invited the then ANC president Jacob Zuma to a national meeting where he agreed
that ‘we should hold our horses’ on BRT until such time as a new administration comes into place.
They had threatened to strike against the BRT and disrupt the elections otherwise.
This caused a hold to be placed on various Rea Vaya preparations for the planned launch in May
2009. In May 2009 the national Minister of Transport advised the Executive Mayor of Johannesburg
that Rea Vaya should not start operations during the FIFA Confederations Cup in June 2009 as
planned, because it was too risky from a security point of view.
Repeated invitations to the opposing taxi associations to participate in Rea Vaya negotiations were
rejected, and negotiations were eventually held in the year-long period between August 5th 2009 and
September 28th 2010 and successfully concluded with the representatives of several hundred
affected minibus-taxi owners who did want to participate.
UTAF also brought an urgent application on August 28th 2009 for a High Court interdict to stop Rea
Vaya from launching on August 30th 2009. This was successfully opposed by the City of Johannesburg.
There have been several violent incidents against Rea Vaya BRT. These have been clustered around
the launch, the first service expansion in March 2010, and the second service expansion in May 2010.
The incidents are listed below. These have been potential barriers in the sense that they could have
deterred further rollout of the services, which have been introduced in phases. They have also tried
to deter affected taxi operators from continuing to take part in the negotiations around the
formation of the bus operating company. They have also had the potential effect of damaging the
image of Rea Vaya in the eyes of passengers.
The main incidents are listed below.
On 2 September 2009, the third day of Phase 1A starter service operations, two Rea Vaya
buses came under fire in Soweto and two people were shot and injured.
Taxi industry participants in the negotiations have been regularly intimidated. Those from
two of the most heavily impacted associations have been subjected to victimisation and
harassment in the form of disciplinary action, and many have been unable to operate their
taxis.
One pro-BRT member of the heavily-affected association WATA was shot dead in December
2009. His fiancé and his brother were also shot and killed in November and December 2009
respectively, and it was possible that these hits were related to his support for the Rea Vaya
BRT.
Grütter Consulting Page 35You can also read