BSE Limited Investor Presentation - November 2018

Page created by Renee Bowman
 
CONTINUE READING
BSE Limited Investor Presentation - November 2018
BSE Limited

1
    Investor Presentation – November 2018
BSE Limited Investor Presentation - November 2018
Disclaimer

This presentation and the discussion may contain certain words or phrases that are forward - looking statements,
which are tentative, based on current expectations of the management of BSE Limited or any of its subsidiaries and
associate companies (“BSE”).Actual results may vary significantly from the forward-looking statements contained in
this presentations due to various risks and uncertainties. These risks and uncertainties include the effect of economic
and political conditions in India and outside India, volatility in interest rates and in the securities market, new
regulations and Government policies that may impact the businesses of BSE as well as the ability to implement its
strategy.

The information contained herein is as of the date referenced and BSE does not undertake any obligation to update
these statements. BSE has obtained all market data and other information from sources believed to be reliable or are
its internal estimates, although its accuracy or completeness cannot be guaranteed. Competition numbers are based
on published results and management analysis. For purpose of comparison, following stock exchanges are considered
– National Stock Exchange of India Limited, Metropolitan Stock Exchange of India Limited. The presentation relating to
financial performance herein is reclassified/regrouped based on Management estimates and may not directly
correspond to published data. The numbers have also been rounded off in the interest of easier understanding. Prior
period figures have been regrouped/reclassified wherever necessary. All information in this presentation has been
prepared solely by the company and has not been independently verified by anyone else.

This presentation is for information purposes only and does not constitute an offer or recommendation to buy or sell
any securities of BSE. Any action taken by you on the basis of the information contained herein is your responsibility
alone and BSE or its directors or employees will not be liable in any manner for the consequences of such action taken
by you.

The distribution of this document in certain jurisdictions may be restricted by law and persons into whose possession
this presentation comes should inform themselves about, and observe, any such restrictions.

                                                            2
BSE Limited Investor Presentation - November 2018
Index

 1      Overview
               1

 2      Business

 3      State-of-the-art Infrastructure and Technology

 4      Recent Initiatives & Growth Drivers

 5      Performance Highlights

                                              3
BSE Limited Investor Presentation - November 2018
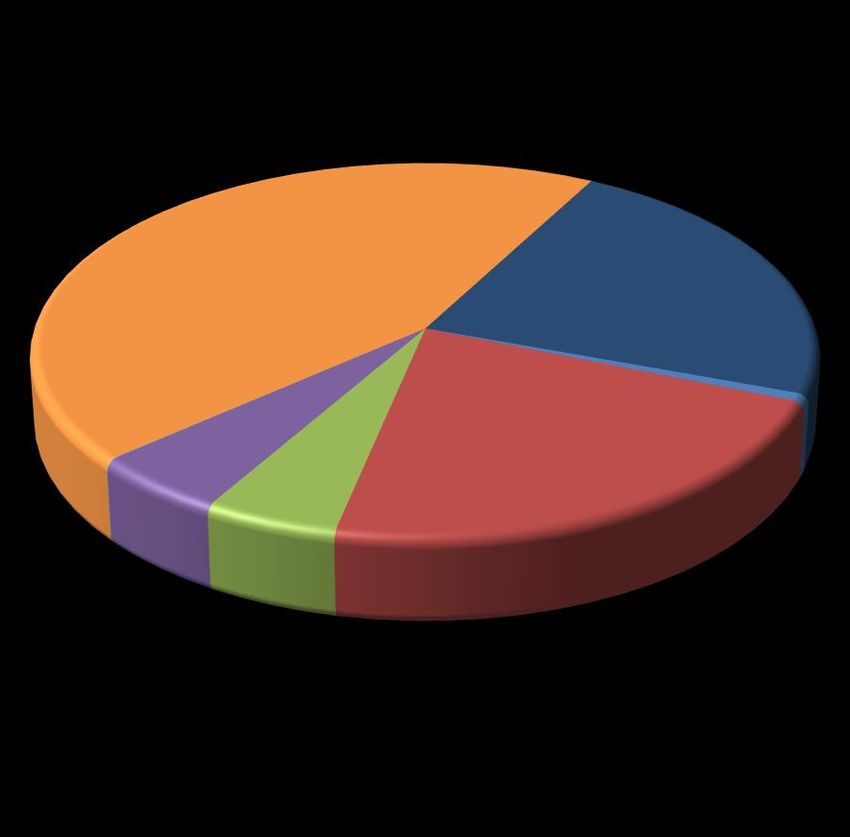
Evolution Of The Exchange - Key Milestones

        1875 To 1995             1996 To 2005          2006 To 2010            2011 To 2014           2015 To 2016             2017 To 2018

•The Native Share &       •Equity Derivatives   •Currency Derivatives •Launch of Currency    •BSE celebrated its       •Hon’ble Prime
 Stock Broker's            introduced            Introduced            Derivatives (BSE CDX) 140th Foundation           Minister of India, Shri
 Association formed                                                                           Day                       Narendra Modi
                          •Index Options        •First to introduce   •Launch of Interest                               inaugurated India
•BSE granted               launched              Mobile-based Trading Rate Futures (BSE –    •BSE becomes the           International
 permanent                                                             IRF)                   fastest exchange in       Exchange (IFSC) Ltd,
 recognition under                                                                            the world with a          India’s 1st
                          •BSE becomes a                                                                                International
 Securities Contracts      Corporate Entity                           •Launch of              median response
 (Regulation) Act                                                                             speed of 6                Exchange
                                                                       Institutional Trading
 (SCRA)                                                                Platform on BSE SME    microseconds
                                                                                                                       •BSE becomes India's
•S&P BSE SENSEX ,                                                                              •BSE announces           1st listed Stock
                                                                        •BSE Launches New                               Exchange
 country's first equity                                                  Debt Segment           commencement of
 index launched                                                                                 trading of Sovereign
                                                                                                Gold Bonds             •BSE completes
                                                                        •Launch of Equity                               Buyback of its Equity
•BSE On-Line Trading                                                     Segment on BOLT
 (BOLT) system                                                                                 •Shri Arun Jaitley,      Shares, reducing
                                                                         Plus with Median                               issued equity share
 introduced                                                              Response Time of 200 Hon'ble Minister of
                                                                                                Finance Unveiled the    capital by 3.70%.
                                                                         (µs)
                                                                                                Commemorative
                                                                                                Postage Stamp          •BSE launches its
                                                                        •BSE listed cos market Celebrating 140          commodity
                                                                         cap crosses landmark glorious years of BSE     derivatives segment
                                                                         100 lakh crore                                 making it India's 1st
                                                                                                                        Universal Exchange

                                                                           4
BSE Limited Investor Presentation - November 2018
BSE Group

                                                                                           BSE GROUP                                     BSE LTD.
                                                                                                                                         • NSE Symbol: BSE
                                                                                                                                         • BloombergSymbol : BSE IN
                                                                                                                                         • ReutersSymbol: BSEL.NS

                                    DOMESTIC                                                                                     IFSC-GIFT CITY

                                                                                                                                                   Central Counter Party
        Exchange                 Central Counter Party            Central Securities                                Exchange                               (CCP )
                                         (CCP)                    Depository (CSD)

                                                                                                                     100%                                 100%
            100%                       100%                               24%
                                                                                                              India International                          India
  BSE Investments Ltd.            Indian Clearing                Central Depositary                           Exchange(IFSC)Ltd.                   InternationalClearing
                                  Corporation Ltd                   Services Ltd                                                                     Corporation (IFSC)
✓ Pranurja Solutions                                                                                                                                      Limited
  Limited                                                   ✓ CDSL Ventures Ltd.                                      100%
✓ BSE EBIX Insurance                                        ✓ CDSL Insurance Repository Ltd.
  Broking Private Limited –                                 ✓ CDSL Commodity Repository Ltd               India INX Global Access
  40%                                                                                                           IFSC Limited

                                                                            SERVICES

               100%                       100%                        50%                            51.22%                      100%                          100%

      Marketplace                  BSE Institute Ltd.         Asia Index Pvt Ltd.              BFSI Sector Skill            BSE CSR Integrated          BSE Sammaan CSR
  Technologies Pvt Ltd.                                                                        Council of India                Foundation                    Limited
                                ✓ BIL- Ryerson Technology
                                                                                                 [Section 8                     [Section 8
✓ Market place Tech Infra         Startup Incubator
  Services Pvt. Ltd.- 100%        Foundation [Section 8                                          company]                       Company]
✓ Marketplace EBIX                company] - 51%                                             ✓ BSE-48.78%               ✓ BSE - 75%
  Technology Services Private                                                                ✓ BSE Institute Ltd.       ✓ BSE Subsidiaries - 25%
  Limited – 40%                                                                                (BIL)– 2.44%
                                                                                       5                                                                       As on Sep 30, 2018
BSE Limited Investor Presentation - November 2018
Shareholding Pattern

                                                                                 SOME KEY SHAREHOLDERS
                       SHAREHOLDING PATTERN                           Deutsche Boerse AG                           4.92%

                                                                      Life Insurance Corporation of India          4.88%

                                                                      Siddharth Balachandran                       3.42%

                                                                      IDFC Group                                   2.86%
       Others
        44%                                                           State Bank of India                          2.42%
                                                     Trading Member
                                                           23%        GKFF Ventures                                2.37%

                                                                      Caldwell India Holding Inc.                  2.27%

                                                                      Jupiter India Fund                           2.09%

                                                            Banks     Acacia Banyan Partners Limited               1.95%
                                                             1%
                                                                      ICICI Prudential Mutual Fund                 1.81%
   Mutual Funds
       5%                                 FDI / FII / FPI             MSPL Limited                                 1.16%
                   Financial
                                               22%
                  Institution                                         Chanakya Investor Group                      1.04%
                      5%
                                                                      S Gopalakrishnan                             1.03%

                                                                      Aditya Birla Group                           0.99%

                                                                      Wellington Investor Group                    0.37%

  Paid up Capital ₹103.6 million|Face Value per share ₹ 2/- each                                        As at Sept 30, 2018
                                                            6
Experienced Board of Directors

                                 On BSE                                                                     On BSE Board
       Name                                                  Bio                       Name                                                   Bio
                               Board since                                                                      since

                                                Promoter and Managing
        S Ravi                                                                            Vikramajit                          Previously, acting Chief Justice –
                                                 Partner of Ravi Rajan & Co.,
        Chairman and Public      2016                                                     Sen                                  High Court of Karnataka and later
                                                 Chartered Accountants                                         2016
        Interest Director                                                                 Public Interest                      appointed as Judge, Supreme Court
                                                Former Director of UCO Bank
                                                                                          Director                             of India

                                                Previously, Group Chief
        Ashishkumar                              Information Officer, Reliance                                                Founder, Rajeshree Sabnavis
        Manilal Chauhan                          Industries Limited                       Rajeshree                            & Associates
                                 2012                                                     Rajnikant
        Managing Director                       Chairperson of the Board of                                                  Invitee Member on the Managing
                                                                                          Sabnavis             2015            Committee of the Bombay
        and CEO                                  Governors of National Institute
                                                 of Technology, Manipur                   Shareholder                          Chamber of Commerce and Co-
                                                                                          Director                             Chairperson of Direct Taxation
                                                Previously, Member of the                                                     Committee
                                                 Expenditure Management
        Sumit Bose                               Commission
                                 2016                                                     Sriprakash                          Deputy Dean and Gordon Y Billard
        Public Interest                         Former Union Finance
                                                 Secretary and Revenue                    Kothari                              Professor of Accounting and
        Director                                                                                               2014
                                                 Secretary in the Ministry of             Shareholder                          Finance at Massachusetts Institute
                                                 Finance, Government of India             Director                             of Technology

        Subhash S. Mundra                       Former Deputy Governor,
        Public Interest          2018            Reserve Bank of India
                                                                                                                              Former General Secretary of IOSCO
        Director                                Former Chairman & Managing
                                                                                                                               (2012-2016), former Deputy
                                                 Director ofBank of Baroda
                                                                                          David                                Director-General for Securities and
                                                                                                                               Financial Markets at the EU
                                                                                          Wright
                                                                                                               2018            Commission.
        Usha Sangwan                                                                      Public Interest                     From March 2000 – October 2010
                                 2015           Former Managing Director, Life           Director
        Shareholder Director                                                                                                   he was first Director, then Deputy
                                                 Insurance Corporation of India
                                                                                                                               Director-General for securities and
                                                                                                                               financial markets.

                                                                                   7
Experienced Management Team
Name                Since                        Bio                        Name                Since                               Bio

                                                                                                           Prior to joining BSE, Credit Analysis & Research Ltd. as
                               B Tech in Mechanical Engineering from                                       Joint General Manager (Accounts),CFO at Multi
                                IIT Bombay and a PGDM from IIM                                              Commodity Exchange of India Limited and has also
                                Kolkata                                                                     worked at the National Stock Exchange.
                               He is one of the founders of India's        Nayan Mehta         2012       Heads Finance & Accounts, Treasury and Taxation
                                National Stock Exchange (“NSE”) where                                       Functions at BSE
                                                                            Chief Financial
                                he worked from 1992 to 2000. He is best     Officer                        He represents BSE on the Boards of group companies
                                known as the father of modern financial                                     and joint ventures of BSE and as a member of the
Ashishkumar
                    2009                                                                                    Qualified Audit Review Committee of SEBI.
Manilal Chauhan                 derivatives in India due to his work at
                                NSE                                                                        Prior to BSE he was an Executive Director in Morgan
Managing Director
                               Represents BSE as the Chairman on the                                       Stanley India for 10 years. He was earlier with
and CEO
                                                                                                            National Stock Exchange and has managed various
                                Executive Board of the South Asian
                                                                                                            functions like Trading Operations, Inspection and
                                Federation of Exchanges.
                                                                                                            Investigation, Futures and Options Clearing and
                               Previously, Group Chief information                             2015        Trading. He was also the CEO of India Index Services
                                                                            Neeraj
                                officer, Reliance Industries Limited                                        Ltd. and Dotex International Ltd
                                                                            Kulshrestha
                                                                                                           HeadsTrading, Listing , Membership Operations and
                                                                            Chief of Business               listing sales.
                                                                            Operations
                               Prior to joining BSE, worked with various                                  27 year experience in Capital markets, which includes
                                departments in SEBI                                                         Securities Markets and General Insurance.

                               More than 19 years of experience in the                                    Prior to joining BSE, employed with Log-in Utility and
                                                                                                            InvestSmart Financial Services Limited
                                area of legal and compliance. He has
                    2009        previously worked at the Securities and                                    30 years of experience in the area of Application
Nehal Vora                                                                                                  Systems/ IT Infrastructure development and
                                Exchange Board of India (SEBI) for 10
Chief Regulatory                                                                                2010        management, managing all aspects of IT operations in
                                yearsand asDirector, Law & Compliance
Officer                                                                                                     Financial Services, Capital markets and manufacturing
                                at DSP Merrill Lynch Ltd heading Broking    Kersi Tavadia
                                                                                                            companies. He has played a leading role in
                                and Investment Banking Compliance           Chief Information               transforming BSE into the fastest exchange in the
                                                                            Officer                         country
                                                                               8
Index

 1      Overview
               1

 2      Business

 3      State-of-the-art Infrastructure and Technology

 4      Recent Initiatives & Growth Drivers

 5      Performance Highlights

                                              9
Diversified Lines of Business

                                                                          Revenue Business

  Listing Business                                                            Market Business                                                               Data Business

   Primary Market                                       BSE Star Mutual                                                                                       Information
                        Secondary Market                                      New Debt Segment             Membership                    Post Trade
                                                        Funds platform                                                                                          Products

                     • Equity Cash
  • IPO                                                                       ▪ OTC Corporate          ▪   Trading                    ▪ Clearing and
                     • Small & Medium                   ▪ Order                 Bond Reporting             Members                      Settlement
  • EQUITY             Enterprises                         placement            CP/CD                                                   Services            ▪ Market Data
                     • Commodity Markets                   platform                                    ▪   Clearing
                                                                              ▪ Trade                                                   through ICCL        ▪ Corporate Data
  • SME                                                                         Repository
                                                                                                           Members
                     • Offer to Buy                                                                                                   ▪ Depository          ▪ Corporate
  • BOND                                                                                               ▪   Self-clearing                Services              Action through
                     • Offer for Sale
                                                                                                           Members                      through CDSL          SWIFT
  • FPO              • Close Ended Mutual
                                                                                                                                                            ▪ End of Day
                       Funds
  • BSE Hi-Tech                                                                                                                                               Products
                     • Corporate Bonds
  • Sovereign                                                                                                                                               ▪ Historical Data
                     • Government Securities
    Gold Bonds                                                                                                                                              ▪ Macroeconomic
                       and Sovereign Gold
                                                                                                                                                              Indices
  • Mutual Fund-       Bonds
    NFO              • Equity Derivatives
                     • Currency Derivatives
                     • Interest Rate Futures
                                                                                                   Supporting Business
                     • Securities lending &
                       borrowing (through ICCL)
                     • ETF

                                                  Technology                                                                                               Corporate Social
                                                                               Index Products                              Training
                                                                                                                                                            Responsibility
                                                                          ▪   S&P BSE SENSEX                     ▪     Training
                                            ▪ IT services & solutions
                                                                          ▪   Sectorial Indices                  ▪     Certification                   ▪   BSE Sammaan CSR
                                                                          ▪   Sustainability Indices             ▪     Skill Development
                                                                          ▪   Thematic Indices                   ▪     Technology
                                                                          ▪   Fixed Income Indices                     Incubator&
                                                                                     10                                Accelerator Program
Global Ranking

                                     Highest globally with
                      Listed
                    Companies 5,071*
                                     Number of listed entities

                                            Largest globally with
                             Currency
                             Options        435 million*
                                            Number of Contracts Traded

                                              Third largest globally with
                                Currency
                                 Futures      340 million*
                                              Number of Contracts Traded

                             Electronic     11th largest globally with
                                Book        236 million*
                               Trades

                       Market        10th highest globally with
                    Capitalization
                                     $ 2 trillion#
                                                                           *Data as on Sep 2018
                                                                           # Data for Sep 2018
Source : WFE, BSE                      11
Membership

                       Equity Cash                                                 Currency Derivatives
                        Members                                                         Members

                      1364                                                                      527        535        540
                                                                                     516
            1361                                                          485
                                                                410
  1353                          1354
                                                   1351

                                          1344

 FY14-15   FY15-16   FY16-17   FY17-18   Q1FY19   Q2FY19   FY14-15      FY15-16    FY16-17    FY17-18     Q1FY19     Q2FY19

 Continuous interaction with members in normal course of business and through various programs

 Investor Education Programs                                          Promote Algorithmic Traders
   Jointly established a series of investor education                 BSE bears software license costs for algorithmic
  programs with members and broker associations to                    trading and market access, infrastructure costs on
    have open communication with members and                             co-location rack space, among other costs
           increase exposure to investors

                                                           12
Business – Marketshare

                     Red Ocean Businesses                                                              Blue Ocean Businesses

    Established leader in Listing related
                                                                                       Market leadership in Blue Ocean Businesses
    Business. Gaining share in Currency Derivatives

   75%
                                                                                                                           86%
                                                                                         79%
                    47%                                                                                  60%                         62%        66%
                                    36%              37%
                                                                       9%

Companies/       Currency Interest Rate Debt/ Fixed              Equity Cash           StAR MF@          SME#       Commodities^   BSE Bond   India INX
 Securities     Derivatives Derivatives   Income
  Listed$

                                                                Insurance
             New                                                                                                             Power
                                                              Distribution JV
           Businesses                                                                                                      Exchange*
                                                                with EBIX*

 @ Marketshare in Mutual Fund StAR Platform represents the value of purchase / redemption orders executed during Q2 FY19
 # Marketshare in SME Segment represents number of companies listed in SME segment during Q2 FY19.
 $ As on September 30, 2018.
 All Marketshare for Q2 FY19
 *Subject to Regulatory Approvals
 ^represents share in the exchanges commencing commodity trading since Oct-18
                                                                                  13
Business - Equity Markets

        Average Daily Turnover - Equity (₹ million)                           Transaction Charges Income - Equity (₹ million)
                                                                                                                      1,442
      CAGR 21%                           44,023
                                40,252                                                                     1,174
            35,179
                                                   32,993   32,055                 CAGR 50% 
                      29,963

  20,783
                                                                                                  531
                                                                                       485

                                                                            286
                                                                                                                                226       218

  FY13-14   FY14-15   FY15-16   FY16-17   FY17-18 Q1 FY19 Q2 FY19         FY13-14    FY14-15    FY15-16   FY16-17   FY17-18   Q1 FY19   Q2 FY19

                                                                            Revision in transaction charges of equity segment w.e.f August
  ▪   Significant increase in Transaction Charges                           01, 2018
      Income in FY16-17 mainly due to differential                          Monthly Turnover in Rs. Crs             Rate (in Rs.) per Crore on
      charging of transaction charges on select                                in calendar month                     incremental turnover.
      exclusive group of securities with effect from
                                                                                       Upto 750                                300
      1st January, 2016 at the rate of 0.1% on value
      traded.                                                                     Above 750 upto 1500                          290

                                                                                  Above 1500 Upto 2500                         280
                                                                                  Above 2500 upto 5000                         270
  ▪   Average number of trades per day is 1.37
                                                                                  Above 5000 upto 7500                         260
      million during Q2 FY19.
                                                                                      Above 7500                               250
                                                                     14
Business – Currency Derivatives

                           Average Daily Turnover - Currency Derivatives (₹ million)
      30,162      80,191            1,14,212                   1,31,060               1,82,891       3,14,177   3,38,878

                           CAGR 21% 
                                                                                                                1,92,285
                                                                                                     1,84,586

                                                                                          1,00,932
       4,012                         37,751                     56,356
                  25,272                                                                             1,29,592   1,46,593
       26,150                        76,461                                                81,959
                  54,919                                        74,704

     FY13-14     FY14-15            FY15-16                    FY16-17                    FY17-18    Q1FY19     Q2 FY19
                                            Currency Futures           Currency Options

                          Average Daily Number of Contracts - Currency Derivatives
     0.48        1.30                1.74                       1.95                       2.85        4.68       4.85

                                                                                                       2.75        2.77

                                                                                           1.58
                                     0.58                       0.84
                 0.41                                                                                  1.92        2.08
     0.06                            1.16                       1.11                       1.27
                 0.89
     0.42
    FY13-14     FY14-15             FY15-16                    FY16-17                    FY17-18    Q1 FY19     Q2 FY19

                                            Currency Futures           Currency Options
                                                                  15
Business – Currency Derivatives

                                      Open Interest (End of Year) - Currency Derivatives
     41,532           6,64,668             12,87,841               15,98,346               8,97,944        12,87,083   11,68,931

                                                                   5,30,152
                                           3,87,638                                                        2,80,721
                                                                                                                       3,83,186
                                                                                           2,30,258
                      1,90,275                                     10,68,194                               10,06,362
                                           9,00,203                                                                    7,85,745
      5,974                                                                                6,67,686
                      4,74,393
     35,558
     FY13-14          FY14-15              FY15-16                 FY16-17                 FY17-18         Q1 FY19     Q2 FY19
                                                Currency Futures        Currency Options           Total

                                 Transaction Charges Income - Currency Derivatives (₹ million)
                                                                                              82

                                  CAGR 280% 
                                                                      45

                                                16                                                            19          20
        -                 2

     FY13-14          FY14-15              FY15-16                 FY16-17                 FY17-18         Q1 FY19     Q2 FY19

Transaction charges in Currency derivatives for Q1 FY18 was ₹ 2.2 and ₹ 200 per million of turnover for Currency future and
currency options respectively.
The same was revised, in FY19, to Incremental turnover basis and ₹ 10 per million for currency future and currency option
respectively.
                                                                           16
Business – Interest Rate Futures

         Average Daily Turnover - Interest Rate Futures                              Average Daily Number of Contracts - Interest
                          (₹ million)                                                               Rate Futures
                                            9,251                                                                          46,881

                                                                                         CAGR 97% 
          CAGR 96% 
                                  5,288                                                                          25,559                        25,958
                        4,716                                   4,856                                 23,503
                                                      3,788                                                                          20,280

              1,761                                                                        8,543
   629                                                                           3,135

 FY13-14     FY14-15   FY15-16   FY16-17   FY17-18   Q1 FY19   Q2 FY19         FY13-14    FY14-15    FY15-16    FY16-17   FY17-18   Q1 FY19   Q2 FY19

           Open Interest Contracts (End of Period) -                                           Transaction Charges Income
                    Interest Rate Futures                                                    Interest Rate Futures (₹ million)
             80,078                                                                                                        4.48

                                                                                                   CAGR 351% 

                                                                                                                 1.43
                                 18,044
 9,829                                                                                                                               0.50      0.60
                        5,566                         8,237                                           0.22
                                             336                1941             -          -

FY13-14     FY14-15    FY15-16   FY16-17   FY17-18   Q1 FY19   Q2 FY19        FY13-14    FY14-15    FY15-16    FY16-17    FY17-18   Q1 FY19   Q2 FY19

                                                                         17
Business - Mutual Fund Distribution Platform-StAR MF

                PLATFORM FEATURES                                                            CONNECTIVITY & USPs
• Completely digital- Demat and Non-Demat /Mutual                            • Unique overnight investments framework
  Fund transactions, while facilitating the benefits of Physical             • Multi-mode of platform access
  mode
                                                                             • Completely digital and REAL Time Investors registration /
• 24x7 order acceptance                                                        onboarding
• SGB enabled for MFDs                                                       • Widely accepted by NDs / Custodians / Brokers / IFA
• 6 day order holding facility                                                 Platform/ New age Digital Distributors / IFAs,
• Paperless SIP                                                              • E-submission and online MFD Registration
• Any day STP and SWP
• Paperless bank Mandate

                                            BSE StAR MF created SIP STORM in Indian Mutual Funds Industry
                    11,111 SIPs registered on StAR MF Platform in a single day on October 10, 2018 by Swastika Investments Limited

 Number of Mutual Funds                              Number of Mutual Fund                            Number of Registered
 as on September 30, 2018                            Schemes available for                            Mutual Fund Distributors
                                                     trade as on September                            as on October 31, 2018
                                                     30, 2018

 38                                                  8,409                                            16,221
                                                                        18
Business - Mutual Fund Distribution Platform-StAR MF (cont’d)

                                                                                                                                                           Some Key
    Total Transaction value - Mutual Fund (₹ million)                                         Transacted value through BSE Star MF -
                                                                                                                                                            Figures
                                                                                                           SchemeType
                                             11,78,237                                                                                                   Orders Processed
                                                                                                      2,22,460
                                                                                                                                                         ~ 3.2 million
                                                                                                                              1,88,600                   (Sep 2018)
   CAGR 114%                                                                              1,68,790                                      1,72,980
                                  7,43,014

                       4,42,346
                                                                                                                                                         9,16,000 SIPs
                                                         3,91,255 3,61,570
                                                                                                                                                         added
            1,04,940                                                                                                                                     New Registration
 55,955
                                                                                                                                                         Count for XSIP
FY13-14 FY14-15 FY15-16 FY16-17 FY17-18 Q1 FY19 Q2 FY19
                                                                                                Q1FY19                               Q2FY19              increased 3x in FY
                                                                                                             Liquid     Non-Liquid
                                                                                                                                                         17-18
              Number of Orders - Mutual Fund                                                   Average Value Per Order (in ₹ '000)
                                                                                                                                                         Q2 FY19
                                              1,70,30,445                                                                                                Mutual fund
                                                                                                          135                                            Revenue : ₹ 71
                                                                                                                      115                                million
    CAGR 132%                                                                        96
                                                                        86,57,302
                                                            69,51,498
                                                                                               66                             69                         In H1 FY19, BSE
                                     64,83,468                                                                                           56
                                                                                                                                                    42
                                                                                                                                                         StAR MF has
                        32,80,067
            15,87,735
                                                                                                                                                         processed above
 5,84,453                                                                                                                                                15.6 million
                                                                                                                                                         transactions.
 FY13-14 FY14-15 FY15-16 FY16-17 FY17-18 Q1 FY19 Q2 FY19                            FY13-14 FY14-15 FY15-16 FY16-17 FY17-18 Q1 FY19 Q2 FY19
                                                                                              19
Business – Services to Corporates

                 Securities Listed (as at year-end)                                                              Listing Fees (₹ million)
                                                                                     484           958           1,446       1,382        1,776        512             472
                           5,911

                                        5,834                                                                                              496

                                                                                                                 433          340

                   5,624                          5,629                                            332
                                                             5,577                                                                        1,280
                                                                                                                 1,013       1,042
                                                                                      184                                                               115            111
                                                                                                   626
                                                                                      300                                                               397            361
                                                                         5,363
       5336
                                                                                    FY13-14      FY14-15     FY15-16        FY16-17      FY17-18     Q1 FY19         Q2 FY19

                                                                                             Annual Listng Fee           Listing processing and Other Listing fees

                                                                                                     Book Building & Other Services (₹ million)

 FY13-14      FY14-15   FY15-16    FY16-17   FY17-18   Q1 FY19   Q2 FY19               108            96           165          187          431            48           72

• Include listing of debt capital and mutual fund schemes and excludes                          CAGR 35% 
  delisted securities                                                                                                                        100
• As on Aug 31, 2018
Decrease in securities listed during FY19 on account of delisting of 327                                                         44          331
                                                                                                                   53
securities majorly due to compulsory delisting, partly offset by new listing            33                                                                               26
                                                                                                      41           112          143                         17
of 61 securities.                                                                       74            55                                                    32           46
                                                                                     FY13-14       FY14-15       FY15-16      FY16-17      FY17-18     Q1 FY19        Q2 FY19
                                                                                                      Book Building Fees              Other Services Fees

                                                                               20
Business – Small & Medium Enterprises (SME)

           No. of Companies Listed (As on End of Period)                                            Listing Related Income (₹ in million)
                                                                       258
                                                            235                                                                            39
                                                                                                             CAGR 28% 
                                                178

                                    131                                                                                         23
                                                                                                                    20
                                                                                                        18
                        89                                                               14
         43                                                                                                                                          9
                                                                                                                                                               7

       FY13-14       FY14-15       FY15-16     FY16-17    FY17-18    YTDFY19         FY13-14      FY14-15        FY15-16     FY16-17    FY17-18   Q1 FY19   Q2 FY19

                                                                                                             Total Turnover (₹ million)
          No. of Companies Migrated to Main Board
                    (As on End of Period)                                                                                              30,075
                                                                      53                      27,306
                                                            46

                                                                                                                           15,895
                                                  25                                                           13,946
                                                                               10,164
                                        16                                                                                                         7,704
                                                                                                                                                             5,834

   -             -             -

FY12-13       FY13-14    FY14-15     FY15-16    FY16-17   FY17-18   YTDFY19    FY13-14        FY14-15         FY15-16      FY16-17     FY17-18    Q1 FY19   Q2 FY19

                                                                                21
Preferred Capital Raising Platform

  Since April 2015, capital raised           $ 3.88 billion                    During Q2 FY19,
  through BSE                                [₹ 0.17 trillion]                 BSE listed
  $ 30 billion                               Raised through BSE’s electronic   504
  [₹ 2.17 trillion] (till Sep 30, 2018)      bond platform during H1 FY19      Privately Placed Debt instruments

  During FY 17-18 capital raised             During H1 FY19,                   During FY 18-19,
  through BSE                                BSE listed                        BSE listed
  $ 10 billion                               30                                942
  [₹ 0.62 trillion]                          Initial Public Offers             Privately Placed Debt instruments

                    Fund Raised – PPDI (₹ in Million)
                                  7,04,454

                                                              5,38,220
      4,44,544                                 4,64,112
                    4,36,795

      Q2 FY18       Q3 FY18        Q4 FY18     Q1 FY19        Q2 FY19

Source : BSE                                                         22
Business – India International Exchange at GIFT City

Commenced Operations from 16th January, 2017
               Index Derivatives     Sensex, India 50 Futures & Options

                 Indian Stock         107 stocks including Reliance Industries Limited, HDFC Bank Limited, Axis Bank Limited, Infosys
                 Futures              Limited, Tata Consultancy Services Limited, Maruti Suzuki India Limited, Tata Motors Limited,
                                      ICICI Bank Limited, Larsen & Toubro Limited and State Bank of India Limited

                 Global Stock         Apple INC, Facebook INC, Microsoft Corporation, Alphabet INC (Google) and JP
                 Futures              Morgan
    Asset
  Classes &      Commodity            Gold, Gold KG, Silver, Copper, WTI Crude, BRENT Crude
                 Futures
  Contracts
                 Commodity            Gold
                 Options

                 Currency             EUR USD, GBP USD and JPY USD
                 Derivatives

                 Debt Securities      Masala Bonds, Foreign Currency Denominated Bonds

                                                              23
Business     – India International Exchange at GIFT City (cont’d)

Particulars                                                                                          INDIA INX
Value of MTN Programme Established                                                                  USD 30,845 Million
No. of MTN Programme Established                                                                                    5
Value of Bonds Listed                                                                                USD 6,299 Million
No. of Bonds Listed                                                                                                13

                  Market Share – MTN                                           Market Share – Bonds Listed
                         100%                                                             95%

Highest Volume in a day                                                 Highest Turnover in a day
1,35,740                                                                $ 1.77 Billion
on 26th September 2018                                                  on 26th September 2018

Exchange Daily Trading Hours
22.00 Hours
04:30:00 hours to 17:00:00 hours and 17:00:01 hours to 02:30:00 hours (Indian Standard Time)

                                                                   24
Business          – India International Exchange at GIFT City (cont’d)

                                                           (₹ in Million)                         INX Commodity
    INX Index Derivatives Total
            Turnover                                                                         Derivatives Total Turnover
                                                                                                                                  16,864

                                     35,256

                                                                                                                         11,865

                                                       INX Total Turnover
                            17,015                                                                               6,827
                                                                                  52,274

                   8,296                                                                                 3,247
          3,412                                                                                  1,721
 1,276                                                                   29,043
 Q2FY18   Q3FY18   Q4FY18   Q1FY19   Q2FY19                                                  Q2FY18 Q3FY18 Q4FY18 Q1FY19 Q2FY19

                                                                15,132
    INX Indian Stock Derivatives                        6,670                                   INX International
                                               3,071
           Total Turnover                                                                    Commodity Total Turnover
                                              Q2FY18 Q3FY18 Q4FY18 Q1FY19 Q2FY19
  74
                                                                                                                         158       154

            11       9
                              5         0
                                                                                             -           -       -
 Q2FY18   Q3FY18   Q4FY18   Q1FY19   Q2FY19                     25                         Q2FY18 Q3FY18 Q4FY18 Q1FY19 Q2FY19
Business – India International Exchange at GIFT City (cont’d)

          INX Index Derivatives                                                                                      INX Commodity Derivatives
              Contracts No.                                                                                                Contracts No.

                                         29,74,380                                                                                                         4,45,013

                                                                                                                                                2,95,604
                                                                INX Total Contracts No.
                                15,21,314
                                                                                                   34,39,843                       1,60,027
                     7,53,046                                                                                             79,801
           3,17,376                                                                                              42,153
1,24,227

 Q2FY18 Q3FY18 Q4FY18 Q1FY19 Q2FY19                                                    18,38,223                Q2FY18    Q3FY18       Q4FY18   Q1FY19      Q2FY19

                                                                            9,13,939                                    INX International
    INX Indian Stock Derivatives
                                                                                                                     Commodity Contracts No.
           Contracts No.                             1,71,971
                                                                 3,98,113

  5,591
                                                     Q2FY18      Q3FY18      Q4FY18    Q1FY19      Q2FY19
                                                                                                                                                 20,853 20,448

             936         864
                                   452
                                              2                                                                  -         -       -        -
                                                                                                               Q1FY18 Q2FY18 Q3FY18 Q4FY18 Q1FY19 Q2FY19
 Q2FY18     Q3FY18     Q4FY18    Q1FY19     Q2FY19
                                                                              26
Business - Data Business Products

                                          Corporate                     End of day or
       Market Data
                                            Data                          Historical

         Equity Level 1 – Real-time & 1
                                           Corporate Announcement              Quotation files
               minute Snapshots

           Equity Level 2 – Real-time           Financial Results               Annual report

         Indices – Real-time & 1 minute
                                              Shareholding Pattern              Daily Bulletin
                    Snapshots

                                           Corporate Action – through
          Derivatives (Equity , Index ,                                      Sector Classification
                                                     SWIFT
           Currency & Interest Rate
           Derivatives) – Real-time

                                                                          Trade and Order book data

 Market Data products marketed by Deutsche Boerse in International Market

                                                     27
Index

 1      Overview
               1

 2      Business

 3      State-of-the-art Infrastructure and Technology

 4      Recent Initiatives & Growth Drivers

 5      Performance Highlights

                                              28
State-of-the-art Infrastructure & Technology

Technology is a key component of operations and business strategy and we regard it as an
important component of success
Entered into strategic technology alliance with Eurex in Mar 2013,
                                                                              Co-location services and high-speed Ethernet connections
so as to deploy the Eurex new generation trading system, the T7,
                                                                             offered to market participants to enable low latency trading
                 for trading in various segments

Screen based trading system                                                Standard Portfolio Analysis of Risk ("SPAN") margin system, an
Available under license to members of the exchange as                       industry-standard margin system, used by over 30 exchanges
                                                                            and clearing organizations worldwide, to evaluate the overall
well as their clients
                                                                                risk in a portfolio and accurately match margins to risk
All equity cash, equity derivatives and currency derivatives
 trades are executed on BOLT+
                                                                                      Technology Spend as % of Total Revenue1
Migrated various segments onto BOLT+
                                                                                                                                                  ₹ million
  - Currency derivatives: Nov 2013                                         12%          11%         12%            16%          16%       17%        18%
  - Equity Derivatives: Feb 2014
  - Equity Cash: Apr 2014

 All platforms are interconnected and operated through the same
  network and workstation, which provides market participants a
            seamless experience and efficient operation

   Real-time risk management system that conducts real-time
                                                                          FY13-14      FY14-15     FY15-16       FY16-17       FY17-18   Q1FY19    Q2FY19
           calculations of members' margins and limits
                                                                                                             Technology Cost

                                                                     29    1.    Includes Computer Technology Related Expenses and Spend on Technology Program.
Sponsored Market Access

Implementation of ‘Sponsored Market Access’ (SMA) at Co-location

   • SMA is a software distribution model in which applications are hosted by a service provider and made available to
     customers over a network.
   • Free of cost rack space is allocated by BSE to the SMA Service providers to install their algo trading application server in BSE
     Co-location. The members can connect to this SMA algo server at Co-location via Internet.
   • The algo strategy parameters can be triggered from the member front-end application and sent to the SMA algo server at
     Co-location.
   • The corresponding algos will generate orders to be sent to BSE trading system through Co-location network.
   • The algo orders will be sent to the BSE Trading system via the high speed Co-location gateway for minimum latency.
   • Members can execute orders over high speed Co-location network without installation of any infrastructure at Co-location
     by the members.

      Advantages

  • For Members
  • Zero capital expenditure on infrastructure at Co-location.
  • The algo orders will be generated at Co-location and sent to the BSE Trading system via the high speed 10G Co-location
    network for minimum latency.
  • For Vendors
  • Free of cost rack space is allocated by BSE to SMA service providers to install their algo trading application server in BSE Co-
    location.
  • Vendor can service multiple clients with a centralized algo server installed at Co-location. Hence, vendor’s cost of
    maintenance is low.
                                                                      30
BOLT PLUS ON WEB (BoW)

Application for Desktop & Mobile                        One Window with Multiple Utilities

                                         Trading             Segments            For           Connectivity
• Single window for Multi
                                     • BSE                • Equity – F&O   • Dealers         • Leased Line
  Exchange Segments with all                                – Currency –
                                     • NSE                                 • Investors       • Internet
  Asset Class.                                              IRF - OFS –
                                     • MCX                                 • Admin for HO
• Combined Market Depth.                                    Mutual Fund
                                     • NCDEX                               • Multiple Mini
• Facility of After Market Orders                           – SLB – Debt     Admin for
  (AMO).                                                    – ITP            Regions &
• Real Time Margining and Risk                                               Branches
  Monitoring.                                             • Equity – F&O   • RMS
• MTM Based Single Click Auto                               – Currency
  square Off. Timer Based Square
  off.                                                    • Commodities
• Bolt+on web (BOW)- Free of cost
  for all Members
                                    • Corporate Action Information.        • No IT infrastructure cost to
                                    • Customized short cut keys -            the Member.
                                      predefined Key Mapping Styles .      • Completely Hosted
                                    • NEWS Plus with RSS feeds and           Application.
                                      Twitter.                             • Single Application for all
                                    • Customized Add on of Web links.        Users Types .
                                    • Top Gainers / Top Losers - Most      • Trade commencement in one
                                      Active by VOLUME / VALUE.              day.
                                                                           • Real time support services.

                                                   31
BEST- BSE ELECTRONIC SMART TRADER – HOSTED TRADING SUITE
(Thomson Reuters Omnesys NEST hosted trading platform )

                                                    SingleWindow with Multiple Utilities

           Exchanges/Segments                                         Users                                          Features

•BSE (Equity, Equity Derivatives, Currency                •Admin                                 •Real time Risk Management
 Derivatives, SLB, OFS, IPO, OTB, MF)                     •Multiple Parallel Admin               •User Management
•NSE (Equity, Equity Derivatives, Currency                •Branch Admin                          •Multi Exchange/Segment trading
 Derivatives, SLB, IPO, OFS)
                                                          •Dealer
•MCX
                                                          •Offline Client
•NCDEX
                                                          •Online Client

                                                   BEST- Free of cost for all Members

                                                             Roles & Functionalities

                                 Admin                                                                       Users

     User Management                      Risk Management                              Dealers                            Online Client

•   User Creation                    •   Comprehensive Risk Rules          •   Multiple Exchange &               •   Common login for EXE & WEB
•   Creation & assigning roles       •   Real time Margin & MTM                Segments for Trading                  platform
•   Manage Users                         calculation                       •   Real time broadcast               •   Real time broadcast
•   Reporting & MIS                  •   Managing different Risk           •   Basket Order, Spread Order,       •   Payment gateway
•   Send Message                         levels                                After Market Order, Cover         •   Order & Trade reports
                                     •   Multiple Trading Products             Order functionality               •   Historical reports
                                     •   Admin Square off                  •   Online IV’s for Option
                                     •   MIS Auto Square off                   Traders
                                                                           •   Payment Gateway
                                                                          32
Index

 1      Overview
               1

 2      Business

 3      State-of-the-art Infrastructure and Technology

 4      Recent Initiatives & Growth Drivers

 5      Performance Highlights

                                              33
Recent Initiatives & Growth Drivers

 Recent Initiatives                About                                   Enablers                          Highlights
                      New electronic bidding platform           Introduction of appropriate fee    * Reliance Industries Limited
                      for raising debt by any entity            structure based on the growth      successfully raised Rs. 3500
BSE-Bond Platform     over ₹ 5 billion in a year (w.e.f.        and competition strategy at an     crores by issuing bonds on
                      July 1, 2016) and ₹ 2 billion in a        appropriate time                   private placement basis using
                      year (w.e.f. April 1, 2018)                                                  BSE BOND platform.

                                                                                                   * Andhra Pradesh Capital
                                                                                                   Region Development Authority
                                                                                                   successfully raised Rs.2000
                                                                                                   crores on BSE BOND platform

                                                                                                   * Market-share of 61%
                      BSE commenced commodity                   * Commenced commodity              * Gained Market share of 86%
   Commodities        derivatives trading and became            derivatives trading in delivery-
                      the first universal exchange              based futures contract in gold
     Segment                                                    and silver on October 1, 2018.

                                                                * Commenced trading in futures
                                                                contracts on Oman Crude Oil

                                                                * Commenced trading in 1MT
                                                                copper contracts
                      Monetization of services                  Commencement of a steady           BSE StAR MF set an all-time
                                                                source of revenue which would      record high of 31.66 lakh
  BSE StAR MF                                                   grow        with    increasing     transactions in September
                                                                participation of investors in      2018, witnessing a 10% growth
                                                                mutual funds.                      on a month on month basis.
                                                           34
Recent Initiatives & Growth Drivers (cont’d)

  Recent Initiatives              About                                           Highlights
                       Board of SEBI has approved       Inter-operability may increase liquidity across segments
  Inter-operability    the inter-operability among
  among Clearing       Clearing Corporations on all
                       products except commodity
    Corporations       derivatives, in its Board
                       Meeting held on September
                       18 , 2018.

                       Ongoing thrust to encourage      Increase in steady annual source of listing revenue.
                       SME companies to list on         Growth in turnover on Exchange over time especially after
   Small & Medium      Exchange                         migration of SME companies to Main Board of the Exchange.
 Enterprises Segment

                       Introduced cross currency        Allow entities like corporates, foreign portfolio investors and
   Cross Currency      derivatives (future and          non-resident Indians to participate and to take positions in the
  Derivative & Cross   options) on pairs such as Euro   exchange traded currency derivatives markets.
                       (EUR)-US Dollar (USD), Pound
     INR Options       Sterling (GBP)-USD and USD-
                       Japanese Yen (JPY) and
                       options on EUR-INR. GBP-INR
                       and JPY-INR in addition to
                       existing USD-INR Options.
                                                   35
Recent Initiatives & Growth Drivers (cont’d)

      Alliances                  About                                             Highlights
                      BSE has entered into an a          The partnership will strengthen BSE's and LME's global
    London Metal      licensing agreement with the       collaboration and support opportunities that will mutually
                      London Metal Exchange (LME)        benefit the exchanges. The agreement is designed to facilitate
  Exchange Limited    a premier base metals-             closer cooperation in areas such as product development,
       (LME)          focused commodities                training and the sharing of market resources. The licensing
                      exchange                           agreement will also allow BSE to use the prices of LME's Base
                                                         Metals contracts to price its proposed base metals futures
                                                         contract.
                      BSE signs MoU with                 BSE has signed a MoU with FIEO to create awareness about the
    Federation of     Federation of Indian Export        benefits of commodity/derivatives market and encourage
    Indian Export     Organizations                      commodity stakeholders to hedge on exchange.
                                                         BSE and FIEO will be collaborating together for the growth and
    Organizations                                        development of the value chain participants and enable them to
                                                         face competition and manage price risk better.

                      BSE signs MoU with Dubai           DME is the premier international energy futures and
  Dubai Mercantile    Mercantile Exchange to             commodities exchange in the Middle East
     Exchange         explore cooperation on             The strategic collaboration with the energy-focused
                      commodity derivatives market       commodities exchange will help create a resourceful
                                                         commodities derivatives market to facilitate tremendous growth
                                                         in the country’s energy sector

                                                    36
Recent Initiatives & Growth Drivers (cont’d)

      Macro-economic Factors – Underpenetrated Indian Markets

                                                                  GDP Factor & India’s Credit Rating

     Correlated to market capitalization / activity which in turn is linked to GDP
                                                                                                              Compared to other geographies,Market Cap / GDP ratio has room for
                   Scope for Market Cap / GDP ratio to increase to pre-financial crisis levels                improvement

         151%                                                                                                                                                107%
                                99%     99%             69%              77%     72%      69%          90%
                       55%                      55%              61%                                                                           96%
                                                                                                                               90%
            CY07

                        CY08

                                 CY09

                                         CY10

                                                 CY11

                                                         CY12

                                                                  CY13

                                                                          CY14

                                                                                  CY15

                                                                                           CY16

                                                                                                       CY17
                                                                                                                               India          World          BRICS
           Global rating agency Moody’s upgraded India’s local and foreign currency issuer ratings to Baa2 from Baa3
            and changed the outlook on the rating to stable from positive

                                                                         Government Initiatives
                                                                                         Demonitization will lead be a positive impact on capital markets in
       GST will lead to tax simplification which in turn will boost GDP
                                                                                         India during long term

                                                                                         ₹ 2.1 trillion Bank Recapitalization announcement a booster dose to
                                                                                         economy by Government
                                                                                         Corporates to meet about 25% of their financing needs from the bond
                                                                                         market
      EPFO allowed to invest in equity markets – will boost equity                       Launch of Commodity Spot exchanges to drive transparency and efficiency
      investments in India                                                               Provisions to further develop the IFSC at Gift City

                                                                                                  37
Recent Initiatives & Growth Drivers (cont’d)

   Macro-economic Factors – Underpenetrated Indian Markets

                     Global Inflow of Funds                                                     Demographic Dividend

            With 7-8% GDP growth rate, India is the
             preferred investment destination                                                             % of India’s total population in
            FPIs granted permanent registration compared                                                 working age category for the
             to approvals for 1 / 5 years earlier                                 65% - 70%               next 25 years

                   Participation by Retail Investors                                         New Products and Initiatives

            Historical preference for physical assets but that is
             changing with increasing financial awareness
            Increase in India equity indices has improved                   Room to introduce innovative derivative products like weather
             confidence                                                       derivatives, energy derivatives and credit derivatives
            Tax breaks further incentivizing to invest
                                                                             Further easing of restriction of FIIs trading in capital market
   India’s equity savings as a percentage of financial savings is
                                                                              products
   substantially lower than other countries
                   Source : World Bank & Care Research                       Introduction of more agricultural commodities and other global
                                                                              commodities for trading
    5%            15%        26%        29%         30%       49%

   India         China     Malaysia   Singapore   W.Europe     US

                                                                     38
Index

 1      Overview
               1

 2      Business

 3      State-of-the-art Infrastructure and Technology

 4      Recent Initiatives & Growth Drivers

 5      Performance Highlights

                                              39
Integrated Business Model
•     Multiple contact points with members and market participants provides the ability to generate revenue from
      multiple levels of the business

              Primary                             Trading                       Clearing & Settlement                         Distribution

                                     Linked to
    1 Transaction Charges             Market Activity
                                                           Directly proportional to market activity levels

      Treasury Income on             Linked to
                                                           Linked to interest rates and, to an extent, market activity since that would lead to more
    2 Clearing and Settlement         Market Activity
                                                            margin being deposited by members
      Funds                           to an Extent

    3 Other Securities Services      Recurring            Primarily consists of charges recovered from members for network connectivity

                                                           Mostly derived from listing income that is not impacted by market activity
    4 Services to Corporates         Recurring            Dependent on number of listed entities and hence is a recurring revenue stream
                                                           Potential for increase if amount charged is increased

                                                           Impacted primarily due to level of subscriptions and revision in pricing policies
    5 Data Dissemination Fees        Recurring
                                                           Contributes only 4-5% in India compared to 10-25% in developed markets

    6 Income From Investments        Recurring            Linked to investment yields
       and Deposits

    7 Other Income                   Recurring            Mostly derived from rent and training institute etc., which are stable sources of income

                                                                                       Linked to Market Activity      Recurring
                                                                          40
Standalone Profit & Loss

                                       Operational Income
Half Year Ending (₹ in million)                       30-Sep-16      30-Sep-17     30-Sep-18

Securities Services                                           614            805           695
Services to Corporates                                        802          1,008          1,104
Data Dissemination Fees                                       123            124           147
Revenue from Operations                                      1,539         1,937          1,946

Income From Investments and Deposits                         1,020         1,132           862

Other Income                                                  199            128           178
Total Income                                                 2,758         3,197          2,986

                                                 41
Standalone Profit & Loss (cont’d)

Half Year Ending (₹ in million)                                                               30-Sep-16                30-Sep-17                30-Sep-18

Total Income                                                                                           2,758                      3,197                  2,986
Employee Expenses                                                                                         343                       364                     419
Technology Cost & Technology Program                                                                      518                       625                     638
Admin & Other Expenses*                                                                                   554                       484                     628
EBITDA                                                                                                 1,344                      1,724                  1,301
Depreciation & Amortization                                                                               220                       182                     200
Exceptional Items
Settlement Guarantee Fund ("SGF")                                                                         208                            -                      -
Profit on sale of part equity stake in CDSL                                                                   -                  -3,160                      -51
Other Exceptional Items                                                                                       -                         5                      5
Profit Before Tax                                                                                         916                     4,697                  1,147
Tax Expenses                                                                                               44                       224                       98
Net Profit (Inc. CDSL Gain)                                                                               872                     4,473                  1,049
Net Profit Margin (Exc. CDSL Gain)                                                                       32%                        41%                    33%

Note :
The Company has investment of ₹ 1,700 Lakh in secured Non-convertible Debentures of IL&FS Group. Considering the recent developments, during the current quarter, a
provision of ₹ 340 Lakh has been made, and unrealised interest of ₹ 82 Lakh has been reversed.

                                                                                  42
Consolidated Profit & Loss

                                  Steady increase in Operational Income
Half Year Ending (₹ in million)                             30-Sep-16     30-Sep-17    30-Sep-18

- Transaction Charges                                             485           682          596
- Treasury Income on Clearing and Settlement Funds                175           199          164
Others                                                            136           134          117
Securities Services                                               796         1,015          877
Services to Corporates                                            802          1,008        1,105
Other Operating Income                                            213           269          317
Revenue from Operations                                         1,811         2,292        2,299
Income From Investments and Deposits                              970           870          812
Other Income                                                      184           146          171
Total Income                                                    2,965         3,308        3,282

                                                     43
Consolidated Profit & Loss (cont’d)

Half Year Ending (₹ in million)                                                        30-Sep-16                30-Sep-17                 30-Sep-18
Total Income                                                                                   2,965                    3,308                    3,282
Employee Expenses                                                                              504                       588                      680
Technology Cost & Technology Program                                                           456                       546                      570
Other Expenses*                                                                                647                       614                      770
EBITDA                                                                                       1,358                     1,560                    1,262
Depreciation & Amortization                                                                    227                       210                      235
Finance Cost                                                                                     5                         6                        4
Exceptional Items
Liquidity Enhancement Scheme ("LES")                                                             -                         -                        59
Settlement Guarantee Fund ("SGF")                                                              208                         -                         -
Other Exceptional Items                                                                          -                    -4,613                       -46
Profit Before Tax & Minority/Associate                                                         918                     5,957                    1,010
Associate Share                                                                                  5                        70                      135
Profit Before Tax                                                                              923                     6,027                    1,145
Tax Expenses                                                                                    63                       244                      171
Minority Share                                                                                 210                       133                         -
Net Profit From Continuing Operations                                                          649                     5,650                      974
Profit From Discontinued Operation                                                             427                       255                         -
Net Profit from Total Operation                                                              1,076                     5,905                      974
 Note :
 The Company has investment of ₹ 1,700 Lakh in secured Non-convertible Debentures of IL&FS Group. Considering the recent developments, during the current quarter,
 a provision of ₹ 340 Lakh has been made, and unrealised interest of ₹ 82 Lakh has been reversed.
                                                                                 44
Financial Overview – Consolidated

                                                    Key Performance Indicators                                                 (₹ in million)
16,000     26%               21%                   20%                  36%                  34%                31%                   25%                110%
14,000                                                                                                                                                   90%
12,000                                                                                                                                                   70%
10,000
                                                                                                                                                         50%
 8,000                                       6,701                                         6,989
                          6,248                                    6,183                                                                                 30%
 6,000
         5,298
 4,000                                                                                                                                                   10%
                                                                           2,206                   2,373
                 1,352            1,297              1,329                                                    1,642                1,641                 -10%
 2,000                                                                                                                515                  407
    -                                                                                                                                                    -30%
          FY13-14          FY14-15             FY15-16                 FY16-17              FY17-18*           Q1FY19                Q2FY19
                                                   Total Revenue         Net Profit        Net Margin           * Net profit from continuing operation

                                                           Earnings per share (₹)
                                                          [Continuing operations]
                                                                                                      43.51
                                                                                   40.41

                          25.57            23.77              24.35
           22.48

                                                                                                                      9.64              7.75

          FY12-13        FY13-14          FY14-15            FY15-16             FY16-17            FY17-18        Q1FY19             Q2FY19

                                                                           45
Financial Overview (cont’d)

                                                        Consolidated Net-worth (₹ million)
                                                                                                  31,344              30,789
                                                                                                                                  29,256
                                                                            26,624
                                 24,609                25,229
            23,708

           FY13-14              FY14-15               FY15-16              FY16-17               FY17-18         Q1 FY18-19     Q2 FY18-19

                                                       Dividend per share (₹) & Pay-out Ratio
 80            124%                                                                                                                          140%
 70                                                                                                                                          120%
 60                                                                                                            93%              95%
                                                                 87%                                                                         100%
 50                                                                                      74%
                                          66%                                                                                   36.0         80%
 40
                                                                                                               28.0                          60%
 30
                                                                                         15.0                                                40%
 20
                 8.0                      8.0                    10.0
 10                                                                                                                                          20%

   -                                                                                                                                         0%
              FY12-13                 FY13-14                   FY14-15                FY15-16                FY16-17          FY17-18
                                                        Dividend Per Share            Dividend Payout Ratio

Figures as per restated IGAAP financials for FY12-13 to FY14-15 and Ind-AS financials for FY15-16 onwards
# Dividend pay-out ratio is calculated based on Standalone Profit                  46
THANK YOU

                    INVESTOR RELATIONS CONTACT :
                    Yatin Padia
                    Head – Investor Relations
                    +91 22 2272 8516
                     bse.ir@bseindia.com

This document has been prepared exclusively for the benefit and internal use of the recipient and does not carry any right of
reproduction or disclosure.Neither this document nor any of its contents maybe used for any other purpose without the prior
written consent of BSE Ltd. (the “Company”).

In preparing this document, the Company has relied upon and assumed, without any independent verification, the accuracy and
completeness of all information utilized within this document. This document contains certain assumptions, which the Company
considers reasonable at this time and which are subject to change. Any calculations or forecasts produced within this document
are indicative and subject to change. No representation or warranty is given by the Company as to theaccuracy, reasonableness o
r
completeness of any idea and/or assumption utilized within this document.

Recipients should not construe any of the contents within this document as advice relating to business, financial, legal, taxation,
or investment matters and are advised to consult their own business, financial, legal, taxation and other advisors . This document
does not constitute an offer for sale, or an invitation to subscribe for, or purchase equity shares or other assets or securities of the
Company and the information contained herein shall not form the basis of any contract. This document is also not meant to be or
to constitute any offer for any transaction.

                                                                                                                  47
You can also read