BUILDING A BRIDGE TO RECOVERY BEYOND COVID 19 - National ...
←
→
Page content transcription
If your browser does not render page correctly, please read the page content below
BUILDING A BRIDGE TO
RECOVERY BEYOND COVID‐19

                    1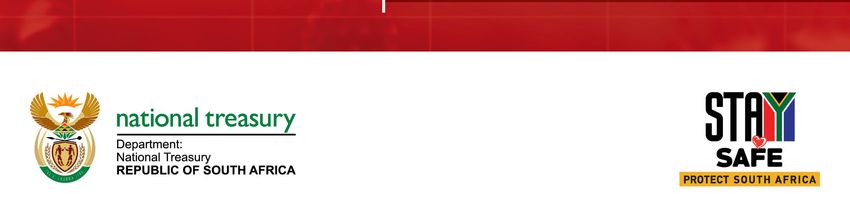
OVERVIEW
This special adjustments budget has a dual purpose:
It reports on the COVID‐19 fiscal measures, and the resulting adjustments to the
division of revenue and departmental allocations
It also sets out government’s commitment to strengthen the public finances, and to
position the economy for faster and inclusive growth
Government has responded to the COVID‐19 pandemic with large‐scale economic relief
measures. Support is targeted at the most vulnerable South Africans. These steps will also
build the capacity of the public health system to respond to the pandemic.
The National Treasury expects the economy to contract by 7.2 per cent in 2020.
Households and firms are grappling with the combined effects of economic restrictions
and the continued spread of the virus.
The public finances, which had reached an unsustainable position before the pandemic,
are now dangerously overstretched. Without urgent action in the 2021 budget process, a
debt crisis will follow.
This special adjustments budget is a bridge to the October 2020 Medium Term Budget
Policy Statement. Over the next several months, government will prepare a set of far‐
reaching reforms. Determined implementation of these measures will stabilise public
debt, contain the budget deficit, and fully restore economic activity to build confidence,
increase investment and promote job creation.
2
KEY POINTS ON ECONOMIC
INTERVENTIONS RE: COVID‐19
• Overall intervention is among the largest in the developing world
• Monetary Policy:
    • SARB cut interest rates by 250 bps – the median among emerging market
      countries is 100bps
    • Liquidity programme helped lower the 10yr bond yield from a high of 12.4%
      to 9%
• Fiscal Policy:
    • Mildly expansionary before the pandemic
    • Cyclically‐adjusted primary balance in 2020/21 indicates South Africa’s fiscal
      stance is more expansionary than many peer EM countries
    • The broad fiscal package amounts to more than 10% of GDP
• Rebuilding Policy buffers
    • Pre‐crisis fiscal position: poor capacity to respond to crises. The fiscus is now
      dangerously unprepared for another shock nor supporting public investment
    • Buffers can be rebuilt by immediately targeting a primary surplus in the next
      few years

                                           3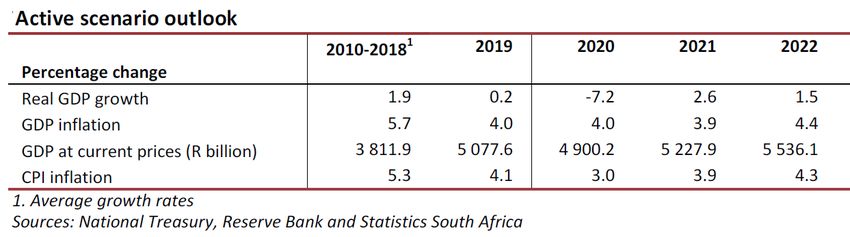
ANNOUNCED FISCAL PACKAGE IS LARGER THAN IN
OTHER DEVELOPING COUNTRIES IN THE GROUP OF 20
Comparison of economic support announced by G20 governments

                   35
                                                                                  Revenue and expenditure measures
                   30
                                                                                  Loan guarantees, loans and equity injections

                   25
 Per cent of GDP

                   20

                   15

                   10

                    5

                    0
                                                       France

                                                                                                        Canada

                                                                                                                                                      Argentina

                                                                                                                                                                           Russia
                                                                                                                 Korea
                                                                                                                         Brazil
                                                  UK
                        Germany

                                                                            US

                                                                                                                                                                  Turkey

                                                                                                                                                                                                   Mexico
                                  Italy

                                                                Australia

                                                                                                                                  Indonesia
                                                                                                                                              China

                                                                                                                                                                                    Saudi Arabia
                                                                                         SOUTH AFRICA
                                          Japan

                                                                                 Spain

                                                                                                                                                                                                            India
                                                                                                                                                                                                                    4
THE ECONOMIC ENVIRONMENT HAS
WORSENED SINCE BUDGET 2020
Global conditions have deteriorated significantly, with a global recession in 2020 now inevitable
Risks around COVID‐19 pandemic continue to play out, weighing on economic activity and sentiment
High frequency activity data points to economic impact being far worse than the global financial crisis
Domestically, growth in Q4 2019 came out much worse than expected (at ‐1.4 per cent quarter‐on‐
quarter seasonally adjusted annualised rate), bringing 2019 growth to 0.2 per cent
Growth was negatively affected by declines across the primary, secondary and tertiary sectors.
Electricity constraints intensified in Q4 2019 and Q1 2020, weighing on production and sentiment even
before COVID‐19. Electricity production (distributed) fell to its lowest level in March 2020 since
September 2003.
High frequency data now showing a contraction in Q1 2020 is likely. March is expected to weigh strongly
on the first quarter outcome as COVID‐19 restrictions intensified both globally and domestically.
Leading and sentiment indicators clearly point to significant declines in economic activity from April,
and a slight recovery in activity in May – however indications are that demand remains very weak.
Inflationary pressure remains muted in the short term owing to weak domestic demand and lower oil
prices
Risks to the global and domestic environment remain biased strongly to the downside
Potential for further shut downs in response to infections
Longer term ramifications for employment, investment and structure of trade
Existing risks to trade tensions, dispersion heightened by pandemic
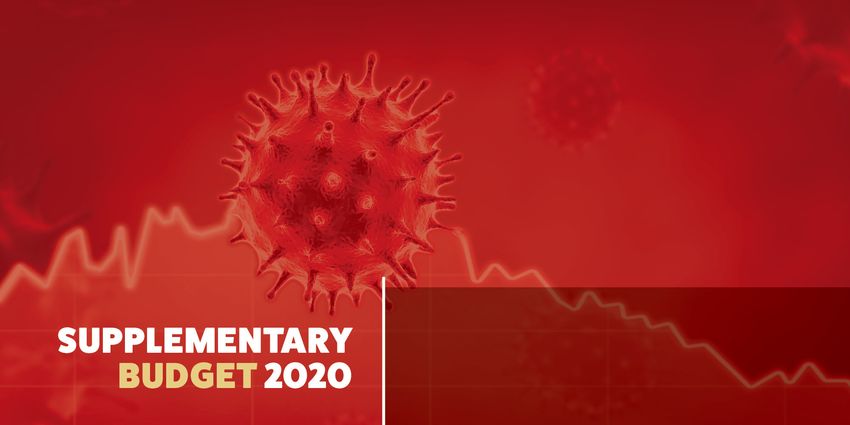
5HOW HAS THE FISCAL SITUATION CHANGED
SINCE THE 2020 BUDGET?
Main budget deficit (percent of GDP), 2020/21 Main budget deficit (R billion), 2020/21
0 0
‐2 ‐100
‐4 ‐200
‐6 ‐300
Per cent of GDP
R billion
‐6.8
‐8 ‐400 ‐368.0
‐10 ‐500
‐12 ‐600
‐12.7 ‐624.5
‐14 ‐700
‐14.2 ‐697.8 ‐709.7
‐14.6
‐16 ‐800
Budget 2020 Revised 11 May Revised 26 May Revised 2020 Budget 2020 Revised 11 May Revised 26 May Revised 2020
2020 2020 Supplementary 2020 2020 Supplementary
budget budget
The 2020/21 fiscal position, and the financing requirements, are markedly changed
The public finances, which had reached an unsustainable position before the pandemic,
are now dangerously overstretched.
Without urgent action in the 2021 budget process, a debt crisis will follow.
6THE GAP BETWEEN REVENUE AND
EXPENDITURE IS EXPECTED TO WIDEN
Main budget revenue and expenditure
The COVID‐19 pandemic
38 erupted when South Africa
Main budget revenue
36 was already in a weak fiscal
Main budget expenditure position
34
In recent months, fiscal
Per cent of GDP
32 deterioration has accelerated
30 In 2020/21, significant tax
28 revenue underperformance is
expected, and expenditure
26
will increase as government
24 reprioritises and allocates
22 funds to contain COVID‐19.
The main budget deficit and
2006/07
2007/08
2008/09
2009/10
2010/11
2011/12
2012/13
2013/14
2014/15
2015/16
2016/17
2017/18
2018/19
2019/20
2020/21
gross borrowing requirement
will increase sharply
7DEBT‐SERVICE COSTS TAKE AN INCREASED
SHARE OF MAIN BUDGET REVENUE
Debt‐service costs as a proportion of main budget revenue
22 Gross national debt is
now expected to reach
20
81.8 per cent of GDP in
18 2020/21 compared to
16 the 2020 Budget
14 estimate of 65.6 per
cent of GDP
12
Per cent
10 Rising public debt
8
means that an ever‐
increasing share of tax
6
revenue is transferred to
4 bondholders
2
0
2000/01
2002/03
2004/05
2006/07
2008/09
2010/11
2012/13
2014/15
2016/17
2018/19
2020/21
8A DEBT CRISIS CAN HAVE LONG RUN
IMPLICATIONS – CONSERVATIVE ANALYSIS
Debt dynamics Loss of nominal GDP
160 45 100
Gross debt Debt‐service costs (RHS)
140 40
0
35
120 ‐100
Per cent of revenue
Per cent of GDP
30
100 ‐200
Rand billion
25
80 ‐300
20
60 ‐400
15
40 ‐500
10
20 5 ‐600
0 0 ‐700
2020/21
2021/22
2022/23
2023/24
2024/25
2025/26
2026/27
2027/28
2028/29
2020/21
2021/22
2022/23
2023/24
2024/25
2025/26
2026/27
2027/28
2028/29
Failure to arrest the debt trajectory will see debt‐service costs consume around 31% of main budget
revenue by 2024/25
The stock of debt crosses the 100% mark in 2023/24, reaching 140% in 2028/29
Deficits remain elevated at around 12% of GDP for a long‐time, severely constraining domestic saving
and investment
A fiscal crisis could deduct more than R2 trillion from GDP over the next decade
9A PHASED APPROACH TO MANAGING THE
PANDEMIC
Government is responding to the pandemic in a phased manner:
Phase 1 is to preserve the economy through a set of immediate, targeted and
temporary responses.
Phase 2 is a plan to recover from the immediate effects of the crisis by supporting
investment and employment.
Phase 3 is a pivot to position the economy for the faster growth needed to restore the
country’s long‐term prosperity.
The COVID‐19 fiscal package identifies R500 billion in economic relief.
It includes R190 billion in main budget spending – of which R145 billion is allocated
immediately – to protect lives and support livelihoods, R70 billion in tax policy
measures and a R200 billion loan guarantee scheme to support short‐term economic
activity.
The Reserve Bank has reduced interest rates and provided additional support to the bond
market, financial‐sector regulations have been eased to support the flow of credit to
households and businesses, and commercial banks have introduced temporary payment
holidays.
To date, more than 18 million South Africans have received temporary COVID‐19 grants,
which – along with other interventions for vulnerable households – will cost about
R41 billion 10A PHASED APPROACH TO MANAGING THE
PANDEMIC (CONTINUED)
In its first few weeks of operation, the COVID‐19 loan guarantee scheme had provided small
businesses with over R10 billion worth of loans.
As of mid‐June, the Unemployment Insurance Fund had provided R23 billion in COVID‐19
relief to over 4.7 million workers.
To the greatest extent possible, the balance sheets and operational capacity of the broader
public sector have been adjusted to form part of the national response.
These include state‐owned companies, the social security funds and public entities
such as the National Health Laboratory Service and the South African Social Security
Agency.
The National Treasury and the Reserve Bank have coordinated fiscal and monetary policy
responses.
Government has strengthened its working partnership with the private sector in response to
the national emergency.
The private health sector has made valuable contributions, providing critical care beds at a
favourable rate and complementing efforts to ramp up testing.
The Solidarity Fund, a private‐sector initiative, has augmented government’s efforts to
procure medical and personal protective equipment.
To support economic relief efforts, nearly R12 billion in debt relief has been extended to
over 124 000 small and medium‐sized enterprises by the banking sector.
11ADDITIONS TO SPENDING FOR THE FISCAL
RESPONSE TO THE PANDEMIC
Table 2.1 Main budget non‐interest expenditure increases
2020/21
The COVID‐19 fiscal
R million
relief measures are
Support to vulnerable households for 6 months 40 891
temporary and
Health 21 544
provide support
Support to municipalities 20 034
where it is needed
Other frontline services 13 623 most.
Basic and higher education 12 541
Small and informal business support, and job creation 6 061
Funding has been
secured by shifting
and protection
Support to public entities 5 964 resources from
existing programmes
Other COVID‐19 interventions 1 766
and drawing down
Allocated for COVID‐19 fiscal relief package 122 425
surplus funds from
Land Bank equity investment 3 000
institutions such as
Provisional allocations for COVID‐19 fiscal relief 19 575 the Unemployment
Total 145 000 Insurance Fund
Source: National Treasury
Government aims to spend these funds efficiently and effectively, avoiding waste.
Budget allocations across national, provincial and local government fund R145 billion of
government’s response. 12A PHASED APPROACH TO MANAGING THE
PANDEMIC (CONTINUED)
Commercial banks have also granted 90‐day payment holidays to more than 2 million
clients for relief totalling R16.5 billion to date.
Initiatives such as the Sukuma Relief Programme and the South African Future Trust are
providing interest‐free loans and grants to small and medium‐sized firms.
In the context of a sharp economic downturn in developing countries, international finance
institutions have announced a range of support mechanisms
Government intends to borrow US$7 billion from multilateral finance institutions for its
pandemic response. This includes a US$1 billion loan which was recently approved by the
New Development Bank.
As a member of the International Monetary Fund (IMF), South Africa intends to borrow
US$4.2 billion through the IMF’s rapid financing instrument, which is a low‐interest
emergency facility.
13YEAR‐TO‐DATE MONTHLY REVENUE
COLLECTIONS SIGNIFICANTLY WEAKER
Domestic value‐added tax collections Pay‐as‐you‐earn collections
38 2017 2018 2019 2020
2017 2018 2019 2020 47
36
34
42
32
R billion
R billion
30 37
28
26 32
24
22 27
March
October
February
May
July
August
April
January
June
September
November
December
March
July
February
August
April
October
May
January
November
June
September
December
14TAX REVENUE SHORTFALL OF R304.1 BILLION IN
2020/21
In‐year revenue compared with Budget forecasts (2020/21 prices)
COVID‐19 fallout
leads to
unprecedented drop
in in‐year revenue
estimates compared
to prior Budget
Expect temporary
shrinkage in tax base
as businesses close
and jobs are lost
Revenue shortfalls
include tax relief
measures amounting
to R26 billion in
foregone revenue
Improved tax
collection and
administration will be
key to achieving fiscal
15 stabilisationTAX‐TO‐GDP EXPECTED TO BE WORSE THAN
GLOBAL FINANCIAL CRISIS
Tax‐to‐GDP after crisis
26.5
26.0 Tax‐to‐GDP
expected to be
25.5 worse than
global financial
crisis; but should
Tax‐to‐GDP
25.0
recover along
24.5 with economy
and further tax
24.0 measures
Ratio from 2007/08 to 2016/17
(global financial crisis)
23.5
Ratio from 2018/19 to 2027/28
(forecast after COVID‐19)
23.0
‐2 ‐1 0 1 2 3 4 5 6 7
Years since crisis
16IN‐YEAR SPENDING ADJUSTMENTS
Table 2.2 Revisions to main budget non‐interest expenditure
R million 2020/21 Main budget non‐
interest spending has
Main budget non‐interest expenditure (2020 Budget Review) 1 536 724
increased by a net
Proposed upward expenditure adjustments 145 000 R36 billion in the
Proposed downward expenditure adjustments ‐100 885 current year.
National departments' baseline suspensions ‐54 403 This amount consists
Repurposing of provincial equitable share ‐20 000 of R145 billion added
Provincial conditional grant suspensions ‐13 848 to spending for the
Local government conditional grant suspensions ‐12 633 fiscal response to the
pandemic. This
Other adjustments ‐8 109
amount is partially
National Revenue Fund payments 13 offset by R109 billion
Downward revisions to skills development levy ‐2 122 from the items shown
Lower skills development levy due to 4‐month holiday ‐6 000 in Table 2.2.
Revised non‐interest expenditure 1 572 730
Change in non‐interest expenditure from 2020 Budget 36 006
Source: National Treasury
17UPDATED FISCAL FRAMEWORK FOR 2020/21
Table 2.3 Main budget framework
Main budget revenue is
2019/20 2020/21
projected to decline as
R billion/percentage of GDP Preliminary Budget 2020 Revised a share of GDP from
Main budget revenue 1 345.3 1 398.0 1 099.5 26.2 per cent in
26.2% 25.8% 22.6% 2019/20 to 22.6 per
Main budget expenditure 1 690.6 1 766.0 1 809.2 cent in 2020/21
32.9% 32.5% 37.2%
Main budget
Non‐interest expenditure 1 485.8 1 536.7 1 572.7 expenditure is
28.9% 28.3% 32.4% projected to increase to
Debt‐service costs 204.8 229.3 236.4 37.2 per cent of GDP in
4.0% 4.2% 4.9% 2020/21, reflecting
support provided to
Main budget balance ‐345.3 ‐368.0 ‐709.7
state‐owned companies
‐6.7% ‐6.8% ‐14.6% in the 2020 Budget,
Primary balance ‐140.5 ‐138.7 ‐473.2 COVID‐19 spending and
‐2.7% ‐2.6% ‐9.7% higher debt‐service
Source: National Treasury costs.
18REVISIONS TO MAIN BUDGET SPENDING
PLANS FOR 2020/21
Table 2.4 Major revisions to non‐interest spending plans
Budget 2020 Reductions Allocations Other Revised
R million adjustments
1 618 840 ‐24 310 25 055 13 619 599
General public services
Economic development 88 381 ‐12 145 4 649 – 80 886
Learning and culture 151 543 ‐15 617 10 560 ‐8 122 138 364
Health 55 516 ‐2 631 5 544 – 58 430
Peace and security 207 006 ‐4 185 10 170 – 212 991
Community development 219 727 ‐26 322 28 430 – 221 835
2
Social development 198 497 ‐15 675 41 016 – 223 837
Provisional allocations: COVID‐19 package – – 19 575 – 19 575
Provisional allocations not assigned to votes ‐7 786 – – – ‐7 786
Contingency reserve 5 000 – – – 5 000
Total 1 536 724 ‐100 885 145 000 ‐8 109 1 572 731
1. Includes the provincial equitable share that funds a range of functions including health and basic education
2. Includes Department of Women, Youth and Persons with Disabilities
Source: National Treasury
Spending was adjusted by removing funds underspent due to delays caused by the lockdown from
the baselines of affected departments; suspending allocations for capital and other departmental
projects that could be delayed or rescheduled to 2021/22 or later; suspending allocations to
programmes with a history of poor performance and/or slow spending and redirecting funds towards
the COVID‐19 response within functions, or towards government’s fiscal relief package.
19CONSOLIDATED BUDGET SPENDING AND
DEFICIT FOR 2020/21
Change in share of expenditure by economic Change in share of expenditure by
classification, 2020/21* function, 2020/21*
In the current year, R40 billion will be drawn down from social security funds’ cash surpluses to provide
wage support to vulnerable employees due to the pandemic.
Consolidated spending for 2020/21 has been revised from R1.95 trillion in 2020 Budget to R2.04 trillion,
mainly due to additional funding of R145 billion allocated for government’s COVID‐19 response.
The consolidated budget deficit more than doubles to a projected 15.7 per cent of GDP in 2020/21
20CONSOLIDATED BUDGET SPENDING PLANS FOR
2020/21
Share of consolidated expenditure by Share of consolidated expenditure by
economic classification, 2020/21 function, 2020/21
35 2020 Budget 2020 Supplementary Budget Review
2020 Budget 20.3
30 Learning and culture 19.0
2020 Supplementary Budget Review Social development 15.8
25 18.4
Health 11.8
12.1
Per cent
20 11.7
Debt‐service costs 11.6
15 Peace and security 11.1
10.9
Community development 10.9
10 10.4
Economic development 10.8
10.5
5 7.3
General public services 6.9
0
Transfer Compensation Goods and Debt‐service Payments for 0 4 8 12 16 20
payments of employees services cost capital assets Per cent
The allocations increase spending on transfers to almost 35 per cent of total expenditure, while the
share of all other components declines.
Debt‐service costs are now the fourth‐largest spending item, similar in size to what government spends
on health services.
21CHANGES TO THE DIVISION OF REVENUE
Table 2.9 Division of revenue framework
2019/20 2020/21
R billion Revised Budget 2020 Revised % change
Division of available funds
1
National departments 749.4 757.7 790.3 4.3%
Provinces 613.1 649.3 645.3 ‐0.6%
Equitable share 505.6 538.5 538.5 –
Conditional grants 107.6 110.8 106.8 ‐3.6%
Local government 123.3 132.5 139.9 5.6%
Equitable share 65.6 74.7 85.7 14.7%
Conditional grants 44.5 43.8 40.2 ‐8.2%
General fuel levy 13.2 14.0 14.0 –
sharing with metros
Provisional allocation – ‐7.8 ‐7.8 –
2
not assigned to votes
Contingency reserve – 5.0 5.0 –
Non‐interest expenditure 1 485.8 1 536.7 1 572.7 2.3%
Debt‐service costs 204.8 229.3 236.4 3.1%
Main budget expenditure 1 690.6 1 766.0 1 809.2 2.4%
Percentage shares
National departments 50.4% 49.2% 50.1%
Provinces 41.3% 42.2% 41.0%
Local government 8.3% 8.6% 8.9%
1. Includes provisional allocation for the COVID‐19 relief package
2. Includes proposed compensation reductions, support to Eskom, amounts for Budget Facility for Infrastructure
projects and other provisional allocations
Source: National Treasury
22AN ACTIVE, INTEGRATED APPROACH TO THE
ECONOMY AND FISCUS NEEDED
Need active set of fiscal and economic reforms to raise confidence and growth
Fiscal restraint mitigates borrowing cost increases, raises confidence
SOC reform allows network industry reform, raises competition and lowers cost of living and doing
business
Economic reforms need to support investment and employment, raise productivity and
competitiveness, and lower cost of living and doing business
Economic reforms take time to impact on growth outlook – hence the need to implement now
Government envisages reforms to finalise electricity determinations, unbundling Eskom and other
steps to open up energy markets, modernise ports and rail infrastructure, and license spectrum
Reforms captured in Economic Transformation, Inclusive Growth, and Competitiveness: Towards
an Economic Strategy for South Africa also included supporting labour intensive sectors, regional
trade, SME finance
Additional reforms to support increased savings, investment and employment will be required to
help speed the recovery from the COVID‐19 shock
23MEDIUM‐TERM FISCAL POSITION
Beyond 2020/21, government has considered two scenarios:
A passive approach, in which South Africa continues on its current trajectory and debt
spirals out of control; and
An active scenario, in which major reforms and fiscal consolidation are implemented rapidly
to stabilise debt in 2023/24.
Cabinet has adopted the active approach. It has endorsed the target of a primary surplus by
2023/24, meaning revenue will exceed non‐interest expenditure.
This will require spending reductions and revenue adjustments amounting to approximately
R250 billion over the next two years. Specifically, the active scenario assumes:
Tax increases of R5 billion in 2021/22, R10 billion in 2022/23, R10 billion in 2023/24 and
R15 billion in 2024/25.
Spending reductions amounting to about R230 billion are required in 2021/22 and
2022/23, followed by further reductions in 2023/24.
These measures require difficult choices that will affect the economy and distribution of public
resources. The 2020 MTBPS will set out these proposals in detail.
These measures are in addition to proposed medium‐term reductions of R160.2 billion to the
public‐service wage bill set out in the 2020 Budget, which are yet to be finalised.
To promote fiscal consolidation, preparation of the 2021 MTEF will be informed by the results of
forthcoming public expenditure reviews. Government’s consultations on the MTEF will also be
guided by the principles of zero‐based budgeting.
24ACTIVE SCENARIO FISCAL POSITION
Table 4.1 Active scenario medium‐term budget balances
2020/21 2021/22 2022/23
R billion/percentage of GDP Revised Medium‐term estimates
Main budget revenue 1 099.5 1 268.2 1 378.8
22.6% 23.8% 24.5%
Main budget expenditure 1 809.2 1 763.8 1 809.3
37.2% 33.1% 32.2%
Non‐interest expenditure 1 572.7 1 500.6 1 508.2
32.4% 28.2% 26.8%
Debt‐service costs 236.4 263.1 301.1
4.9% 4.9% 5.4%
Main budget balance ‐709.7 ‐495.6 ‐430.5
‐14.6% ‐9.3% ‐7.7%
Primary balance ‐473.2 ‐232.4 ‐129.5
‐9.7% ‐4.4% ‐2.3%
Source: National Treasury
The main budget balance and the primary balance will narrow over the medium term in
order to stabilise debt in 2023/24
25CONSOLIDATED BUDGET BALANCES
Table 4.2 Consolidated budget balances
R billion 2019/20 2020/21 2021/22 2022/23
Main budget ‐345.3 ‐709.7 ‐495.6 ‐430.5
Social security funds ‐3.3 ‐49.1 ‐1.0 ‐2.4
Provinces 5.5 ‐2.6 0.6 1.9
Public entities 13.4 ‐0.3 5.5 9.5
1 ‐0.6 ‐0.1 ‐0.1 ‐0.0
RDP Fund
Consolidated budget balance ‐330.3 ‐761.7 ‐490.6 ‐421.5
1. Reconstruction and Development Programme Fund
Source: National Treasury
In 2020/21 the consolidated budget deficit will be revised from 6.8 per cent of GDP
projected in the 2020 Budget to 15.7 per cent of GDP
Public entities, social security funds and provinces are projected to have a combined cash
surplus in both 2021/22 and 2022/23.
26DEBT OUTLOOK SCENARIOS
140.7
140 134.8
Active scenario Passive scenario
130 128.4
121.7
120
114.1
110
Per cent of GDP
106.1
97.2
100
89.9
90
86.0 87.4 86.8 84.8
80 81.8 82.0 81.8
77.9
70 73.5
63.5
60 53.0
56.6
50.5
50
2016/17
2017/18
2018/19
2019/20
2020/21
2021/22
2022/23
2023/24
2024/25
2025/26
2026/27
2027/28
2028/29
In the active scenario, debt stabilises at 87.4 per cent of GDP in 2023/24
27FINANCING THE GROSS BORROWING
REQUIREMENT
Since February 2020, the gross borrowing requirement for 2020/21 has increased by
R344.2 billion to R776.9 billion. Government has revised its financing strategy to
minimise the effect of this deteriorating financial position on its stock of debt and on
debt‐service costs.
The domestic capital market is under pressure. To moderate its domestic borrowing,
government will draw down sterilisation deposits. It will also source funding from
international finance institutions
Existing foreign cash deposits will be used to finance foreign currency commitments.
The proceeds from international loans will be converted into rands to partially finance
domestic commitments.
Table 4.3 National government gross borrowing requirement and financing
2019/20 2020/21 2021/22 2022/23
R billion Preliminary Budget Revised Medium‐term estimates
Gross borrowing
Main budget balance ‐345.3 ‐368.0 ‐709.7 ‐495.6 ‐430.5
Redemptions ‐70.7 ‐64.7 ‐67.2 ‐64.9 ‐150.0
Domestic long‐term loans ‐19.4 ‐52.5 ‐52.5 ‐60.5 ‐134.2
Foreign loans ‐51.2 ‐12.2 ‐14.7 ‐4.4 ‐15.8
Total ‐416.0 ‐432.7 ‐776.9 ‐560.5 ‐580.5
Financing
Domestic short‐term loans (net) 36.1 48.0 146.0 56.0 64.0
Domestic long‐term loans 305.4 337.7 462.5 388.4 451.4
Foreign loans 76.1 29.3 125.2 31.9 63.2
1 ‐1.6 17.7 43.2 84.2 1.9
Change in cash and other balances
Total 416.0 432.7 776.9 560.5 580.5
1. A positive value indicates that cash is used to finance part of the borrowing requirement
Source: National Treasury 28STATE‐OWNED COMPANIES
The financial performance of state‐owned companies, which has placed considerable
pressure on the public finances for several years, is likely to deteriorate in 2020/21.
The pandemic and associated economic restrictions are expected to reduce revenues
for entities such as the Airports Company South Africa, Eskom and the South African
National Roads Agency Limited.
Global market volatility may further limit the ability of state‐owned companies to
borrow in capital markets and service their debt obligations.
The COVID‐19 pandemic underlines the urgent need for broad‐based reforms at state‐
owned companies so that they can become efficient and financially sustainable.
These reforms include rationalisation (reducing the number of and merging some state‐
owned companies, and incorporating certain functions into government), equity
partnerships, and stronger policy certainty and implementation.
Planned transfers from the fiscus will be strictly conditional on improving their balance
sheets.
The special adjustments budget includes an additional allocation of R3 billion to
recapitalise the Land Bank in the current year
No other in‐year spending adjustments are proposed for state‐owned companies.
29THANK YOU
30You can also read