BUILDING BLOCKS OF ELECTRIC VEHICLE DEPLOYMENT A GUIDE FOR DEVELOPING COUNTRIES - May 2021 - NREL
←
→
Page content transcription
If your browser does not render page correctly, please read the page content below
BUILDING BLOCKS OF ELECTRIC
VEHICLE DEPLOYMENT
A GUIDE FOR DEVELOPING
COUNTRIES
                                 May 2021

                   www.nrel.gov/usaid-partnership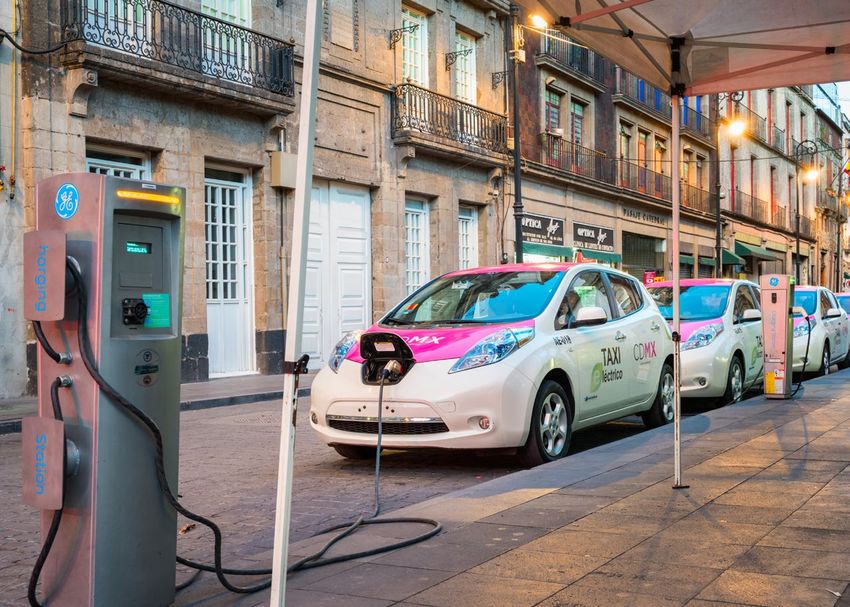
BUILDING BLOCKS OF ELECTRIC
VEHICLE DEPLOYMENT
A GUIDE FOR DEVELOPING
COUNTRIES
Authors
Alexandra Aznar, Scott Belding, Kaylyn Bopp, Kamyria Coney, Caley Johnson, Owen Zinaman
National Renewable Energy Laboratory

May 2021

A product of the USAID-NREL Partnership
Contract No. IAG-17-2050

                                                                www.nrel.gov/usaid-partnership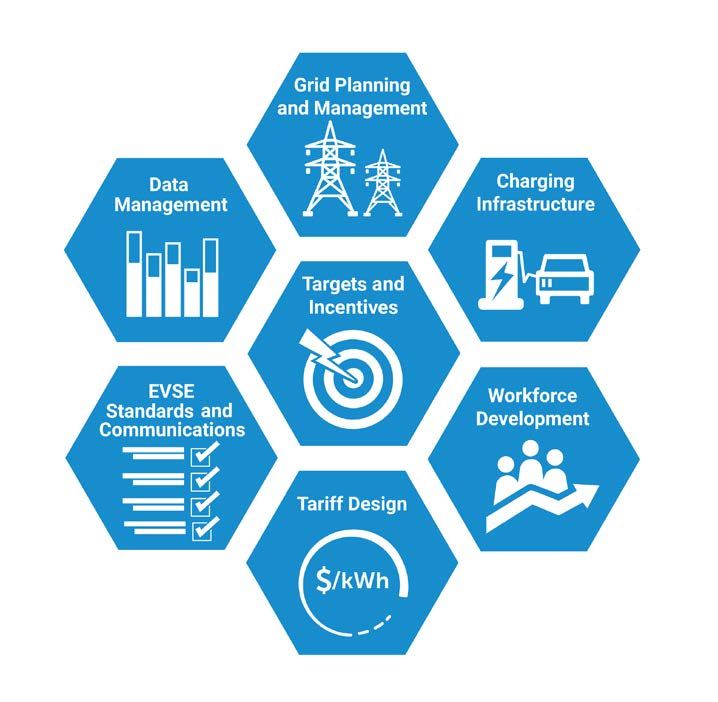
Prepared by
NOTICE
This work was authored, in part, by the National Renewable Energy
Laboratory (NREL), operated by Alliance for Sustainable Energy, LLC, for the
U.S. Department of Energy (DOE) under Contract No. DE-AC36-08GO28308.
Funding provided by the United States Agency for International Development
(USAID) under Contract No. IAG-17-2050. The views expressed in this report
do not necessarily represent the views of the DOE or the U.S. Government,
or any agency thereof, including USAID.
This report is available at no cost from the National Renewable Energy
Laboratory (NREL) at www.nrel.gov/publications.
U.S. Department of Energy (DOE) reports produced after 1991 and a growing
number of pre-1991 documents are available free via www.OSTI.gov.
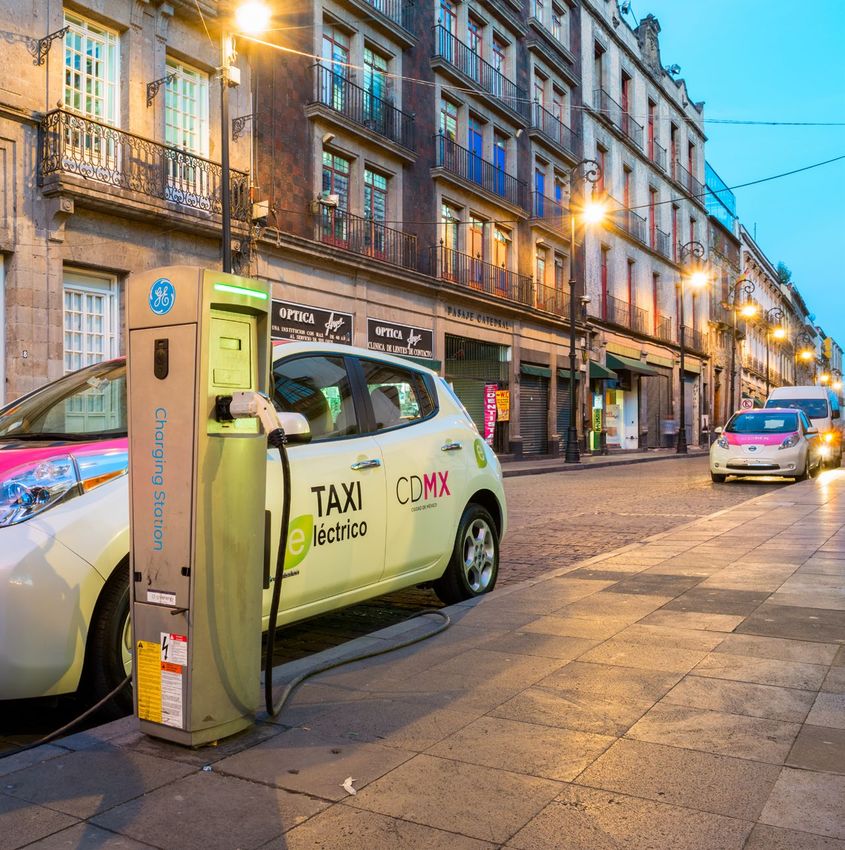
Front cover: photo from iStock 506609532; Back cover: photo from iStock 506611252
NREL prints on paper that contains recycled content.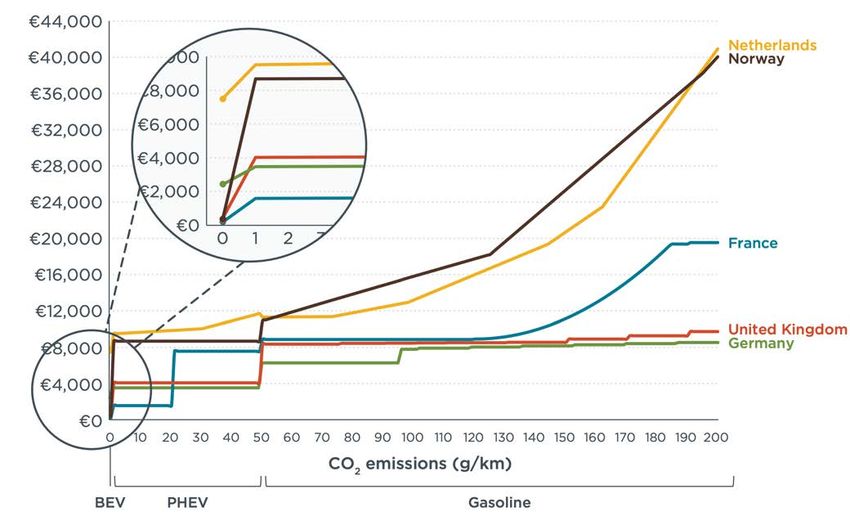
Acknowledgments
The authors thank Sarah Lawson and Andrew Fang from the U.S. Agency for International Development
(USAID) for their support of this work. We also wish to thank Garrett Fitzgerald (Smart Electric Power
Association), Karen Glitman, Tyler Petersen, Kinshuk Chatterjee, and John Gartner (Center for
Sustainable Energy), Paty Romero-Lankao, Cabell Hodge, and Abby Brown (National Renewable Energy
Laboratory), Jeff Humber and Don McCubbin (USAID) for their detailed review comments, insights, and
contributions to this report. The authors would like to thank and acknowledge Britton Marchese, Isabel
McCan, Chris Schwing, and Liz Breazeale for their design and editorial support.

                                                                                                     i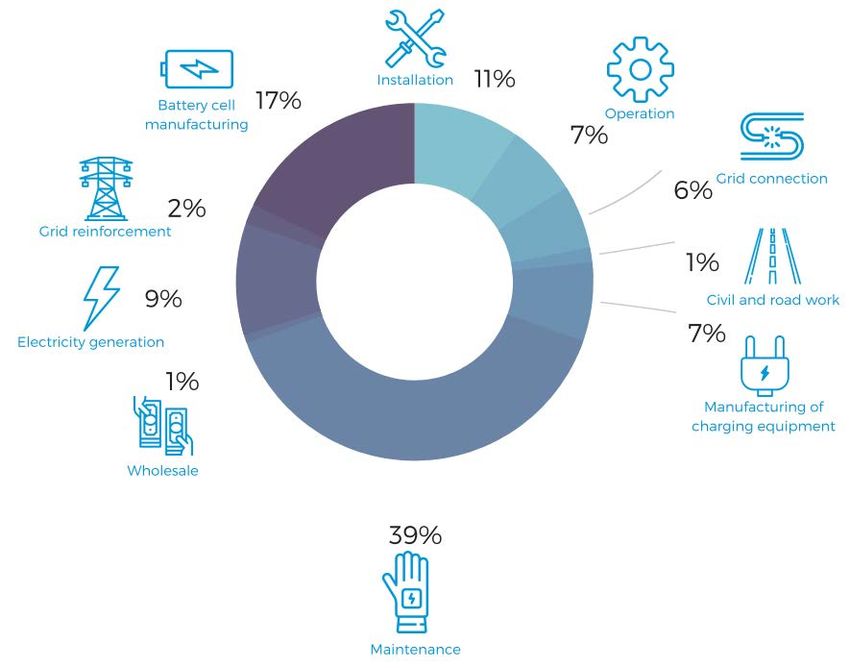
List of Acronyms
BEV                battery electric vehicle
DCFC               DC fast charging
EU                 European Union
EV                 electric vehicle
EVSE               electric vehicle supply equipment
GDP                gross domestic product
GHG                greenhouse gas
IC-CPD             in-cable control and protection device
ICE                internal combustion engine
IEC                International Electrotechnical Commission
NREL               National Renewable Energy Laboratory
PHEV               plug-in hybrid electric vehicle
TOU                time of use
USAID              U.S. Agency for International Development
V2G                vehicle-to-grid
VKT                vehicle-kilometers traveled
ZEV                zero-emission vehicle

                                                               ii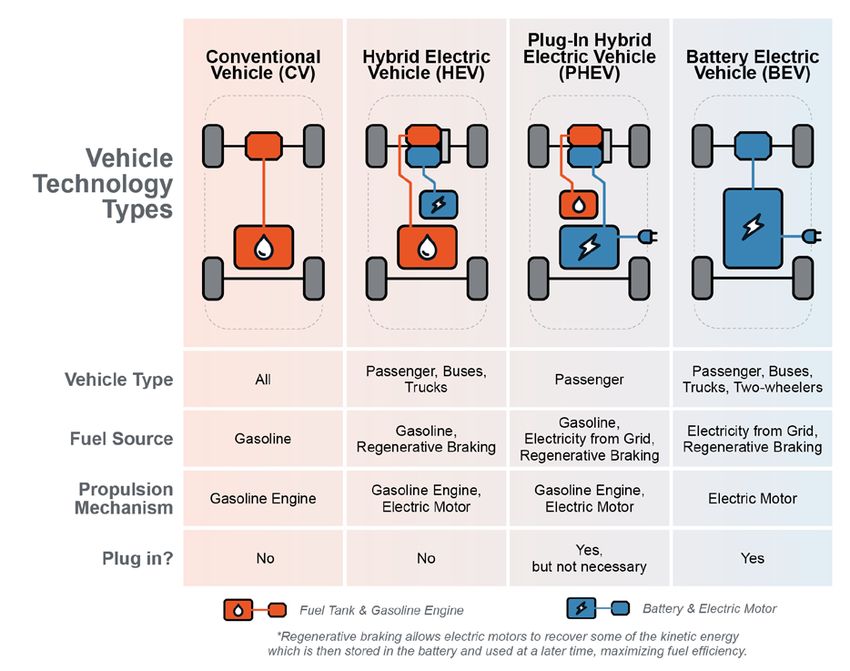
Executive Summary
Historically, the transportation sector has been powered overwhelmingly by petroleum-based products,
but momentum for electric vehicles (EVs) is growing. Global auto manufacturers are pivoting away from
traditional internal combustion vehicles, and the private sector, public sector, investors, and utilities are
investing heavily in vehicle electrification. At the same time, national and subnational governments are
pledging support for EV deployment and charging infrastructure investments and phasing in bans on new
gasoline and diesel vehicles. Plummeting lithium-ion battery prices over the past decade have enabled EV
market expansion, and battery costs are projected to continue falling. Auto manufacturers are increasing
EV model availability to meet customer demand. Decarbonization of the power sector reduces the carbon
and environmental impacts of EVs as they age. In other words, a confluence of factors is accelerating EV
deployment worldwide, which amounts to a radical shift in the transportation sector, with significant
implications for the power sector, transportation, and the environment.

This transformation does not happen on its own. Significant investment by numerous parties is needed to
purchase EVs and to build out charging infrastructure. Political leadership plays an important role in
launching any emerging technology, particularly one as disruptive as EVs. Utilities must adapt to and
potentially flourish with the increased and altered electricity demand, while consumers need support in
numerous forms to deploy EVs.

EVs can offer a myriad of benefits for customers and society. Yet limited experience in developing
countries leave decision-makers grappling with how to most effectively direct resources and time to
support EV deployment. Decision-makers in developing countries may be interested in learning about
global best practices from other geographies. There are useful lessons that can be learned from successes
and failures of countries in diverse geographies around the world.

This report lays out a framework for policymakers, regulators, and other decision-makers in developing
countries for how to plan, implement, and scale EV deployment in their jurisdictions. The “building
blocks” of EV deployment address technical, institutional, or economic topics that together underpin a
safe, sustainable, and efficient transition to an electrified transport sector (Figure ES- 1). They include:

•   Targets and Incentives for EV and EV Supply Equipment (EVSE) Deployment
    o   A number of complementary policy options need to be implemented in order to catalyze a robust
        EV market.
•   Data Management for EV Deployment
    o   Data curation and management helps identify the potential benefits of vehicle electrification and
        enables well-designed strategies to scale EV deployment in a targeted manner.
•   Establishing a Network of Charging Infrastructure
    o   EV market development hinges on the availability of charging infrastructure—a key requirement
        that can be met in a variety of ways. Different locations, charging needs, and equipment can lead
        to a variety of EVSE ownership and investment models that require a balance of public and
        private sector resources.
•   EVSE Standards and Communications Protocols
    o   Establishing and enforcing a regulatory framework of charging standards, equipment
        certification, and building codes creates a compatible, reliable, and safe operating environment
        for EVs.
•   Grid Planning and Management

                                                                                                               iii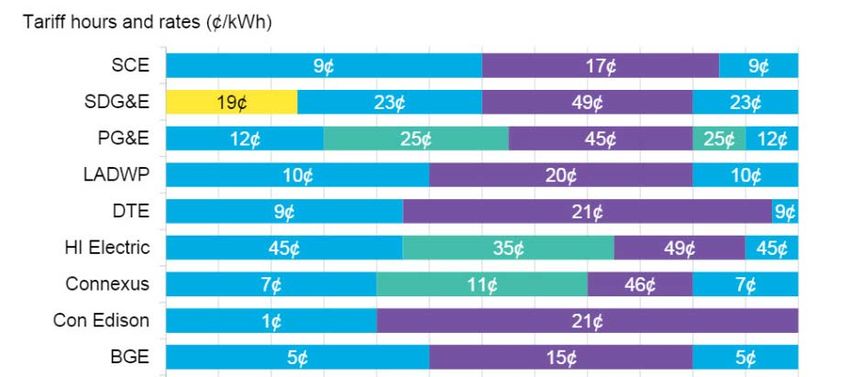
o   New EV loads on the electric grid present both challenges and opportunities. Long-term
        preparation and planning by utilities can ensure timely and cost-effective deployment of EVSE
        networks.
•   Electricity Tariff Design
    o   Electricity tariffs specify how electricity consumers are charged for electricity (i.e., the fuel of
        EVs). Smart tariff design for EV charging can support utility cost recovery associated with
        hosting EVSE and can influence customer charging behavior to the benefit of the grid.
•   Workforce Development Strategies
    o   EV deployment may create new jobs across multiple sectors, but workforce development
        strategies are required to lay the groundwork for thriving EV markets.
Each building block is explored in turn, providing decision-makers with a holistic, high-level
understanding of and approach to EV deployment in developing countries.

                          Figure ES- 1. The building blocks of EV deployment

                                                                                                               iv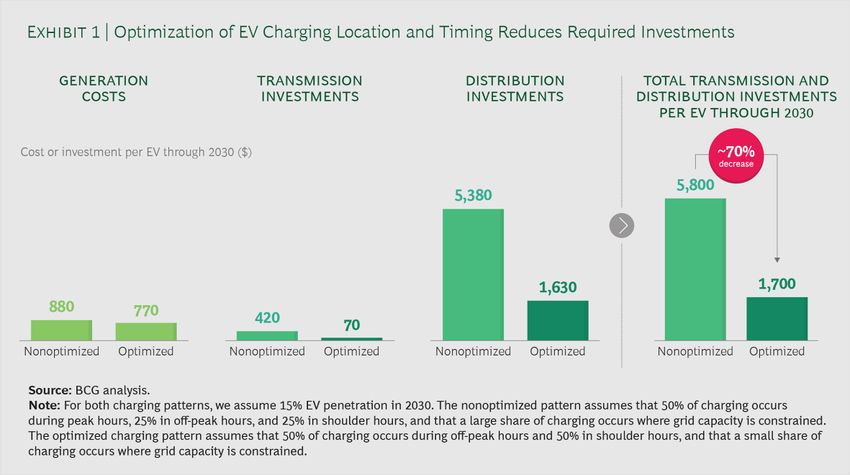
Table of Contents
Introduction ...................................................................................................................................................... 1
EV Basics ........................................................................................................................................................... 2
Building Blocks of EV Deployment ................................................................................................................. 7
1 Targets and Incentives for EV and EVSE Deployment ......................................................................... 7
2 Data Collection and Management for EV Deployment ........................................................................ 16
3 Establishing a Network of Charging Infrastructure ............................................................................ 24
4 EVSE Standards and Communications Protocols ................................................................................ 30
5 Grid Planning and Management ............................................................................................................ 37
6 Tariff Design ............................................................................................................................................ 40
7 Workforce Development ......................................................................................................................... 48
Conclusion ....................................................................................................................................................... 52
References ....................................................................................................................................................... 54

                                                                                                                                                                          v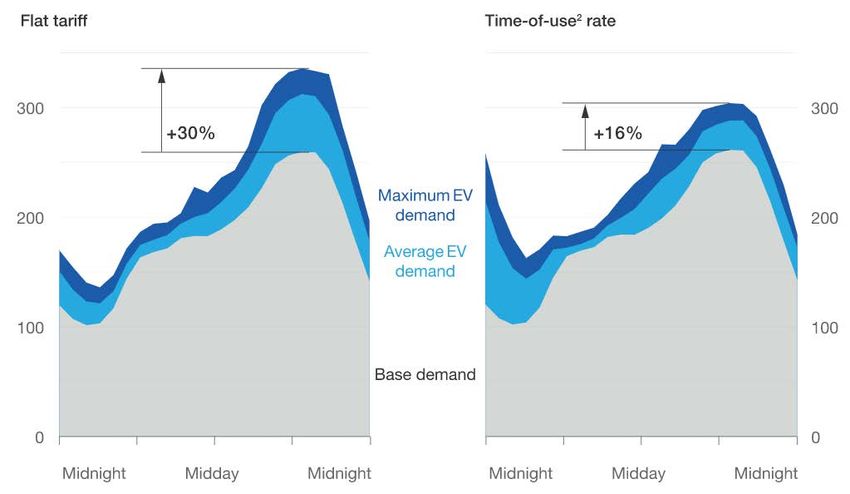
List of Figures
Figure ES- 1. The building blocks of EV deployment ................................................................................. iv
Figure 1. EV technology types...................................................................................................................... 3
Figure 2. Passenger electric car sales and market share in selected countries, 2013–2019 .......................... 4
Figure 3. Illustrative examples of how jurisdictional goals may influence the EV application pursued ...... 5
Figure 4. Categories of EV and EVSE policy approaches ............................................................................ 7
Figure 5. Vehicle tax costs of 4 years for privately owned vehicles based on CO2 emissions and vehicle
              type ......................................................................................................................................... 12
Figure 6. Correlation between energy use per capita in private passenger travel and urban density in
              global cities (R2=0.86)........................................................................................................... 18
Figure 7. Delivery truck drive cycle data obtained from geolocating devices and stored in Fleet DNA ... 20
Figure 8. GHG emissions of various vehicles in Mexicali, Mexico, as they increase renewables, given
              their starting grid mix of 70% natural gas, 2.5% diesel, and 28% renewable ........................ 21
Figure 9. Diagram of EVSE and EV charging components........................................................................ 30
Figure 10. Framework of charging requirements........................................................................................ 31
Figure 11. Enforcement of regulatory framework ...................................................................................... 32
Figure 12. AC and DC charging standards ................................................................................................. 33
Figure 13. Four modes of EVSE charging per IEC standard ...................................................................... 35
Figure 14. Interoperability protocols Illustration by Kaylyn Bopp. Adapted from (MJB&A 2019). ........ 36
Figure 15. Potential cost savings of grid investments due to optimized EV charge timing........................ 38
Figure 16. Typical tariff design components .............................................................................................. 40
Figure 17. Utility load with EV charging before and after implementation of TOU energy charges ......... 43
Figure 18. Examples of TOU EV energy charge at select U.S. utilities ..................................................... 44
Figure 19. Maturity of EVSE market and use of energy vs. demand charges ............................................ 45
Figure 20. Anticipated types of jobs in “electromobility value chain” ....................................................... 51

List of Tables
Table 1. Benefits and Barriers to EV Deployment ....................................................................................... 3
Table 2. Summary of EV and EVSE Targets and Subsidies in Select Countries ......................................... 8
Table 3. Key ZEV Mandate Differences Between California, China, and EU ........................................... 14
Table 4. Summary of Key Transportation Data Valuable for Electrification Efforts ................................. 22
Table 5. Summary of Common Charging Infrastructure Characteristics by Location ............................... 25
Table 6. List of Commonly Used Charging Connectors From IEC 62196 ................................................. 34
Table 7. Comparison of Cost Implications for Low and High Utilization Rate 50-kW DCFC Subject to
              Demand Charge in a Billing Cycle ........................................................................................ 45
Table 8. EV and EVSE Workforce Needs and Considerations .................................................................. 49
Table 9. Additional Resources .................................................................................................................... 53

                                                                                                                                                             vi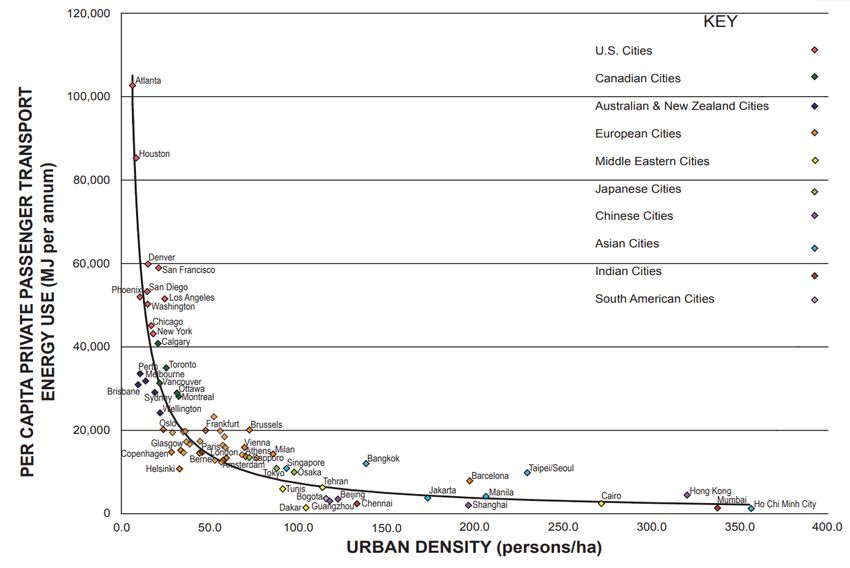
Introduction
Electrifying vehicles can help countries reach decarbonization and mobility objectives
for the transport sector.
Countries can use electric transportation to help fulfill numerous goals, including greenhouse gas (GHG)
emissions targets, local air quality goals, mobility objectives, energy security, and transportation resiliency.
Vehicle electrification is a promising pathway to achieving clean energy transitions in the transport sector at scale.
As vehicles electrify, the traditionally siloed electricity and transport sectors increasingly converge to create
technical, institutional, and economic opportunities and challenges. To navigate this transition effectively, we
propose the following foundational pillars or “building blocks” that undergird effective electric vehicle (EV)
deployment. Jurisdictions with experience and mature EV markets offer useful lessons learned that may enable
developing countries to leapfrog over common roadblocks. Nonetheless, developing countries face distinct
challenges collectively, and individually, from developed countries that require careful consideration.

From our work around the world, the U.S. Agency for International Development (USAID) and National
Renewable Energy Laboratory (NREL) have witnessed interest growing in EVs for a variety of reasons. Lao
People’s Democratic Republic (PDR), for example, looks toward EVs as a way to use their surplus of hydropower
to displace expensive oil. Thailand and Pakistan seek economic development opportunities in EV manufacturing.
Cities including Mexico City, Surat, India, and Kingston, Jamaica see the potential of bus electrification to
improve local air quality and reduce traffic congestion. Many USAID partner countries in Southeast Asia are
trying to understand how to reach ambitious EV deployment targets and implement EV and transportation plans.
This pursuit is prompting questions about EV supply equipment (EVSE) standards, tariff design, and business
models that affirm the importance of the building blocks outlined in this report.

Effective EV deployment is aided by key building blocks.
This report presents a series of building blocks for vehicle electrification. These building blocks can be
understood as the key components of a broader framework for policymakers, regulators, and other decision-
makers to use as they plan, implement, and scale EV deployment in their jurisdictions. Each building block
addresses a particular technical, institutional, or economic topic that implicates certain stakeholders across the
power and transport sectors. Pursued together, they can help to underpin a safe, sustainable, and efficient
transition to an electrified transport sector. While this report segments key issues into distinct building blocks to
enhance reader understanding, in reality, these EV building blocks are closely integrated, and design decisions on
a single aspect often have broader implications. Furthermore, the building blocks presented in this report are not
intended to be pursued sequentially. Rather, effective EV deployment requires different decision-makers and
agencies—such as environment, transportation, and energy ministries, local transit authorities, utilities, land use
planners, code and standard officials, consumer advocates, and the private sector (e.g., vehicle dealerships,
charging network companies)—to work in parallel on different issues while taking into account unique
socioeconomic and institutional realities that vary by jurisdiction. There are also significant risks to prioritizing
some building blocks over others (e.g., lack of engagement from key actors). The building blocks of vehicle
electrification reflect this nonlinear, iterative, intersectional dynamic.

This report is intended to inform policymakers and regulators in developing countries with an interest in
electrifying transport. It lays out a framework for policymakers, regulators, and other decision-makers for how to
plan, implement, and scale EV deployment in their jurisdictions. It does not present a detailed and comprehensive
analysis or literature review of each topic, although it does connect the reader to resources for additional
information. Instead, this report presents a holistic and actionable framework for decision-makers to understand
where to begin and how to proceed in achieving their EV deployment objectives, outlining the key considerations
and dimensions of each building block. Where possible, this report explores examples from developing countries,
and where those do not exist, it highlights relevant examples from developed countries. After a brief background
section on EV technology, this report explores the seven building blocks for vehicle electrification, including:

•   Targets and Incentives for EV and EVSE Deployment
•   Data Management for EV Deployment
•   Establishing a Network of Charging Infrastructure
•      EVSE Standards and Communications Protocols
•      Grid Planning and Management
•      Electricity Tariff Design
•      Workforce Development Strategies.

EV Basics
EVs come in several forms and offer energy, performance, and environmental benefits,
but barriers to deployment remain.
EVs take many forms (e.g., passenger vehicles, truck, buses, and two-wheelers) and use different technologies
(e.g., hybrid electric, plug-in hybrid electric, battery electric). Figure 1 captures the spectrum of EV types.

Compared to conventional vehicles that use internal combustion engines (ICEs), EVs offer several benefits. They
are more efficient 1 and emit fewer GHGs and air pollutants. With better low-end torque for acceleration, heavy
loads, and hill climbs, EVs have superior (and quieter) performance. Because of their simpler mechanics and
greater efficiency, fuel and maintenance costs are lower than conventional ICE vehicles. Nonetheless, EVs face
numerous barriers to deployment in most markets today. First and foremost, without significant incentives, EVs
currently have higher upfront costs compared to ICEs. As well, the EV market currently lacks the typical vehicle
options that customers may be used to. Furthermore, consumers do not in general have a high degree of
familiarity with EVs. Additionally, the way EVs charge differs from the way ICE vehicles are refueled—in some
cases charging can be more convenient (e.g., charging at home does not require a dedicated trip), but in other
cases charging can be less convenient because the speed of refueling EVs typically takes longer than ICE
vehicles. Moreover, the ranges of EVs are sensitive to temperature and usage patterns, so charging needs may
differ across geographies and climates. Table 1 summarizes some of these common benefits and barriers to EV
deployment.

1
    On an energy basis (i.e., per unit input of energy).
                                                                                                                   2
Figure 1. EV technology types
Source:(NREL 2020)
Table 1. Benefits and Barriers to EV Deployment
Benefits of EVs Barriers to EV Deployment
• 3–4 times more efficient per unit of input • Higher upfront costs (before incentives)
energy • Reduced range and charging convenience
• Lower fuel and maintenance costs • Range sensitivity to temperature and
• Reduced or displaced criteria air pollutant usage patterns
and CO2 emissions • Lower vehicle variety
• Better low-end torque for acceleration, • Consumers unfamiliar with technology.
heavy loads, and hill climbs
• Quiet operation.
Globally, deployment of EVs is accelerating, but they still represent a small fraction of vehicle sales in most
countries (with the exception of Norway 2; see Figure 2). To date, the majority of EVs have been deployed in
China (IEA 2020b).
2
EV sales represent 56% of total vehicle sales in Norway as of 2019 (IEA 2020b).
3New electric car sales (thousands)
1 500 6%
Dark shade: BEVs
1 250 5%
Electric car market share
Light shade: PHEVs
1 000 Market share of new 4%
electric cars
750 3%
500 2%
250 1%
0 0%
2013
2019
2013
2019
China United States Europe Other
2013
2019
2013
2019
120 20%
57%
56%
55%
18%
100 16%
Electric car market share
80 14%
12%
60 10%
8%
40 6%
20 4%
2%
0 0%
2013
2019
2013
2019
2013
2019
2013
2019
2013
2019
2013
2019
2013
2019
2013
2019
2013
2019
Japan Germany United France Canada Korea Netherlands Sweden Norway
Kingdom
Figure 2. Passenger electric car sales and market share in selected countries, 2013–2019
Source: (IEA 2020b)
EVs offer benefits for consumers and society, but their ascendance is not guaranteed. Policymakers, regulators,
and other decision-makers can unlock their potential through strategic and holistic planning, preparation, and
execution. This report aims to inspire ideas and guide next steps for decision-makers to accelerate EV market
development.
Some preconditions make a transition to EVs easier to achieve.
There are several starting conditions that a jurisdiction may have that will aid in the development of EV markets.
These include:
1. Existing government goals, targets, and objectives that can be achieved through EV deployment.
These might include local emissions reduction, GHG reductions, petroleum usage and/or import
reduction, energy security, reduction in vehicle kilometers traveled, encouraging access to mobility,
resilience to natural disasters, and reducing the total cost of ownership for vehicle consumers. 3 These
goals may motivate stakeholders to pursue EVs as a potential means of achievement. Jurisdictional and
stakeholder goals and local conditions/opportunities inform: (1) the types of EVs that might be
prioritized, and (2) the approaches that may be appropriate to develop markets for those vehicle types.
Figure 3 illustrates which vehicle types tend to be most effective at delivering the benefits for various
goals. For example, if policymakers want to improve urban air quality, that goal might best be achieved
through prioritizing electrification of buses (which operate disproportionately in urban centers) and
motorcycles (which often lack emissions control devices and therefore pollute more than light-duty
vehicles). Or, if policymakers want to expand mobility access, they may focus on electrifying
technologies or services with lower price points, such as micro-transit or buses, rather than higher-cost,
privately owned light-duty vehicles.
3
Oftentimes, these goals overlap.
4Figure 3. Illustrative examples of how jurisdictional goals may influence the EV application pursued
2. Types of existing mobility applications. Electric mobility can have numerous applications, including
fleets (e.g., mass transit, taxis, delivery trucks), personal vehicles (e.g., cars, motorcycles), ridesharing
vehicles (i.e., shared mobility), and off-road vehicles (e.g., at airports, ports, other unique places and
applications). Assessing the applications of transportation at play in a given jurisdiction informs
opportunities for vehicle electrification. For example, a city with high transit bus use may be a good
candidate for bus electrification over other EV applications. Developing countries often have different
vehicle needs (e.g., two-and-three wheelers) and much lower levels of vehicle ownership and government
transportation budgets than developed countries, influencing the type of mobility application or vehicle
that will lead the EV market in these countries.
3. Local EV “champions” who wish to accelerate EV adoption. Such champions often include fleet
managers, vehicle dealerships, charging network owners, vehicle manufacturers, and electric utilities. All
of these entities can view EVs as a way to decrease costs, increase their market share, and/or expand their
revenue streams. Other powerful champions include groups that see EVs as a way to achieve their
environmental, economic, or mobility-related goals, including civil society organizations, energy
ministries, and regulators.
4. The nature of existing transportation system. Vehicle electrification is constrained by characteristics of
land use and the built environment. Clear land-use regulations determine how urban spaces are ordered
and served by different transport modes (e.g., micro-mobility, public transport, freight), foundational
knowledge upon which to build vehicle electrification strategies. In many developing countries,
5uncoordinated urban growth has led to expansive and fragmented urban spaces that affect travel distances
and times, realities that influence how decision-makers consider the possibilities and priorities for vehicle
electrification. Certain characteristics of the built transportation environment lend themselves to lower-
cost and more convenient opportunities to incentivize EVs beyond fleet applications. First and foremost,
locations suitable for convenient charging vary by jurisdiction. To date, experience in the developed
world suggests that most light-duty EV owners in established markets prefer to charge at home (EERE
2021), so countries where single-family homes and residential garages are present may be primed to adopt
light-duty vehicles more quickly. Countries or cities with more multifamily dwellings and fewer garages
will need to rely more heavily on shared charging infrastructure. Workplace charging can be just as
convenient to commuters, so countries where commercial buildings with large parking lots are present
can also be viewed as a desirable starting condition for EV market development. Home charging and (to a
lesser extent) workplace charging require less expensive equipment than public fast charging and allow
for more flexibility to enable charge timing that is more compatible with the power system’s load. In a
different vein, parking availability and cost—often controlled by local governments—is a valuable asset
that can be leveraged to incentivize EVs. Locations with difficult parking can provide a huge EV
purchase incentive for a relatively low cost by installing EVSE in locations that are difficult to park in,
and only allowing EVs to park in the area by the EVSE. Similarly, the presence of pay-for-access (i.e.,
toll) roads or driving (e.g., high-occupancy vehicle) lanes represent another opportunity for local
governments to offer highly valued incentives for a relatively low cost because waiving toll fees has been
found to be a particularly powerful way to incentivize individuals to purchase EVs (Narassimhan and
Johnson 2018). Finally, an import tariff or vehicle registration tax scheme that can be adjusted to make
EVs less expensive can be a valuable prerequisite to EV market development.
Box 1. EV Deployment Strategies in Mexico
Mexico’s federal government, as well as the capital, Mexico City, has developed EV incentives grounded in the
realities of the existing transportation and built environment. For example, Mexico’s federal income tax law exempts
EVs and hybrids from sales or import fees (Secretária de Hacienda y Credito Público 2014). Mexico City is spurring
EV market growth with a multipronged approach, including: (1) exclusion of EVs and hybrids from vehicle
verification proceedings (i.e., these vehicles can circulate daily), (2) EcoTag program that permits EVs to use urban
toll roads (at lower cost), (3) preferential parking, and (4) exemptions to the requirement for public and private
transit operators to renew their fleet every decade if they operate EVs (Jose Antonio Tellez Martine and Vazquez
2018; Aleatica 2017). For additional details on EV incentives, see Targets and Incentives for EV and EVSE
Deployment.
There is no “one-size-fits-all” solution set for transportation electrification, but the preconditions outlined
previously may shape the EV applications and approaches a jurisdiction takes and facilitate smoother and faster
EV market development.
6Building Blocks of EV Deployment
1 Targets and Incentives for EV and EVSE Deployment
There are a variety of targets and incentives that can be considered to accelerate EV
market development.
There are several categories of policies to support adoption of EVs and deployment of charging infrastructure.
The type of benefits a government seeks from EV deployment and its existing EV goals, targets, and objectives
(see Introduction) influence the prioritization and selection of policies, targets, and incentives. Policy approaches
can also address equity concerns related to EV deployment in two main ways: (1) expanding access to EVs and
EVSE, and (2) allocating the costs of EV and EVSE incentives fairly so as to not disproportionally burden low-
income or otherwise marginalized groups (see Tariff Design). Policy approaches for EV and EVSE deployment
alone do not guarantee an EV market; they are strengthened by the presence of other EV building blocks. Key
policy approaches include:
EV and EVSE Targets: EV deployment targets set a vision and concrete objective for EV market development
in a given jurisdiction (Cui, Hall, and Lutsey 2020). EV targets can be understood as a policy goal, rather than a
specific policy instrument. Though not a prerequisite for market development, EV targets can offer a useful long-
term vision to policy and regulatory authorities, as well as industry, who are planning to take actions to increase
EV adoption. EV targets are typically specified on a sales and/or cumulative stock basis for different types of
vehicles. EVSE targets primarily focus on publicly available charging stations to incentivize EV infrastructure
readiness and meet demands of EV owners.
Purchase Incentives: Purchase incentives are a category of
policy instrument used to reduce upfront purchase costs of
EVs. They are a form of subsidy designed to increase EV
adoption. In practice, the most easily managed purchase
incentives can take the form of reduced import duties,
registration fees, or sales taxes. Other purchase incentives
include cash grants, rebates, tax incentives, and/or low-
EV Targets
interest financing. They typically feature eligibility criteria
based on aspects such as: EV technology type, cumulative
sales of specific EV models, program expenditure caps, and Vehicle
other elements. In addition, creating “soft costs” benefits (i.e., Manufactur
indirect financial or behavioral incentives) can also be an -ing
Standards/
effective tool. These include free access to toll roads, high- Mandates
occupancy vehicle lanes, and traffic-limited zones of given
cities, which can serve as an incentive for EV adoption. EVSE Financial
Fuel Taxes
Incentives
subsidies involve financial support for charging infrastructure for
and Tax
Exemptions
deployment and installment. See Table 2 for EV and EVSE EV/EVSE
targets and subsidies in select countries.
Figure 4. Categories of EV and EVSE
policy approaches
7Table 2. Summary of EV and EVSE Targets and Subsidies in Select Countries
Country EV and EVSE Targets Incentives
Chile 2019: install 150 publicly accessible charging stations EV: financing schemes for renewable taxis
2022: tenfold increase of EVs from 2017–2022 (electric and hybrid vehicles)
China 2020: 5 million EVs EV: purchase tax exemption (10%) and up to
CNY 22,500 (USD 3,200) for battery EVs
(BEVs) (300 km–400 km)
EVSE: the City of Beijing—up to CNY 200,000
(USD 28,300) per station for operators.
European 2020, 2025, and 2030: 1 charger per 10 electric cars. EV: up to EUR 7,000 (USD 7,900) for BEVs in
Union (EU) 2025: 1 million charging points and 13 million zero- and France; up to EUR 6,000 (USD 6,800) for BEVs
low-emission vehicles in Germany; BEVs are exempt from the annual
vehicle tax for 5 years in Italy.
India 2020-21: 498 publicly accessible chargers in government EV: up to INR 300,000 (USD 4,000) for plug-in
offices; 68 publicly accessible chargers across the hybrid EV (PHEV) and BEV
country; 1,500 additional publicly accessible chargers in EVSE: FAME II: INR 10 billion (USD 130 million)
and around major metro rail systems and government to deploy networks of charging stations, with
offices. incentives that range from 50%–100% of the
2030: 30% EV sales cost of a charger based on its location and
access
Japan 2030: 20%–30% sales in BEVs and PHEVs EV: Up to JPY 400,000 (USD 3,700) for BEV
2050: 100% sales of HEV, PHEV, BEV, and fuel cell (>400 km)
electric vehicles (FCEV) EVSE: provide between half to two-thirds of the
costs (depending on location and charger type).
These subsidies totaled JPY 1.1 billion (USD 10
million).
Pakistan 2030: 30% sales of EVs EVSE: lower electricity tariffs for a general sales
2040: 90% sales of EVs tax rate of 1%.
2040: one DC fast charger per 3X3 km area in all major
cities and along major motorways every 15 km.
United 2025: 3.3 million EVs in 11 states combined EV: tax credit up to USD 7,500 (PHEV and BEV)
States EVSE: up to 30% of the installation cost of new
EVSE (limited to USD 1,000) through fiscal year
2020.
See “Global Outlook EV 2020” for additional EVSE targets and subsidies (IEA 2020b).
8Box 2. National Electric Vehicle Policy Announcement in Pakistan
In November 2019, Pakistan’s Ministry of Climate Change drafted the National Electric Vehicle Policy, which
serves as an example of a robust policy approach, combining numerous EV sales targets, purchase incentives, EVSE
investments, and manufacturing standards, including:
• Target: 90% market share in passenger vehicles, heavy trucks, two- and three-wheelers, and buses by 2040, with
2030 targets of 30% for the first two groups of vehicles and 50% for the latter two
• Lower electricity tariffs for EV charging stations
• EVs taxed at 1% instead of 17%, and EV trucks exempted from registration fees.
• EV components have reduced customs duty and sales tax.
• EV manufacturing machinery has no taxes or import duties.
• Commitments to install DC fast chargers
• Reduced import duty on charging equipment
• Toll tax reduced 50%
• Low-interest financing to EV manufacturers from the State Bank of Pakistan (Uddin 2020).
When discussing the National Electric Vehicle Policy, the Adviser to Prime Minister for Commerce and Investment,
Abdul Razak Dawood, led a high-level meeting to consult stakeholders on approaches to policy implementation.
Stakeholders included the Adviser on Industries and Production, the Federal Minister for Science and Technology,
and Advisers to Prime Minister on Climate Change and Institutional Reforms and Austerity. In addition, the
Economic Coordination Committee of the Cabinet created a working group to draft incentive proposals for the
National Electric Vehicle Policy. The working group included the Minister of Planning & Development, Minister
of Science and Technology, Special Assistant to the Prime Minister (SAPM) on Austerity and Institutional
Reforms, Deputy Chairman Planning Commission, SAPM on Commerce (Chairman), SAPM on Petroleum,
Secretaries Industry and Climate Change (Kundi 2020).
See “Global Outlook EV 2020” for additional EVSE targets and subsidies (IEA 2020b).
Vehicle Manufacturing Standards/Mandates: Vehicle manufacturing standards require automotive
manufacturers to ensure the vehicles they produce meet specific requirements, including minimum fuel economy
levels and GHG emission intensity levels. These manufacturing standards typically apply to manufacturers of ICE
vehicles. The manufacturing and sale of EVs, however, is often used to comply with these standards by increasing
fleet-wide fuel economy and decreasing fleet-wide GHG intensity. In 2017, China wrote the first nationwide zero-
emission vehicle (ZEV) mandate into their fuel economy standards (Kodjak 2017). This rule requires vehicle
manufacturers to produce or import a certain number of ZEVs. It gives long-range ZEVs greater credit than short-
range counterparts and allows any credits in excess of the ZEV mandate to apply toward compliance with fuel
overall economy standards. Both the Chinese rule and similar fuel economy standards in the United States and
Europe (Lutsey 2017) do not account for energy used or emissions from powerplants. ZEVs are further
incentivized by multipliers that inflate the implied fuel savings. Such distortions are generally scheduled to be
phased out when EVs reach substantial market share.
Fossil Fuel Taxes: Fossil fuel taxes (excise taxes) are collected at the time of vehicle refueling for gasoline-
fueled vehicles and are often used to fund road construction and repair. EVs do not directly use gasoline or diesel,
and thus are not required to pay fuel taxes. For some EV owners, this can be viewed as an incentive to purchase
EVs over conventional vehicles, in addition to the already cheaper cost of electricity as a transportation fuel
relative to gasoline or diesel. However, many governments are devising ways to make up for lost revenues as their
vehicles shift away from fossil fuels. These include taxes on energy consumption (per-joule) regardless of fuel,
kilometer-based fees, vehicle fees and decals, toll roads, carbon taxes, and more (Dender 2019; Schroeder 2015).
9Of these, taxes on energy consumption and carbon tend to favor electric vehicles since they generally are more
efficient and emit less carbon. Vehicle fees and toll roads can also be adjusted to favor electric vehicles if desired.
EV targets can help guide the design of policy instruments to support market
development and send important investment messages to industry.
EV targets are goals set by governments aiming to increase EV market development. In practice, EV targets often
exist within national or local climate mitigation plans. However, EV targets can also be developed independently.
While targets are not a prerequisite for market development, they can be used as a guiding tenet for policymakers
who are planning to roll out specific policy instruments to increase EV adoption. Put differently, EV targets are
not necessarily policy instruments in and of themselves capable of scaling EV adoption, but rather a goal that
might guide the design of specific policy actions. They represent a long-term vision for policymakers to strive
toward. By indicating a government’s seriousness about EVs, EV targets signal opportunities to invest for the
private sector. In general, EV targets are stated using two different metrics:
EV Sales Target. Defined as an absolute number of EV sales or percentage of total car sales that are EVs
specified over a defined period of time. Sales targets can be set by governments at any level, from national to
provincial to state or local. While oftentimes sales targets focus on light-duty passenger vehicles, they can also
include other EV types, including trucks, commercial vehicles, and vans, among others. One key design
dimension of EV sales targets is eligibility, 4 with decision-makers needing to decide which specific EV
technologies (e.g., EVs, PHEVs, FCEVs, etc.) and applications (e.g., light-duty, buses, trucks, etc.) should count
toward target achievement. To aid in designing EV sales targets, it is helpful for countries to collect and review
historical data on vehicle sales. In some cases, governments may already collect this data. In other cases, new data
collection processes may need to be established. In any case, this data can be used as a guide to design EV sale
targets in a specific country. Various countries have announced EV sales targets. For example, South Korea is
aiming to ensure that every third light-duty vehicle sold in the country by 2030 is an EV (Randall 2019).
EV Stock Target. EV stock targets are defined aspirations for the total number of registered vehicles on the road
that are electric. Similar to EV sales targets, EV stock targets require consideration of eligible technologies
(BEVs, FCEVs, ZEVs, etc.), vehicle applications (e.g., light-duty vehicles, buses, etc.), and timeframes for target
achievement. In order to implement stock targets, government agencies and ministries that register vehicles need
to collect data on the vehicle technology and make this data available for decision-makers. Various countries have
made EV stock target announcements. For instance, Malaysia’s Electric Mobility Blueprint includes an EV stock
target of 100,000 electric light-duty passenger EVs by 2030 (Amir 2019).
Box 3. ICE Phase-Out Targets and Retrofitting Petrol Vehicles
Some countries and jurisdictions have announced targets to phase out ICE vehicles in the coming decades. These
targets include goals to ensure there are no new sales of ICE and diesel cars. They typically also include some
form of 100% EV sales targets and 100% EV or ZEV stock target. Denmark, for instance, aims to achieve this ICE
phase-out goal by 2030, and has established both a 2030 EV stock target of 1.0 million light-duty passenger EVs
and a 100% sales target for light-duty passenger ZEVs by 2035. The combination of a technology-prescriptive
(EV) 2030 stock target with a technology-neutrality (ZEV) 2035 sales target provides a strong market signal while
also enabling the Danish car market with flexibility for compliance. In other countries, such as Japan, national
governments aim to achieve ICE phase-out targets purely through 100% EV sales. The Government of Japan
announced a long-term goal of 100% sales of passenger HEVs, PHEVs, BEVs, and FCEVs by the end of 2050.
This target was established within Japan’s automotive industry strategy to promote open innovation in the next
generation of electrification technology with all EVs produced by Japanese automakers (IEA 2020b).
Retrofitting petrol-using vehicles can be an alternative for countries that are unable to phase out their current ICE
automobile population. This alternative takes existing ICE vehicles and converts them to an EV or a HEV. Though
research is limited, India has a few retrofitting companies that specialize in converting various ICE vehicles, such
as trucks, bikes, cars, and three wheelers to EVs (Chaudhary 2020).
4
This also applies to EV stock targets.
10Well-designed financial incentives increase EV adoption by addressing upfront and
lifetime vehicle costs for consumers while minimizing the impact on government
budgets.
Often the purchase price of EVs is generally higher than their conventional counterparts. In this case, many
countries have found that incentives are helpful to encourage the adoption of EVs. Many of these policies are
designed to recoup associated costs to minimize the impact on government budget through specific policy design
dimensions (e.g., vehicle type eligibility, incentive caps, tax reduction type and amount, etc.) These incentives can
be developed and funded by different levels of government (e.g., federal and local) and include:
Purchase Incentives: Purchase incentives are used to encourage consumers to buy EVs instead of conventional
vehicles by offsetting the capital costs of EVs. Globally, EV purchase incentives have many design dimensions,
including vehicle type eligibility, funding amount based on vehicle type and features, and financial incentive caps.
For example, China has three EV purchase incentives for passenger EVs: for a BEV if the electric range is
between 300 km and 400 km, for a BEV electric range at or above 400 km, and for a PHEV if the range is at or
above 50 km (IEA 2020b). Similarly, India, as part of its National Electric Mobility Mission Plan 2020, proposed
purchase incentives for state or city transport entities to purchase battery electric buses (Government of India
2012). 5
Alternatively (or in addition to), countries use tax credits as another type of financial incentive to reduce the cost
of EVs for consumer. For example, the United States implemented a federal tax credit of up to USD 7,500 for
passenger light-duty PHEVs and BEVs with a minimum battery capacity of 5 kWh. This tax credit begins to
phase out gradually when each individual vehicle manufacturer sells 200,000 EVs (IEA 2020b). In 2018, Tesla
surpassed this threshold, triggering the federal tax credit phase-out for the new purchase of a Tesla. The federal
tax credit phase-out began in the second quarter of 2019 with a 50% reduction from full credit (i.e., USD 3,750)
and then a 25% reduction from full credit the following quarter (i.e., USD 1,875); as of the time of this writing,
Tesla vehicles are no longer eligible for the U.S. federal tax credit (U.S. Department of Energy 2020). Depending
on the tax code of a particular country, however, tax credits can favor the wealthy, since low-income people may
not have sufficient tax burden to take advantage of tax credits.
Soft-Cost Incentives: Soft-cost incentives are indirect financial benefits that reduce total cost of ownership for
EVs. Distinct from purchase incentives, they can include favorable benefits such as free or priority parking,
reduction or elimination of vehicle registration fees, and special access to toll roads or high-occupancy vehicle
lanes for EV owners. For example, in an effort to reduce reliance on purchase incentives but maintain support for
EV deployment, China has begun emphasizing EV soft-cost incentives. Some provinces (e.g., Shanghai) are
waiving typical drivers’ license plate fee for EV drivers, saving them nearly RMB 100,000 (USD 15,900) (IEA
2020b). In other Chinese cities, EVs are exempted from certain regulations, including traffic control measures that
limit the number of cars permitted on the roads during certain periods. Similarly, multiple states in the United
States (i.e., California, Colorado, Florida, and New York) allow EVs to use high-occupancy vehicle lanes.
5
These include Rs. 5–20 Lakhs (6,725–26,900 USD) for HEV buses, Rs. 18–34 Lakhs (24,210–45,730 USD) for PHEV
buses and Rs. 20–37 Lakhs (26,900–49,765 USD) for battery electric buses
11Disincentives for conventional vehicle
use: While direct and soft-cost financial
incentives provide a “carrot” for
adopting EVs, governments can also use
a “stick” to discourage use of
conventional vehicles. Two common
ways of doing so are through fuel taxes
and emissions taxes. Fuel taxes 6 are
type of excise tax that is imposed on the
sale of fuel. The Organization for Co-
operation and Economic Development
countries have a range of fuel tax prices,
with the United States at the second
lowest price of $0.56 per gallon and
Netherlands at the highest price of $3.36
per gallon. When consumers purchase
fuel-efficient vehicles, they pay less fuel
taxes due to their improved vehicle Figure 5. Vehicle tax costs of 4 years for privately owned
performance and they are able to use less vehicles based on CO2 emissions and vehicle type
gasoline per miles traveled. Fuel taxes are
Source: (ICCT 2018)
eliminated or unnecessary for EV owners, as
the vehicles are refueled through electricity.
In addition, vehicle emissions taxes are common in European countries; over 18 European countries have CO2
emission taxes. The CO2 emission taxes are based on the vehicle and CO2 emitted (g/km). Figure 2 shows the
comparison of five European countries’ vehicle tax costs of 4 years for privately owned vehicles based on CO2
emissions and vehicles (i.e., BEV, PHEV, and gasoline).
Standards and mandates increase the supply of EVs by requiring vehicle manufacturers
to develop more fuel-efficient, low-emissions products.
EV standards and mandates support EV targets by requiring vehicle manufacturers to produce more EVs and/or
fuel-efficient vehicles. They include:
Fuel Economy Standards and GHG Emission Standards: Fuel economy standards incentivize vehicle
manufacturers to develop and produce vehicles that are able to travel further using less fuel, thereby reducing
gasoline/diesel consumption and GHG emissions. Because EVs use no gasoline, they can greatly improve the
average fuel economy (in km per L gasoline) of the manufacturer’s fleet. Most standards count electric energy as
0 gallons gasoline, but others translate it to L of gasoline equivalent (which still provides a large boost to fuel
economy). GHG emissions standards incentivize vehicle manufacturers to develop and produce vehicles that emit
fewer CO2 emissions. 7
For example, the National Highway Traffic Safety Administration and the Environmental Protection Agency in
the United States regulate two vehicle fuel economy and GHG standards: (1) the Corporate Average Fuel
Economy, which focuses on decreasing overall miles per gallon (mpg) of new passenger vehicles; and (2) the
GHG emissions standard, which focuses on grams of emitted carbon dioxide, or the CO2-equivalent for GHG, per
miles traveled in cars and trucks. In 2020, the National Highway Traffic Administration and Environmental
Protection Agency issued the Safer Affordable Fuel-Efficient Vehicles Rule to amend and establish new carbon
dioxide and fuel economy standards. This rule requires vehicle manufacturers to:
• Improve fuel efficiency by 1.5% annually for model years 2021 through 2026
6
In the United States, fuel or gasoline taxes are used to fund infrastructure projects on roadways and other transportation
projects.
7
Typically measured in grams/kilometer.
12• Continue compliance of strict pollution standards under the Clean Air Act for passenger cars and light trucks
from model years 2017 through 2026
• Meet a 40.4 mpg overall industry average required fuel economy by May 2026 (EPA, NHTSA 2020).
Through its New European Driving Cycle regulations, the EU established GHG emission standards that require a
15% reduction of CO2 emissions (in grams of per kilometer (g/km) by 2025 and 37.5% reduction of CO2
emissions (g/km) by 2030 based on a 2021 baseline 8 (ICCT 2019).
ZEV Mandate: A ZEV mandate requires vehicle manufacturers to incorporate more ZEVs in the market. ZEV
type or eligibility is one of the program’s design dimension, as the term for ZEV can vary by region. ZEV is
generally defined as a vehicle or car that does not produce tailpipe exhaust. Because they do not produce tailpipe
emissions, EVs (of various types) are considered ZEVs and can help vehicle manufacturers meet their ZEV
requirements. In Chinese regulations, ZEVs are called new-energy vehicles; low-emission vehicle, or zero-low
emission vehicles in EU regulations; and ZEVs in U.S. regulations (ICCT 2019).
The design dimensions of the ZEV mandate include vehicle manufacturer volume size based on sales, ZEV
eligibility based on vehicle type, credit requirements and credit value based on vehicle type, and mandate
penalties. Within a ZEV program, vehicle manufacturers are assigned ZEV credit requirement that are earned by
selling ZEVs (i.e., the number of credits are based on ZEV type). Based on the credit requirement, a certain
percentage of sales must be ZEVs. For example, if the credit requirement is 7% and the vehicle manufacturer
plans to sell 100,000 vehicles in a year, then they must have at least 7,000 ZEV credits to fulfill the program
requirement. Jurisdictions that have implemented this mandate (e.g., California, China, the EU) share similar
program characteristics with varying ZEV program design dimensions. See Table 3 for the key differences
between California’s ZEV Mandate, China’s new-energy vehicle mandate, and the EU’s Voluntary ZEV Targets.
8
The 2021 baseline for new cars is 95 g/km. Thus, new cars in the EU require an average target value of 81 g/km by 2025
and 59 g/km by 2030.
13Table 3. Key ZEV Mandate Differences Between California, China, and EU
California China EU
Regulated Vehicle sales greater Vehicle sales greater than 30,000 All vehicle
vehicle than 20,000 units units manufacturers have the
manufacturers option to comply or
not
ZEV eligibility BEVs, FCEVs, and BEVs with range of 100 km All vehicles that
conditional PHEVs* FCEVs with range of 300 km produce 50 g/km or
PHEVs with range of 50 km lower of CO2
emissions
Percentage 2019: 7% 2019: 10% 2025–2029: 15%
credit 2020: 9.5% 2020: 12% 2030: 35%
requirements 2025: 22% 2021–2023: 14%–18%
Percentage of Up to 4 credits Up to 6 credits Up to 1.05 credits
credits per
vehicle sold
Penalty $5,000 per ZEV Government will not approve new None
credit deficit vehicles that do not meet fuel
consumption standards until the
ZEV deficits are fully offset.
* PHEVs must comply with California’s “super ultra-low emission vehicle” emission standards.
Source: (Rokadiya and Yang 2019; Hardman, Jenn, Axsen et al. 2018)
Consumer education and awareness drive end-use EV adoption and are key aspects of
EV market transformation.
While many government agencies and ministries are incorporating and implementing EV targets and incentives to
increase EV adoption, it is crucial to communicate, educate, and establish awareness of EV technologies, policies,
and incentives to consumers. Developing local communication programs or joining global programs can provide a
platform to promote EVs to consumers and communities. Currently, there are 15 countries that participate in the
Electric Vehicle Initiative, which was established under the Clean Energy Ministerial as a multi-government
policy forum to accelerate the adoption of EVs globally (IEA 2021). 9 Global programs, like the Electric Vehicle
Initiative, provide a platform for public sector stakeholders to gain knowledge and resources about best practices
and lessons learned for EV adoption through workshops and webinars. Resources developed can be implemented
into local communication programs, discussed at public events and workshops, and shared through social media
marketing. Clear, tailored consumer education and awareness initiatives encourage EV adoption beyond early
adopters and help mainstream the technology.
9
Fifteen countries are currently participating in the Electric Vehicle Initiative: Canada, Chile, China, Finland, France,
Germany, India, Japan, the Netherlands, New Zealand, Norway, Poland, Portugal, Sweden, and the United Kingdom.
14Box 4. Summary of Key Target and Incentive Guidance for Decision Makers
• Set EV and EVSE targets, as these commitments can focus and guide government and private sector
deployment strategies.
• Consider EV and EVSE purchase incentives to help defray the capital costs of these important
investments.
• Consider soft-cost incentives, such as free parking or reduced registration fees, that reduce total cost of
ownership for EVs.
• Pair EV incentives with disincentives for ICE use, such as fuel or GHG taxes.
• Increase the supply of EVs through standards and mandates that require manufacturers to develop more
fuel-efficient, low-emissions products such as EVs.
• Develop consumer education and awareness programs to build end-user demand for EVs.
152 Data Collection and Management for EV Deployment
Data curation and management helps identify the potential benefits of vehicle
electrification and enables well-designed strategies to scale EV deployment in a
targeted manner.
There are measurable attributes of a transportation system that can help to indicate: (1) the best way to improve
general transportation efficiency and quality for a given region, (2) the potential benefits of a transition to electric
mobility for various types of vehicles/applications, and (3) the most effective instruments and approaches for
transitioning to electric mobility. These attributes are often quantified by the key data sets listed in this section,
which we organize into two categories 10:
Foundational Data: Multipurpose data useful for defining the fundamentals of a transportation system.
• Transportation fuel use
• Vehicle stock
• Vehicle kilometers traveled.
Specialized Data: Useful for identifying the potential benefits of electrification, the best vehicles to electrify, and
the best instruments to use when pursuing electrification.
• Mode of travel
• Access to home charging
• Gasoline prices
• Electricity tariffs
• Drive cycle profiles
• Geospatial data
• Electricity generation mix.
Foundational Data
Transportation Fuel Use data can be used for multiple purposes. When divided by population, it becomes a
basic metric for how energy efficient a transportation system is. It can also be an input to numerous quantitative
models to help estimate the emissions coming from the transportation sector, and therefore the air quality impacts
of vehicle electrification. Fuel is often imported, making the quantity of fuel used important in macroeconomic
and energy security-related calculations, as well as resiliency-related decisions. It can also be converted to energy
equivalents in order to estimate the increased electricity demand that electrifying transportation would add to the
power system under various deployment scenarios. Fuel use is tracked in most countries because it is typically
taxed. Therefore, some version of this data can usually be located at relevant ministries related to tax revenue
collection or imports. However, it is often processed and made readily available by Ministries of Energy.
Vehicle Stock data generally includes the make, model, vehicle type, and model year of every vehicle registered
in a country. Vehicle age and average lifespan can be determined by comparing the model year of vehicles to the
registration snapshot year. This data is invaluable when determining how many vehicles might be replaced with
comparable and available EVs. It also aids any fleet-specific strategies by informing decision-makers how many
fleet-specific vehicles are in the country. Vehicle stock data is typically collected through a vehicle registration
system that is coordinated with registration tax/fee collection. Therefore, relevant ministries related to tax revenue
collection or vehicle registration may be a good place to begin searching for this data.11 In addition, commercial
banks are sometimes good sources of vehicle stock data, as they collect this data in order to assess the wealth of
their clientele when evaluating eligibility for loans. The credit agency Experian and the data company IHS Markit
10
The data descriptions below are aimed at the national level but are just as useful for regional and local transportation
systems.
11
Oftentimes, government-owned vehicles do not pay taxes or need to be registered with the same government agencies as
privately owned vehicles; as a result, they may be missing from some vehicle stock databases.
16You can also read


