Building for the Future - NOVEMBER MARKETING - Investors
←
→
Page content transcription
If your browser does not render page correctly, please read the page content below
Building for the Future
       NOVEMBER MARKETING

                       1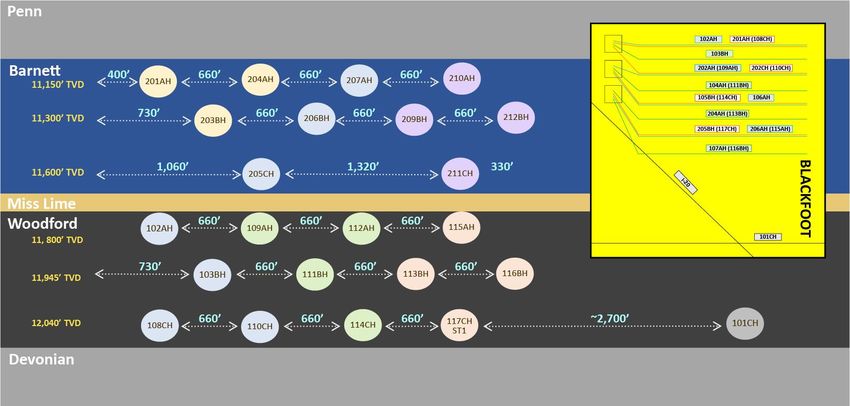
FORWARD-LOOKING STATEMENTS
Certain statements in this presentation contain "forward-looking statements" within the meaning of Section 27A of the Securities Act of 1933 and Section 21E of the Securities Exchange Act of 1934 including, without
limitation, expectations, beliefs, plans and objectives regarding anticipated financial and operating results, asset divestitures, estimated reserves, drilling locations, capital expenditures, price estimates, typical well
results and well profiles, type curve, and production and operating expense guidance included in this presentation. Any matters that are not historical facts are forward looking and, accordingly, involve estimates,
assumptions, risks and uncertainties, including, without limitation, risks, uncertainties and other factors discussed in our most recently filed Annual Report on Form 10-K, recently filed Quarterly Reports on Form 10-Q,
recently filed Current Reports on Form 8-K available on our website, www.apachecorp.com, and in our other public filings and press releases. These forward-looking statements are based on Apache Corporation’s
(Apache) current expectations, estimates and projections about the company, its industry, its management’s beliefs, and certain assumptions made by management. No assurance can be given that such expectations,
estimates, or projections will prove to have been correct. A number of factors could cause actual results to differ materially from the projections, anticipated results, or other expectations expressed in this
presentation, including, Apache’s ability to meet its production targets, successfully manage its capital expenditures and to complete, test, and produce the wells and prospects identified in this presentation, to
successfully plan, secure necessary government approvals, finance, build, and operate the necessary infrastructure, and to achieve its production and budget expectations on its projects.

Whenever possible, these “forward-looking statements” are identified by words such as “expects,” “believes,” “anticipates,” “projects,” “guidance,” “outlook,” “will”, and similar phrases. Because such statements
involve risks and uncertainties, Apache’s actual results and performance may differ materially from the results expressed or implied by such forward-looking statements. Given these risks and uncertainties, you are
cautioned not to place undue reliance on such forward-looking statements, which speak only as of the date hereof. Unless legally required, we assume no duty to update these statements as of any future date.
However, you should review carefully reports and documents that Apache files periodically with the Securities and Exchange Commission.

Cautionary Note to Investors: The United States Securities and Exchange Commission (SEC) permits oil and gas companies, in their filings with the SEC, to disclose only proved, probable, and possible reserves that
meet the SEC's definitions for such terms. Apache may use certain terms in this presentation, such as “resource,” “resource potential,” “net resource potential,” “potential resource,” “resource base,” “identified
resources,” “potential net recoverable,” “potential reserves,” “unbooked resources,” “economic resources,” “net resources,” “undeveloped resource,” “net risked resources,” “inventory,” “upside,” and other similar
terms that the SEC guidelines strictly prohibit Apache from including in filings with the SEC. Such terms do not take into account the certainty of resource recovery, which is contingent on exploration success, technical
improvements in drilling access, commerciality, and other factors, and are therefore not indicative of expected future resource recovery and should not be relied upon. Investors are urged to consider carefully the
disclosure in Apache’s Annual Report on Form 10-K for the fiscal year ended December 31, 2017 available from Apache at www.apachecorp.com or by writing Apache at: 2000 Post Oak Blvd., Suite 100, Houston, Texas
77056 (Attn: Corporate Secretary). You can also obtain this report from the SEC by calling 1-800-SEC-0330 or from the SEC's website at www.sec.gov.

Certain information may be provided in this presentation that includes financial measurements that are not required by, or presented in accordance with, generally accepted accounting principles (GAAP). These non-
GAAP measures should not be considered as alternatives to GAAP measures, such as net income or net cash provided by operating activities, and may be calculated differently from, and therefore may not be
comparable to, similarly titled measures used at other companies. For a reconciliation to the most directly comparable GAAP financial measures, please refer to Apache’s third quarter 2018 earnings release and third
quarter 2018 Financial & Operational Supplement at www.apachecorp.com.

None of the information contained in this document has been audited by any independent auditor. This presentation is prepared as a convenience for securities analysts and investors and may be useful as a reference
tool. Apache may elect to modify the format or discontinue publication at any time, without notice to securities analysts or investors.

                                                                                                                                                                                                                        2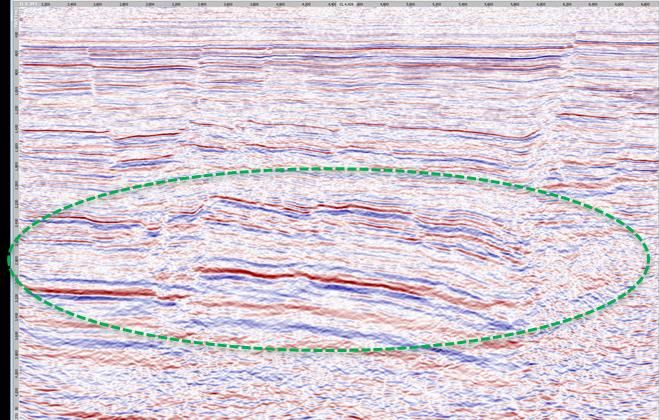
TABLE OF CONTENTS
Apache Overview
Portfolio Review
Permian Basin
Alpine High / Altus Midstream
International
3Q’18 Highlights & 2019 Preview
Guidance
Appendix
3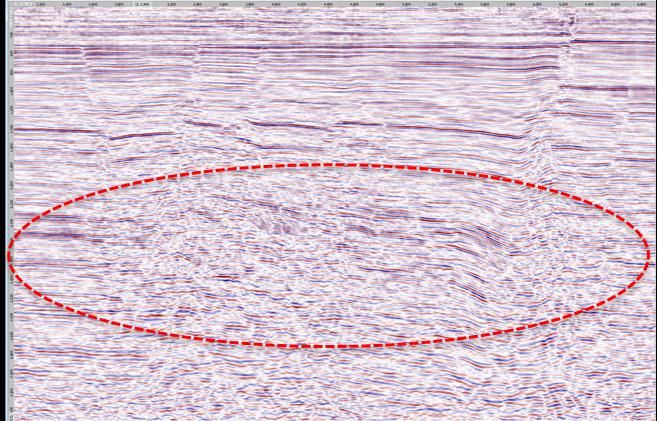
APACHE TRANSFORMATION
Focusing the Portfolio, Growing the Permian, Improving Returns
            Current Portfolio                                                                           2014         3Q 2018
                                                         Total Production (Reported)(1)             647 Mboe/d      476 Mboe/d

                                                               Permian Production                   159 Mboe/d      222 Mboe/d

                                                  US / Int’l Production Mix (Reported) (1)           45% / 55%      57% / 43%

                                                        Oil Production Mix (Reported) (1)               50%             51%

                                                            Capital Investment (FY)                 $10.7 billion   $3.45 billion

                                                                      Rig Count                        119 rigs        33 rigs

                                                             Net Debt (Period End)                  $10.5 billion   $7.6 billion

                                                               Shares Outstanding                    376.5 MM        381.6 MM

                                                     Annualized Dividend (Period End)                 $1.00/Shr      $1.00/Shr
                                                (1) 2014 production includes Australia production

  1Q 2015              April 2015      June 2015                      September 2016                June 2017        November 2018
                        Canada &       Australia Exit                     Announced                 Canada Exit         Closed Altus
  CEO / CFO
                       Australia LNG                                      Alpine High                                    Midstream
Announcement
                            Exit                                           Discovery                                    Transaction

                                                                                                                                       4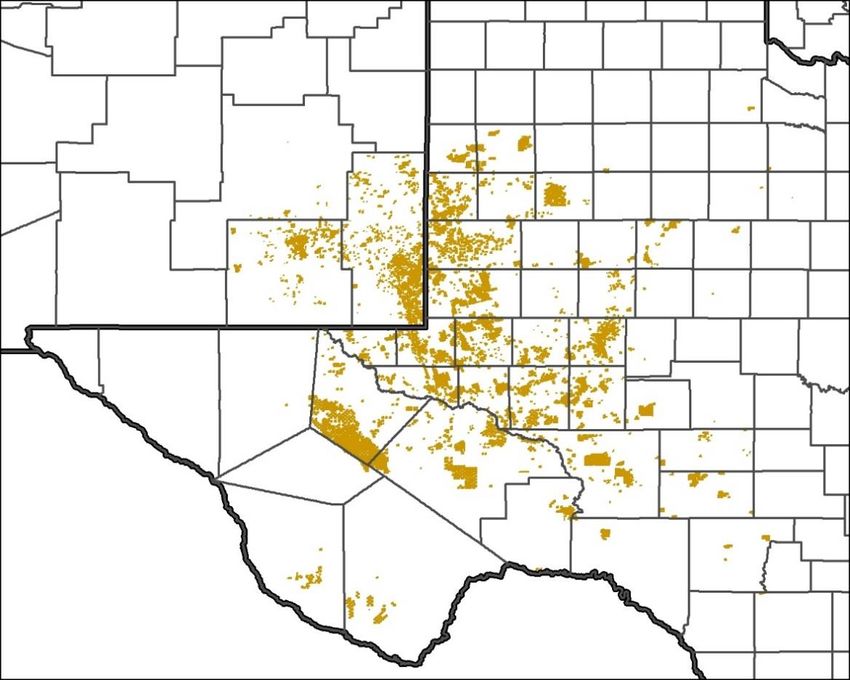
APACHE TODAY
BALANCED, RETURNS-FOCUSED PORTFOLIO
On Track to Achieve Long-Term, Sustainable Double-Digit ROCE
Top-tier Permian Basin position delivering strong growth and returns
Robust free-cash-flow generating assets in Egypt & North Sea
Differential Exploration Opportunities (Lower 48 & Suriname)
DISCIPLINED FINANCIAL APPROACH
Strong balance sheet, steady dividend, no shareholder dilution
Free cash flow visibility / returning capital to shareholders
Formation of Altus Midstream to fund Alpine High buildout
CASH FLOW GROWTH DRIVERS
Double-Digit U.S. Production Growth
Material exposure to Brent crude oil pricing
Strong momentum in North Sea beginning in 4Q 2018
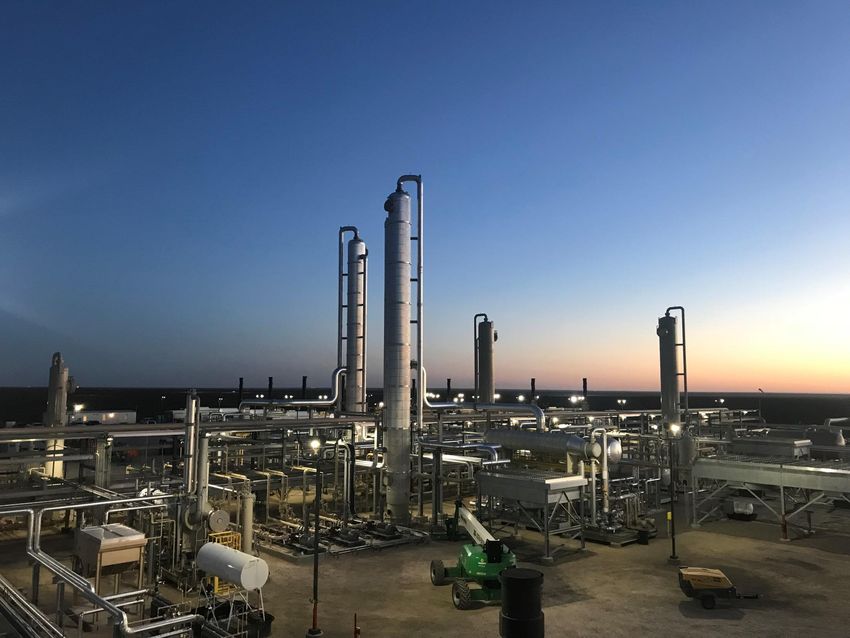
Alpine High cryo installation to drive liquids and margin uplift in 2019
5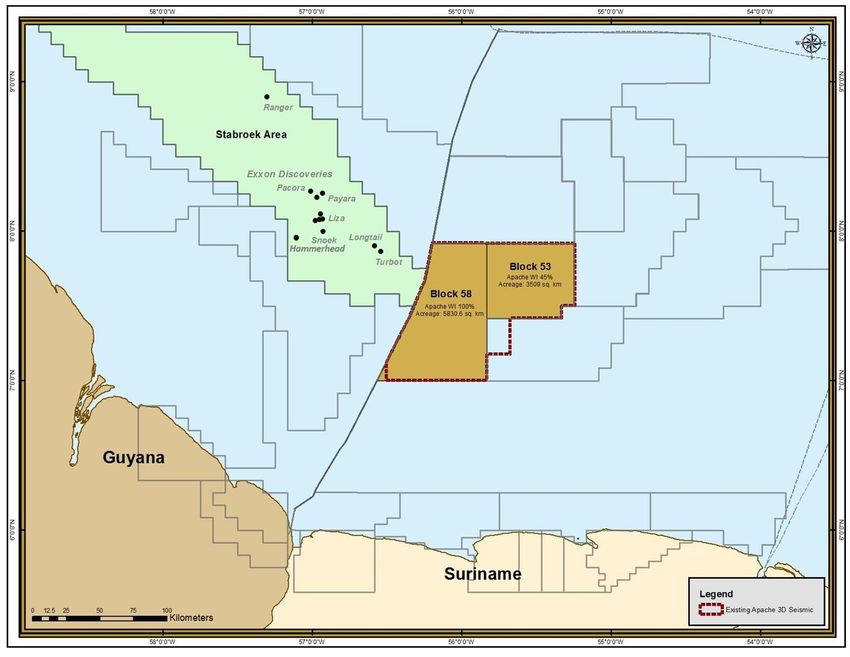
A LEADER IN ESG ENGAGEMENT AND SUSTAINABILITY REPORTING
                                                                                                                                                                                                                                                 DISCLOSING THE FACTS

1   tCO2e/Mboe = metric tons of carbon dioxide equivalent per thousands of barrels of oil equivalent   4   Workforce TRIR (Total Recordable Incident Rate) includes Apache employees at all levels and contractors   The 2017 Disclosing the Facts questionnaire focused on the issue of methane emissions while previous
2   The 2016 value was revised based on updated data                                                   5 Total   Recordable Incident Rate is calculated by multiplying total number of recordable                    questionnaires covered the following topics: toxic chemicals, water and waste management, air emissions,
3 Bbls/Boe   = barrels of water withdrawn per barrel of oil equivalent produced                            injuries by 200,000 hours and then dividing by total person-hours worked                                  community impacts, and management and accountability.

                                                                                                                                                                                                                                                                                                                           6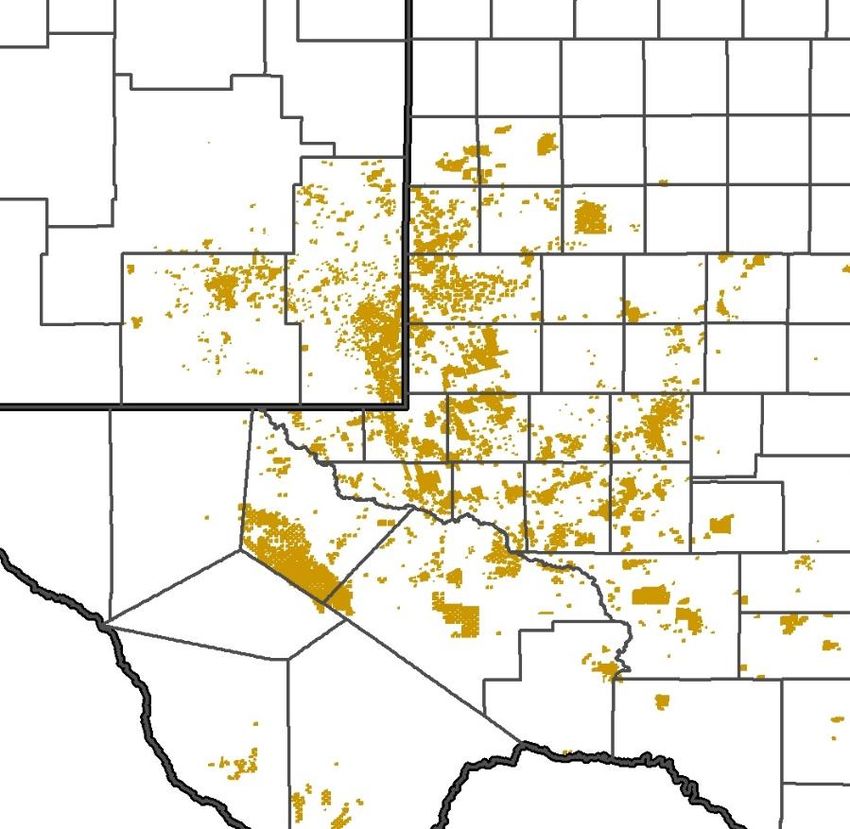
PORTFOLIO REVIEW

                   7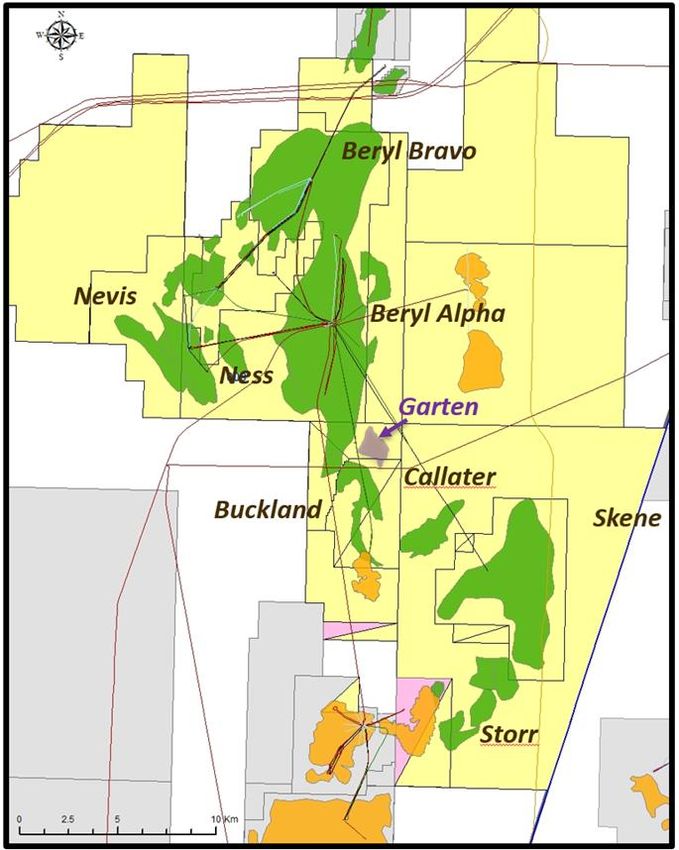
PERMIAN BASIN
Returns-Focused Growth
Strong production growth with flat rig count
Efficiencies driving shorter cycle times and lower costs
Expanding inventory with strategic testing
Upward bias to 2019 guidance
Production & Rig Count 222 50
220
202
40
190 183
177
161 30
159
160 149 148 146 20
130 17 17 16 17 18 10
16
13
100
5 7
0
1.6 MM Net Acres in the Permian Basin
3Q16 4Q16 1Q17 2Q17 3Q17 4Q17 1Q18 2Q18 3Q18
Avg. Production (Mboe/d) Avg. Rigs
8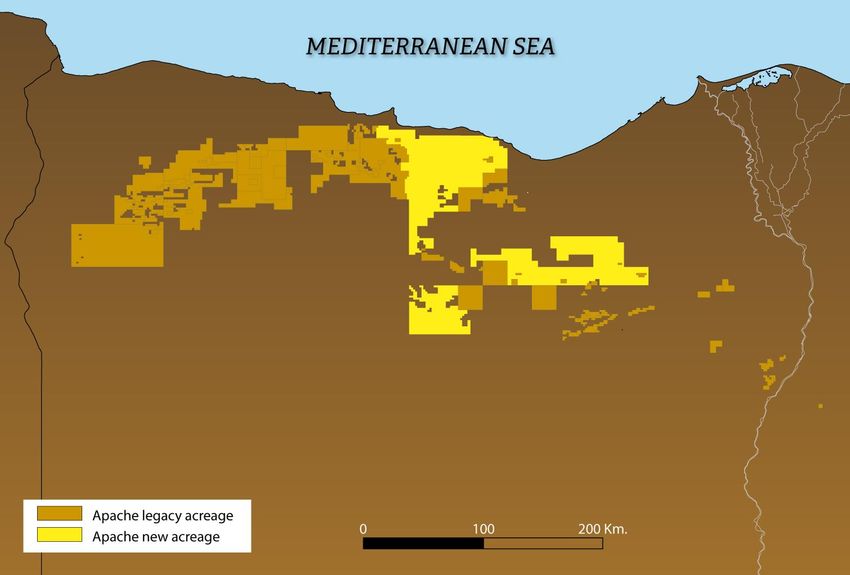
MIDLAND AND DELAWARE BASIN OIL PRODUCTION
Growth to Continue into 2019
Strong well performance Key Focus Areas
Increasing efficiencies, multi-well pads / longer laterals
Midland & Delaware Basin Oil Production (Mbo/d)
Wildfire
Pecos Bend
Azalea
Dixieland
61 60
55 55
46 Powell
40
Alpine High
2Q17A 3Q17A 4Q17A 1Q18A 2Q18A 3Q18A
9
ALPINE HIGH
Developing a World-Class Rich Gas Play
Alpine High Acreage Map
Unprecedented hydrocarbon column > 5,000 ft.
Vertically stacked oil, rich gas and dry gas fairways
Scale
5,000+ locations identified
3 billion bbls / 75 Tcf of resource in place (Woodford & Barnett)
Large operated position / economies of scale
Strategically positioned to deliver NGLs and gas in scale to the
Gulf Coast
Execution Nearly tripling the number of producing wells from YE 2017 to
YE 2018
Guided 2019 Alpine High volumes to upper end of 85-100
Mboe/d range
Highly economic rich gas play; proven oil upside
Economics Liquids uplift combined with low F&D and operating costs →
strong recycle ratios ~340,000 Net Acres(1)
(1) Acreage as of July 1, 2018 10SIGNIFICANT INDUSTRY ACTIVITY INCREASE
FOLLOWING ALPINE HIGH ANNOUNCEMENT
September 2016 August 2018
WARD
CULBERSON
REEVES
PECOS
JEFF DAVIS
Drilled/ Drilling Count: 203
Current Permit Count: 85
Total well count: 288
Mil es
0 5 10 20
20 Miles 20 Miles
BREWSTER
PRESIDIO
APA Operated Rig Competitor Permit Wells PETRA 8/28/2018 4:23:00 PM
Competitor Wells Drilled/Drilling Apache Acreage Outline
Source: Drilling Info.
11ALPINE HIGH: TRANSITIONING TO FULL-FIELD DEVELOPMENT
Apache’s long-term methodical approach to developing Alpine High
2014 - 2016 2016 - 2017 2018 and Beyond
Formulation of concept,
concept testing and
confirmation + Areal and vertical
delineation = Transition to full field development
▪
▪
Optimized Spacing, Patterns &
Completions
Drilling Efficiencies
▪ Lifting Cost Efficiencies
Focus on reducing costs, increasing efficiency and maximizing recovery
12ALPINE HIGH PLAY EVOLUTION
September 2016 November 2018 2020 (Est.)
Rig Count 3 8 10 - 11
Cum. Wells Drilled 14 180 425 – 450 at year-end
Cum. Wells on
9 125 350 – 375 at year-end
Production
Net Production
Nm ~55 160 – 180
(Mboe/d)
Location Count 2,000 – 3,000+ 5,000+ Ongoing Testing
Confirmed Landing
2 13 Ongoing Testing
Zones
• Rich gas processing capacity: 380 MMcf/d • Rich gas processing capacity: ~1,380 MMcf/d
Altus Midstream Nm • Lean treating & compression: 400 MMcf/d • Lean treating & compression: 480 MMcf/d
• Initial cryo under construction • Five cryo plants at year end
13ALTUS MIDSTREAM: TRANSACTION OVERVIEW
Newly Formed Pure Play Permian Basin Midstream Company
Transaction closed November 9, 2018 (Ticker Symbol: ALTM)
Publicly traded C-Corp with 325MM shares outstanding (79% owned by Apache)
~$625MM in cash and zero debt, as of October 1 effective date
Future EBITDA ~ 50% Gathering & Processing and 50% pipeline ownership
14ALTUS MIDSTREAM: GATHERING & PROCESSING OVERVIEW
Pipeline Map Current Asset Highlights
Rich Gas Processing: 380 MMcf/d of capacity in
service
Lean Gas Treating / Compression: 400 MMcf/d
of capacity in service
Gathering Pipelines: ~125 miles in service
Primarily 20-30 inch pipe
Residue Pipelines / Market Connections: ~55
miles in service with 3 market connections
(Comanche Trail, El Paso Line 1600 and Trans-
Pecos Pipeline)
Key Additions by YE 2020
1 Bcf/d of cryo processing capacity
80 MMcf/d of lean gas treating and
compression capacity
> 80 miles of gathering pipeline
1 additional market connection
expected to be in service (Roadrunner)
(1) Acreage footprint depicted on map is as of July 1, 2018. 15ALTUS MIDSTREAM: JOINT VENTURE PIPELINES OVERVIEW
Pipeline Map Commentary
Altus will own options to participate
in five joint venture pipelines
15%(1) of KMI’s Gulf Coast Express
Nat Gas
33%(2) of KMI’s Permian Highway
33% of EPD’s Shin Oak
NGLs
50% of Salt Creek NGL
Crude
15% of EPIC Crude
Altus to invest ~$1.5 - $1.8 billion of
capital in JV pipeline projects
No promote paid above construction
cost for any JV pipeline project
Very attractive projects for Altus (~7x
build multiple of EBITDA, on average)
Pipelines in service by YE 2020
(1) Altus may have the option to acquire an additional 1% interest in GCX subject to certain conditions precedent, including having less than 30% equity in PHP following the exercise of
the PHP option.
(2) Subject to reduction in the event that other options to acquire equity in Permian Highway held by third parties are exercised. Altus ownership expected to be no less than ~27%.
16ALTUS MIDSTREAM: CONSERVATIVE FINANCIAL PLAN
Through the end of 2020, Altus Midstream capital investment estimated at
$2.5 billion. Funding sources include:
Approximately $625 MM cash at effective date, October 1
Estimated operating cash flow of $390 MM through 2020
$800MM 5-year credit facility, with initial availability of $450 MM and eventual ability to
upsize to $1.5 billion
Access to other credit accretive capital sources: preferred equity, asset level financing and
structured equity
Altus Midstream leverage ratio forecasted at less than 3x by year-end 2020
Apache will fully consolidate Altus Midstream, but its future debt is planned to
remain non-recourse to Apache
17ALTUS MIDSTREAM: BENEFITS OF TRANSACTION TO APACHE
At $9 - $10/share, APA’s 79% ownership valued at ~$2.3 - $2.5 billion
Demonstrates Value Equity position to benefit from long-term Alpine High growth plan
Maintain control of future Alpine High midstream buildout
Estimated Altus Midstream gathering and processing investment:
Funds Future Midstream ~$180 MM in 4Q 2018 / $320 MM in 2019 / $330 MM in 2020
Investment Planned JV pipeline investment of ~$1.5 - $1.8 billion
Lower cost of capital
Enhances Capital
Incremental investments / share repurchases / debt retirement
Optionality
18EGYPT
Preparing for Future Growth
Country’s largest oil producer; stable gross production Apache Egypt Acreage: ~6.2 million acres
Running 12 rigs
High-density 3-D seismic program across 4 basins
▪ 2.6 million acres; ~ 38% complete
▪ State-of-the-art technology provides improved fault
definition and enhanced deep imaging
▪ Initiated seismic acquisition in new Northwest Razzak
concession
Production Brent Crude
(Mboe/d) 400 120 ($/Bbl)
100
300 350 345 334 339 334 342 338
328 330 80
200 60
40
100
98 90 88 89 87 82 80 80 78
20 New concessions expand acreage position
0 0
3Q16 4Q16 1Q17 2Q17 3Q17 4Q17 1Q18 2Q18 3Q18
by more than 50%
Adjusted Production Gross Production Brent Crude Pricing
19IMPACT OF RISING OIL PRICE ON EGYPT PSC’S
Cash Flow Increases, Adjusted Production Declines
Production Stable Gross Production Brent Crude / Cash Flow
(Mboe/d) ($/Bbl) ($/Boe)
400 80
Brent
350 70 Up 58%
334 339 334 342 338
330
300 60
250 50
200 40
Cash Flow/Boe
Up 73%
150 30
100 20
Adj. Production
50 89 87 10 Down 13%
82 80 80 78
- -
2Q 17 3Q 17 4Q 17 1Q 18 2Q 18 3Q 18
Adjusted Production Gross Production Egypt Cash Flow per Boe Brent Pricing
(1) Excludes tax barrels and noncontrolling interest
20EGYPT: STATE OF THE ART 3-D
Dramatic Improvement in Sub-Surface Imaging
2013 Vintage Seismic 2018 Vintage Seismic
21NORTH SEA
High Margins, High Returns, Free Cash Flow
Apache North Sea Acreage
Strong leverage to premium Brent crude pricing
Best-in-class operator
3 rigs operating (2 platform, 1 semi-submersible)
Improving base oil production profile at Forties
with water flood management programs
Beryl production poised to increase
Fourth Callater well (CC2) online in 3Q 2018
First Garten well online in 4Q 2018 North Sea Production (Mboe/d)
62 70
58 55 60 58 54 54 51
3Q16 4Q16 1Q17 2Q17 3Q17 4Q17 1Q18 2Q18 3Q18
22NORTH SEA: GARTEN
Large Commercial Discovery in Beryl Area
North Sea Beryl Area Garten discovery well encountered more than
700’ of net oil pay in Block 9/18a Area-W
➢ Recoverable resource is expected to
exceed 10 million barrels of light oil
➢ Apache holds a 100% working interest
➢ Drilling, completion, and tieback costs
are estimated at $80 million
➢ Tied back to the Beryl Alpha platform,
6 kilometres north
Apache’s fourth commercial exploration
discovery in the Beryl area in the past three
years
23SURINAME: HIGH IMPACT OIL EXPLORATION
Massive acreage blocks near proven
oil province
Block 58 seismic processing
complete, identifying and ranking
prospects
Block 58 Block 53
Exploration well to spud on Block 1.44 MM acres 0.87 MM acres
58 by year-end 2019
243Q HIGHLIGHTS & 2019 PREVIEW
253Q 2018 KEY METRICS
Reported Production 476 Mboe/d
Adjusted Production(1) 401 Mboe/d
Cost Incurred and GTP Capital Investment $1 Billion
Upstream Oil and Gas Capital Investment(2) $844 Million
Midstream Oil and Gas Capital Investment(2) $122 Million
Net Cash provided by Operating Activities $1 Billion
Adjusted EBITDAX(2) $1.4 Billion
Earnings Per Share $0.21
Adjusted Earnings Per Share(2)(3) $0.63
(1) Excludes production attributable to Egypt tax barrels and noncontrolling interest.
(2) For a reconciliation to the most directly comparable GAAP financial measure please refer to the third quarter 2018 Financial & Operational Supplement.
(3) Includes $(0.04) per share of dry hole expense (net of tax).
263Q 2018 HIGHLIGHTS
Net cash from operating activities up 82% year-over-year to $1 billion
Strong oil price leverage: 79% of revenue from oil, nearly 70% of oil production received Brent- or Gulf
Coast-linked pricing
Adjusted production of 401 Mboe/d exceeded guidance by 3 Mboe/d
Delivering sustained quarterly production growth
Mboe/d 3Q’17 4Q’17 1Q’18 2Q’18 3Q’18
US 208 222 232 256 273
International 146 140 135 134 128
Total 354 362 367 390 401
(1) Excludes production attributable to divested assets and Egypt tax barrels and noncontrolling interest.
Cash return on invested capital of 23% on an annualized basis through the first three quarters of 2018
Share buybacks
Repurchased 0.9 MM of common stock in September; continued into 4Q 2018
Announcing new share repurchase authorization of an additional 40 MM shares
27UPSTREAM OPERATIONAL HIGHLIGHTS
3Q adjusted total production growth of 13% and Permian oil production
growth of 16%, year over year
Full-pattern development in the Midland/Delaware basin generating
significant cost and productivity improvements
Alpine High progress:
Drilling, completion and equipment costs per lateral foot down approximately 25% year
to date from 2017, in-line with our goal
Drilled first multi-well Bone Spring / Wolfcamp oil pad
Expanding Egypt inventory: fast-track processing of ongoing seismic shoot is
delivering very promising results
Accelerating development of the Garten oil discovery in the North Sea into the
fourth quarter
28QUARTERLY PRODUCTION GROWTH
Delivering Growth on Stabilized Activity Set
Adjusted Production (Mboe/d) Permian Oil Production (Mboe/d)
421
401
390
362 367
354
133
128
134
140 135
Int’l 146
95
90 90
85 85
273 288 78
256
222 232
U.S. 208
3Q17 4Q17 1Q18 2Q18 3Q18 4Q18E 3Q17 4Q17 1Q18 2Q18 3Q18 4Q18E
Note: Adjusted Production excludes production attributable to divested assets and Egypt tax barrels & noncontrolling interest.
29QUARTERLY OIL & GAS CAPITAL INVESTMENT
Operating at a Stable and Efficient Activity Level
Quarterly Capital Investment ($MM)
Stabilized Rig Count (33 to 36) 1) Consistent upstream capital
1,000 investment level over prior 4 quarters
122
2) 3Q’18 upstream capital increase
800 119 143 115
116 reflects:
Timing of capital activity
600
Incremental lease acquisitions &
(2) extensions
(1) (3)
844 (4)
400
724 742
800
750 3) 4Q’18E upstream capital lower
719 717
Includes ~$65MM of ongoing lease
200 acquisition investments
4) 2019 quarterly upstream capital run
- rate expected to average $750MM
3Q 17 4Q 17 1Q 18 2Q 18 3Q 18 4Q 18E 2019E
Qtrly
Upstream Capital Midstream Capital
Note: Excludes noncontrolling interest in Egypt; 4Q 2018 and 2019 Alpine High midstream capital expected to be funded by Altus upon closing.
30WHAT TO EXPECT FROM APACHE IN 2019
Upstream capital investment of ~$3.0 billion
Adjusted production at high end of 410-440 Mboe/d guidance range
15% growth in the U.S. and 10% growth overall
Continue to return capital to shareholders
Flex activity levels with commodity price, overarching goal to achieve
positive free cash flow (inclusive of dividend)
31CURRENT GUIDANCE
32ADJUSTED PRODUCTION OUTLOOK
2018 Production Guidance Update (Mboe/d)
Annual Quarterly
FY 2018 guidance increased to
395 Mboe/d representing
421 13% growth from FY 2017,
including 27% growth in the US
401
395
390
4Q’18 guidance established at
367 421 Mboe/d representing
5% growth from 3Q’18
FY18E 1Q18A 2Q18A 3Q18A 4Q18E
Note: Excludes production attributable to Egypt tax barrels and noncontrolling interest.
33ADJUSTED PRODUCTION OUTLOOK
2018 FY & Quarterly Production Guidance Update (Mboe/d)
TOTAL COMPANY
421
401 Establishing 4Q’18 guidance of 421 Mboe/d
395 390
Increasing 2018 guidance by 1 Mboe/d to 395 Mboe/d
367
FY18E 1Q18A 2Q18A 3Q18A 4Q18E
U.S. 288
273
262 Establishing 4Q’18 guidance of 288 Mboe/d
256
Increasing 2018 guidance by 2 Mboe/d to 262 Mboe/d
232
FY18E 1Q18A 2Q18A 3Q18A 4Q18E
INTERNATIONAL
Establishing 4Q’18 guidance of 133 Mboe/d
133 135 134 133 Decreasing 2018 guidance by 1 Mboe/d to 133 Mboe/d
128
FY18E 1Q18A 2Q18A 3Q18A 4Q18E
Note: Total Company and International excludes production attributable to Egypt tax barrels and noncontrolling interest. 34PERMIAN PRODUCTION OUTLOOK
2018 FY & Quarterly Production Guidance Update (Mboe/d)
PERMIAN
241
222 Establishing 4Q’18 guidance of 241 Mboe/d
212 202 Increasing 2018 guidance by 2 Mboe/d to 212 Mboe/d
183
FY18E 1Q18A 2Q18A 3Q18A 4Q18E
PERMIAN OIL 95
90 90 90 Establishing 4Q’18 guidance of 95 Mboe/d
85 Establishing 2018 guidance of 90 Mboe/d
FY18E 1Q18A 2Q18A 3Q18A 4Q18E
ALPINE HIGH
68 Establishing 4Q’18 guidance of 68 Mboe/d
49 Decreasing 2018 guidance by 1 Mboe/d to 44 Mboe/d
44
32
26 2018 guidance decrease attributable to facilities
downtime in early 4Q
FY18E 1Q18A 2Q18A 3Q18A 4Q18E
35APA ADJUSTED PRODUCTION AND RETURNS
2018-2020 Outlook (Mboe/d)
475 - 510
410 - 440
395
350
20% 22%
18% CROIC
CROIC
CROIC
2017A 2018E 2019E 2020E
See Glossary of Referenced Terms in Appendix for a definition of Cash Return on Capital Invested (CROIC)
36PERMIAN PRODUCTION
2018-2020 Outlook (Mboe/d)
315 - 335
245 - 260
212
158
2017A 2018E 2019E 2020E
37ALPINE HIGH PRODUCTION
2018-2020 Outlook (Mboe/d)
160 - 180
85
85 - 100
44
9
2017A 2018E 2019E 2020E
38INT’L ADJUSTED PRODUCTION
2018-2020 Outlook (Mboe/d)
Shallow Decline
144
133 125 – 140 125 – 140
2017A 2018E 2019E 2020E
Note: Adjusted production excludes Egypt tax barrels and noncontrolling interest. Comprises North Sea and Egypt production.
39APPENDIX
40ALPINE HIGH: DISTINCT SOURCE ROCK AND PARASEQUENCE
INTERVALS
3rd BONE SPRINGS
Parasequences
High frequency,
rapidly rising and
falling sea level
environment
WOLFCAMP
UNCONFORMITY PENNSYLVANIAN
Tranquil marine
Source Rock
BARNETT
environment,
gradually rising
worldwide sea level WOODFORD
conditions ORGANIC SHALE PARASEQUENCE
CARBONATE DEBRIS FLOW
DEVONIAN
ORGANIC SHALE
Woodford + Barnett + Penn 3rd Bone Springs + Wolfcamp
Thick, laterally continuous deposition Higher variability with sweet spots
Oil, wet gas and dry gas windows Oil and wet gas windows
Minimal in-situ water Water wet rock
Indigenous, organic shale Indigenous shale and migrated hydrocarbons
41ALPINE HIGH: STRUCTURAL CROSS SECTION
NORTHERN FLANK CREST SOUTHERN FLANK
Evaporites
Transgressive Parasequences
7,500’
8,500’ OIL
8720
9,500’ 9210
9420
9130
???
9700
9760
9925 10820
10215
Transgressive Source Interval
10,500’ 10100
10460
10050
1160
11,500’ WET GAS
12,500’
Devonian High Stand
13270
13,500’ 13370
13970
DRY GAS
~60 miles
Note Vertical and horizontal scales are not equivalent.
42ALPINE HIGH: GEOLOGY OF THE SOUTHERN DELAWARE BASIN
IMMATURE
South
West
Alpine High North
East
Evaporites
5,000’
OIL
Bone Springs / Wolfcamp
10,000’
Penn / Barnett / Woodford Bone Springs / Wolfcamp
WET GAS
15,000’
20,000’ Alpine High:
Stable shelf (Paleo high)
DRY GAS
Prospective section in the wet gas and oil window
25,000’
Thermal maturation controlled by depth of burial
Low clay content and low ductility
30,000’
CLAY CONTENT
15% 40%
43ALPINE HIGH: ATTRACTIVE RICH GAS ECONOMICS
Representative fully burdened economics for rich gas wells in a development scenario (4,400’ lateral)
Typical Well Upper Range Well
EUR (Bcfe) 9 - 15 EUR (Bcfe) 16 - 21
Well Cost ($MM) $4 - $6 Well Cost ($MM) $4 - $6
Product Mix Product Mix
% Oil 3% - 15% % Oil 0% - 8%
% NGL 51% - 56% % NGL 41% - 54%
Fully Burdened Economics @ $65 WTI / $3.00 HH Fully Burdened Economics @ $65 WTI / $3.00 HH
BTAX NPV-10 ($MM) $7 - $9 BTAX NPV-10 ($MM) $6 - $13
BTAX IRR % 50% - 100% BTAX IRR % 78% - 300%
Fully Burdened Economics @ $50 WTI / $2.50 HH Fully Burdened Economics @ $50 WTI / $2.50 HH
BTAX NPV-10 ($MM) $4 - $6 BTAX NPV-10 ($MM) $3 - $9
BTAX IRR % 29% - 66% BTAX IRR % 38% - 158%
Single Well Economic Assumptions:
• Prices: $65 WTI / $3.00 Henry Hub / NGL($/GAL) C2: $0.28, C3: $0.83, C4: $0.94, C5: $1.42 • Crude basis: $2.25
$50 WTI / $2.50 Henry Hub / NGL($/GAL) C2: $0.28, C3: $0.75, C4: $0.90, C5: $1.22 • NGL yields and midstream fees assume cryogenic processing
• Waha basis / Transport to US Gulf Coast markets = $0.50/MMbtu; midstream fee = $0.87/Mcf • Economics include overhead, workover, abandonment and E&P facility burdens
44ALPINE HIGH: PREMIUM CAPITAL EFFICIENCY
Top-tier recycle ratios highlight ability to generate cash and re-invest
Typical Well Upper Range Well
$/BOE
30 30 580%
recycle
433% ratio
24.78 10.49
25 recycle 25
OIL ratio
$62.75 21.16 9.79
20 20 $62.75
15 14.29 15
NGL $21.51
$24.33 11.37
10 10
5 3.30 5
$2.81
$2.84 GAS 1.96
- -
Revenue Opex Cash Margin F&D Revenue Opex Cash Margin F&D
Highly prolific wells and low costs result in impressive recycle ratios
Assumptions:
• Prices: $65 WTI; $3.00 Henry Hub; Waha basis ($0.50); NGL($/GAL) C2: $0.28, C3: $0.83, C4: $0.94, C5+: $1.42 • F&D reflects drilling, completion, and equipping
• Opex includes LOE, Gathering, Transportation & Processing, and Production taxes • Recycle Ratio: Cash Margin/F&D
45ALPINE HIGH: DOGWOOD SPACING TEST
(NOT TO SCALE)
WELLBORES COLORED BY BATCH PAD
46ALPINE HIGH: BLACKFOOT PATTERN & SPACING TEST
(NOT TO SCALE)
To Be
Drilled
WELLBORES COLORED BY BATCH PAD
472018-2019 PERMIAN BASIN GAS POSITIONING
Production Flow Risk Price Exposure
2018 2019 2018 2019
Uncommitted Firm Transport Firm Transport
Production 9% 8% Other
12% Basin
Firm Other
Basin Firm 4%
Uncommitted Transport
7% Transport
Production 21%
21%
20%
Basis
Hedges
Contracts / Dedicated Contracts / EP Perm / Waha 20% EP Perm / Waha Basis
Sales Dedicated Sales Index Index Hedges
79% 59% 65% 60% 15%
Firm transport and other basin-based contracts generally access Gulf Coast Pricing
Waha basis hedges average approximately $0.51 per MMBtu for 4Q 2018 - 2019
482018-2019 PERMIAN BASIN OIL POSITIONING
Production Flow Risk Price Exposure
2018 2019 2018 2019
Basis
Hedges
4%
West
West Basis
Texas
Texas Hedges
Sour
Sour 24%
26% GC/Cushing
Term
29% Term Sales
Based Midland Midland
Sales 49% GC/Cushing
38% Based Based
52% Diversified Diversified Based 62%
58%
Evergreen Evergreen 14%
Sales Sales
19% 25%
▪ Term sales backed by customers’ firm transport ▪ Contracts provide various options for higher of Gulf
Coast/Cushing/Midland pricing
▪ West Texas Sour less subject to oversupply and takeaway
capacity constraints than WTI ▪ In 3Q, added 12,000 bbls/d WTI Midland basis swaps for
Q1 2019 – Q3 2019
▪ Diversified evergreen sales represent agreements with
multiple buyers across multiple systems(1)
(1) Consists of approximately 22 contracts with 10 counterparties of varying term lengths; subject to cancellation, but only with a minimum of 30 days notice. 49GLOSSARY OF REFERENCED TERMS
Capital Investment Budget: Includes exploration and production capital, gathering, transmission, and processing
capital, capitalized general and administrative expenses, capitalized interest and asset retirement obligations
settled. Excludes non-cash asset retirement additions and revisions and noncontrolling interest
CROIC (Cash Return On Invested Capital): Calculated with the numerator as cash flow from operations before
changes in working capital, excluding noncontrolling interest, with financing costs added back; and the
denominator as average debt plus average Apache shareholders’ equity
Net Debt: Total debt (long-term and short-term) less cash and cash equivalents
ROCE (Return on Capital Employed): Calculated with the numerator as adjusted earnings plus financing costs and
taxes (excluding Egypt taxes); and the denominator as average debt plus average Apache shareholders’ equity
In addition to the terms above, a list of commonly used definitions and abbreviations can be found in Apache’s form
10-K for the year ended December 31, 2017.
50You can also read