Burnout, Sleep, and Sleepiness during Day and Night Shifts in Transition from 8- to 12-Hour Shift Rosters among Airline Ground Crew Managers - MDPI
←
→
Page content transcription
If your browser does not render page correctly, please read the page content below
Article
Burnout, Sleep, and Sleepiness during Day and Night
Shifts in Transition from 8- to 12-Hour Shift Rosters
among Airline Ground Crew Managers
Tamar Shochat 1, * , Satanay Hadish-Shogan 1,2 , Michal Banin Yosipof 3 , Ayelet Recanati 3 and
Orna Tzischinsky 4
 1   The Cheryl Spencer Department of Nursing, Faculty of Social Welfare and Health Sciences,
     University of Haifa, Haifa 3498838, Israel; satanayha@gmail.com
 2   Haemek Hospital, Afula 18317, Israel
 3   El Al Israeli Airlines LTD., Ben Gurion Airport 7015001, Israel; michalba@elal.co.il (M.B.Y.);
     ayeletr@elal.co.il (A.R.)
 4   Behavioral Sciences, Max Stern Yezreel Academic College, Emek Yezreel 19300, Israel; orna3007@gmail.com
 *   Correspondence: tshochat@univ.haifa.ac.il; Tel.: +972-54-6607480

 Received: 30 January 2019; Accepted: 16 April 2019; Published: 24 April 2019

 Abstract: Organizational changes in shift scheduling provide rare opportunities for field studies
 aimed at investigating the effects of such changes on health and wellbeing. We studied the effects
 of a transition from 8-hour (8-h) to 12-hour (12-h) shift rosters in 39 airline ground crew managers
 on burnout, sleep quality, and sleepiness. Assessments were collected during the 8-h and were
 repeated three months after the transition to 12-h shift rosters. These assessments included the
 Shirom-Melamed Burnout Measure (SMBM), the Pittsburgh Sleep Quality Index (PSQI), actigraphy,
 the Karolinska Sleepiness Scale (KSS) completed hourly during one day and two night shifts, and
 caffeine intake. Findings demonstrated lower burnout, improved sleep quality, improved quality of
 naps, and increased afternoon sleepiness during the 12-h day shift. Napping was reported during
 12-h night shifts by 36% of the sample. In nappers, increased night shift sleepiness was associated
 with increased caffeine intake on 8- and 12-h shifts. In non-nappers, increased night shift sleepiness
 was associated with decreased caffeine intake on the 8-h shift only. Change in shift length affects
 other structural and behavioral parameters in the workplace, making it challenging to isolate distinct
 characteristics of the two rosters and their relative effects on study outcomes. Individual differences
 in adaptation to shiftwork may also play a role.

 Keywords: sleep quality; sleepiness; burnout; shiftwork; shift length; napping; caffeine

1. Introduction
      For the past several decades, ergonomics researchers have attempted to optimize shiftwork
schedules in order to improve health, safety, welfare, and functional outcomes for shift workers.
Factors studied in recent years that have been shown to affect sleep, sleepiness, burnout, and other
health and functional outcomes include type of shift (e.g., fixed afternoon/evening, rotating [1,2], short
rest periods between shifts [3,4], unpredictable work hours [4], split shifts [4,5], and shift length [6,7].
In the present investigation, we were offered an opportunity to prospectively examine functional
outcomes in the context of a planned pilot transition from 8-hour (8-h) to 12-hour (12-h) shift rosters in
shift-working ground crew airline managers.
      Studies focusing on the length of the shift within the 24-hour day have typically contrasted 8-h and
12-h shifts [6–11]. However, few field studies have prospectively assessed the health and functionality
of shift workers transitioning from 8- to 12-h shift rosters; these have revealed different and often

Clocks&Sleep 2019, 1, 226–239; doi:10.3390/clockssleep1020020                   www.mdpi.com/journal/clockssleep
Clocks&Sleep 2019, 1 227
inconsistent findings [10,12–16]. In a series of studies using the National Institute for Occupational
Safety and Health (NIOSH) fatigue and performance test battery in control room operators [13,14]
and in employees of a natural gas utility [15], findings consistently showed decline in performance
tasks that were attributed to the extra work hours and shorter sleep duration following the transition
from 8-h to 12-h shifts. Assessment of performance over consecutive workdays revealed that some
performance tasks (e.g., grammatical reasoning response time and accuracy) improved across days in
the 12-h but not in the 8-h shift rosters, suggesting that the shorter workweek may offset some of the
negative effects of the longer work shift [13]. Investigators concluded that the extra work hours per
shift and the associated sleep debt and increase in fatigue explain the decline in performance during
the 12-h shifts, and that despite this decline, the opportunity to condense the work week into fewer
shifts is popular among workers who are willing to endure the increased fatigue and compromised
performance [15].
Other studies demonstrated some functional improvements when moving from 8- to 12-h shift
rosters in measurements including blood pressure, sleep duration, sleep quality, and subjective level
of alertness [12], psychological health and fatigue, [16], mood, sleep and general health measures, as
well as higher satisfaction regarding domestic and social domains [10]. However, higher error rates
were recorded on performance tests towards the end of the 12-h but not the 8-h shifts [10]. Beyond the
apparent diversity in workers’ professions and in the measured outcomes, we cautiously conclude
that workers report improved outcomes regarding their health and wellbeing despite indications of
compromised performance. It is important to note that typically, in these studies, only a subset of
workers participate in all measurements for both the 8-h and 12-h shifts (e.g., [10,14,15]). Therefore,
data analysis was based on independent between-group designs.
Few studies have assessed the effects of shift length on burnout, fatigue, job stress, and job
satisfaction, and these were based on cross-sectional studies of hospital nurses [6,17,18]. In a European
study, a shift length of 12 hours or more was associated with a 26% increase in reported emotional
exhaustion, a 21% increase in experiences of depersonalization, and a 39% decrease in sense of personal
accomplishment. Nurses reported less satisfaction with work and schedule flexibility and were
more likely to report an intention to leave their job as compared to a shift length of 8-h or less [6].
Similar findings were reported in a study of U.S. nurses, showing an increase in burnout and job
dissatisfaction with increasing shift lengths [17].
Conversely, one study found lower emotional exhaustion and increased job and schedule
satisfaction in nurses working 12-h compared to 8-h shifts [19]. The urban setting or other demographic
characteristics of the sample in this study may explain these discrepant findings. In addition, typical
characteristics of hospital nurses, including female gender and associated family responsibilities, low
job control, and high psychological demands are likely to contribute to job strain, burnout, and job
satisfaction [20]. For this reason, the subjects may not be comparable to managerial workers in other
less stressful settings.
It is evident from the literature that most of the studies that examined the effects of shift length
(8-h versus 12-h) compared independent groups of workers or prospectively followed small sample
sizes. Very few field studies have been performed on the same individuals transferring from 8-h to 12-h
shifts, separately assessing outcomes during both day and night shifts and in the home environment.
None of the prospective studies assessed burnout, and the few that assessed sleep quality and duration
were based on subjective reporting. Furthermore, most studies were performed over two decades
ago. In 2014–2015, we had the opportunity to perform such a naturalistic pilot field study in airline
ground crew managers. We tested the feasibility of a transition from a three-shift roster (day shift:
07:00–16:00, evening shift: 16:00–23:00, and night shift: 23:00–07:00 hours), hereafter, the 8-h shift roster,
to a two-shift roster (day shift: 08:00–20:00 and night shift: 20:00–08:00), hereafter, the 12-h shift roster.
The objective of the current study was to prospectively compare burnout, objective and subjective
measures of sleep quality and duration, and sleepiness during day and night shifts in airline ground
crew managers in the transition from 8-h to 12-h shift rosters (see Tables 4 and 5). As previous studiesClocks&Sleep 2019, 1 228
of managerial and low-strain occupations demonstrated a preference to a shorter and condensed
workweek despite the hardship of enduring long work shifts, we hypothesized that:
(1) Shift length is associated with burnout, self-reported sleep quality, and objective measures
of sleep duration and efficiency. Compared to the 8-h shift roster, we expected to observe decreased
burnout, improved sleep quality, and longer sleep duration and efficiency following the transition to a
12-h shift roster.
(2) Shift length is associated with the level of sleepiness recorded during day and night shifts.
We expected to observe that sleepiness would increase following the transition from an 8-h to a 12-h
shift roster.
2. Results
2.1. Background Variables
Thirty-nine participants (20 males and 19 females) completed the study (mean ± standard deviation
for age: 38.94 ± 8.24; body mass index (BMI): 24.72 ± 3.28; education in years: 14.72 ± 2.06; work
seniority in years: 13.92 ± 7.05). No significant gender differences were found in age, education, or
seniority, whereas BMI was higher (as expected) in males.
2.2. Confounding Variables: Napping and Caffeine
2.2.1. Napping during the 12-h Night Shift
During the 8-h night shifts, participants did not nap. Following the transition to the 12-h roster,
however, 36% reported inadvertent naps (not in compliance with the study protocol) that occurred
during the period with the fewest work demands, between 03:00–04:00 at night. In order to account for
this confounder, we assessed differences between nappers and non-nappers for all outcome variables.
2.2.2. Caffeine Intake during 8/12-h Night Shifts
There was a statistically significant difference in caffeine intake between the two night shifts
(8-h/12-h). Analysis of caffeine across the same hours revealed that on the 12-h night shift, workers
drank more caffeinated beverages than on the 8-h shift (mean ± SD: 3.2 ± 1.1 cups on 12-h shift versus
0.27 ± 0.2 on 8-h shift, t = 26.23, p < 0.001). As the average amount of reported caffeine consumption
was markedly higher on the 12-h compared to the 8-h shift, we conservatively controlled for caffeinated
beverages in the full model (see below) by evaluating the effect of caffeine at 0.5 cups of caffeine per
hour. Sensitivity analysis assessing different amounts per hour (0.25–1.5 cups) did not significantly
change the findings.
2.3. Burnout
Significant differences in burnout were found for shift (Table 1), with decreased burnout during
the 12-h shift roster in all three subscales and the total score: physical strength (p = 0.001), vitality
thinking (p = 0.016), mental energy (p = 0.022), and total score (p = 0.002), indicating lower burnout
during the 12-h as compared to the 8-h shift rosters. Assessing differences between nappers and
non-nappers during the 8-h shift roster, nappers reported a significantly higher level of total burnout
than non-nappers (3.61 ± 1.02 versus 2.82 ± 0.95 respectively, p = 0.021), while no significant differences
were found during the 12-h shift roster (2.25 ± 0.98 versus 2.41 ± 0.96 respectively).Clocks&Sleep 2019, 1 229
ClocksTable
& Sleep1.2019, 1 FOR PEER
Self-reported REVIEW of burnout and sleep quality: comparison between 8- versus 12-hour
measures 4
shift rosters.
Total score 3.12 (1.04) 2.34 (0.96) t = 3.88 p = 0.002 η2 = 0.25
Sleep
8-h Quality (Pittsburgh
Shift 12-h Shift Sleep Quality Statistic,
Index; PSQI)
p-Value, Effect Size
Total score 6.51 (3.88) 4.61 (4.07) t = 3.19 p = 0.003 η2 = 0.25
Burnout
PSQI > 5 75.0% 42.1% X = 5.56
2 p = 0.02 McNemar = 0.02
Physical strength 3.91 (1.36) 2.88 (1.15) F(1,30) = 13.55 p = 0.001 η2 = 0.93
Vitality thinking 2.61 (1.11) 2.06 (1.00) F(1,30) = 6.46 p = 0.016 η = 0.89
2
2.4. Sleep
MentalQuality
energy(PSQI and 2.37Actigraphy)
(1.13) 1.82 (0.93) F(1,30) = 5.79 p = 0.022 η2 = 0.15
Total score 3.12 (1.04) 2.34 (0.96) t = 3.88 p = 0.002 η2 = 0.25
Subjective sleep quality improved based on a decrease in the total PSQI score from a mean ± SD
Sleep Quality (Pittsburgh Sleep Quality Index; PSQI)
of 6.51Total
± 3.88 in the 8-h to6.51
score 4.61 ± 4.07 in the
(3.88) 4.6112-h
(4.07)shift roster (p = 0.003),prespectively
t = 3.19 = 0.003 (seeη2Figure
= 0.25 1 and
Table 1).
PSQI > 5 on the Pittsburgh
Based 75.0% Sleep Quality
42.1% Index (PSQI) X2 = 5.56 p = of
cutoff score >5 for poor
0.02 sleep =quality,
McNemar 0.02
the rate of participants exceeding the cutoff declined from 75% to 42% in the 8-h compared to the 12-
h shift
2.4. rosters,
Sleep respectively
Quality (PSQI and (p = 0.02).
Actigraphy)
As measured by actigraphy, no differences were observed for any of the sleep measures during
Subjective
the main sleep sleep quality
episodes improved
throughout thebased onhowever,
roster; a decreasenaps
in the total PSQI
beyond scoresleep
the main a mean ±
from periods SD
were
of 6.51 ±
longer 3.88in
[time inbed
the 8-h to and
(TIB) ± 4.07
4.61total in the
sleep 12-h
time shift and
(TST)] roster (p =efficiency
sleep 0.003), respectively (see Figure
(SE) was higher in the1 12-h
and
Table 1). Based on the Pittsburgh Sleep Quality Index (PSQI) cutoff score of >5 for poor
compared to the 8-h shift rosters (Table 2). These findings indicate improved subjective sleep quality sleep quality,
the
andrate of participants
improved exceeding
objective the cutoff
sleep quality declined
at home duringfrom 75%
naps to 42%the
during in 12-h
the 8-h
as compared
comparedtotothe the12-h
8-h
shift rosters,
shift rosters. respectively (p = 0.02).
18
16
14
12
10
PSQI
8
6
4
2
0
8H SHIFT 12H SHIFT
Figure 1.1.Changes
Changes in individual
in individual participants'
participants’ total scores
total PSQI PSQI from
scores from
8- to 12-h8- to rosters.
shift 12-h shift rosters.
Continuous
Continuous
line: line:
increased; increased;
dotted dotted line:and
line: decreased; decreased; and dashed
dashed line: line: PSQI
unchanged unchanged PSQI total score.
total score.
As measured
Table by actigraphy,
2. Objective no(time
sleep measures differences weretotal
in bed (TIB), observed for any
sleep time (TST),ofand
thesleep
sleepefficiency
measures during
(SE))
the main sleep
by shift episodes
roster throughout
(8- versus 12-h). the roster; however, naps beyond the main sleep periods were
longer [time in bed (TIB) and total sleep time (TST)] and sleep efficiency (SE) was higher in the 12-h
8-h shift h shift-12 Statistic, p-value, effect size
compared to the 8-h shift rosters (Table 2). These findings indicate improved subjective sleep quality
Day sleep after night shift
and improved objective sleep quality
Time in Bed (hours) 5.34at home
(1.34 ) during naps
4.59 (1.51 ) during the 12-h as
F(1,21) = 3.38
compared
p = 0.08
to the 8-h
η2 = 0.139
shift rosters.
Total Sleep Time (hours) 4.44 (1.16) 3.87 (1.47) F(1,21) = 2.29 p = 0.14 η2 = 0.098
Sleep Efficiency (%) 82.94 (9.13) 83.72 (8.19) F(1,21) = 0.14 p = 0.71 η2 = 0.007
Night sleep after day shift
Time in Bed (hours) 6.34 (1.26) 6.55 (1.31) F(1,13) = 0.204 p = 0.65 η2 = 0.015
Total Sleep Time (hours) 5.44 (1.25) 5.42 (1.18) F(1,13) = 0.002 p = 0.96 η2 = 0.0Clocks&Sleep 2019, 1 230
Table 2. Objective sleep measures (time in bed (TIB), total sleep time (TST), and sleep efficiency (SE))
by shift roster (8- versus 12-h).
8-h Shift 12-h Shift Statistic, p-Value, Effect Size
Day sleep after night shift
Time in Bed (hours) (1.34) 5.34 (1.51) 4.59 F(1,21) = 3.38 p = 0.08 η2 = 0.139
Total Sleep Time (hours) (1.16) 4.44 (1.47) 3.87 F(1,21) = 2.29 p = 0.14 η2 = 0.098
Sleep Efficiency (%) (9.13) 82.94 (8.19) 83.72 F(1,21) = 0.14 p = 0.71 η2 = 0.007
Night sleep after day shift
Time in Bed (hours) (1.26) 6.34 (1.31) 6.55 F(1,13) = 0.204 p = 0.65 η2 = 0.015
Total Sleep Time (hours) (1.25) 5.44 (1.18) 5.42 F(1,13) = 0.002 p = 0.96 η2 = 0.0
Sleep Efficiency (%) (6.20) 82.60 (6.88) 82.63 F(1,13) = 0.001 p = 0.98 η2 = 0.0
Naps (other than main sleep period) during the roster
Time in Bed (hours) (0.71) 2.1 (0.74) 2.59 F(1,9) = 5.7 p = 0.04 η2 = 0.388
Total Sleep Time (hours) (0.51) 1.6 (0.73) 2.08 F(1,9) = 6.47 p = 0.03 η2 = 0.418
Sleep Efficiency (%) (7.41) 72.61 (9.47) 79.78 F(1,9) = 7.57 p = 0.02 η2 = 0.457
No differences were found between nappers versus non-nappers for the PSQI-total score during
the 8-h (6.38 ± 4.27 versus 6.58 ± 3.32) and the 12-h (3.63 ± 2.82 versus 5.79 ± 4.7) shift rosters,
respectively. No differences were observed between nappers and non-nappers during the 8-h shift
roster in any of the objective sleep measures. During the 12-h shift roster, sleep efficiency was higher for
the non-nappers (89.31 ± 5.25) than for the nappers (80.53 ± 7.96, p < 0.016, with Bonferroni correction).
These findings demonstrate that nappers experience lower objective sleep efficiency at home during
the 12-h shift rosters compared to non-nappers.
2.5. Sleepiness
2.5.1. Day Shift Sleepiness by Shift and Hour
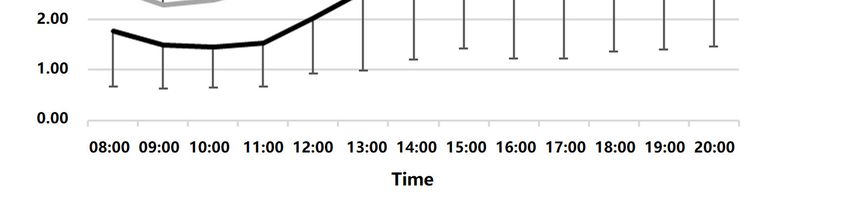
As the 12-h shift started at 08:00, and the 8-h shift started at 07:00, mixed model analyses for
sleepiness during day shifts were performed both by clock time (starting at 08:00) and by number of
hours from the beginning of the shift. As results were highly similar (near-identical), we reported
clock time only. Tests of within- subject effects showed main effects for shift (F(1,116) = 19.75, p < 0.001),
and hour (F(8,403) = 6.92, p < 0.001) with no interaction. Mean ± standard error (SE) was 3.14 ± 0.19
for 8-h and 2.05 ± 0.20 for 12-h. Sleepiness levels between 08:00–11:00 were significantly lower than
between 12:00–16:00 (see Figure 2A). There were no significant differences in caffeine consumption
between 8-h versus 12-h day shifts (mean 0.32 ± 0.25 cups on 12-h versus 0.27 ± 0.23 on 8-h shifts) or in
sleepiness between nappers and non-nappers during either the 8-h (nappers: 3.75 ± 1.91; non-nappers:
2.65 ± 0.86) or the 12-h (nappers: 2.30 ± 1.01; non-nappers: 1.92 ± 0.82) day shifts. Therefore, we did
not control for caffeine or naps. Findings indicate that sleepiness increased throughout both day shifts
and that sleepiness was reduced following the transition from 8-h to 12-h shifts.between 12:00–16:00 (see Figure 2A). There were no significant differences in caffeine consumption
between 8-h versus 12-h day shifts (mean 0.32 ± 0.25 cups on 12-h versus 0.27 ± 0.23 on 8-h shifts) or
in sleepiness between nappers and non-nappers during either the 8-h (nappers: 3.75 ± 1.91; non-
nappers: 2.65 ± 0.86) or the 12-h (nappers: 2.30 ± 1.01; non-nappers: 1.92 ± 0.82) day shifts. Therefore,
we did not2019,
Clocks&Sleep control
1 for caffeine or naps. Findings indicate that sleepiness increased throughout both231
day shifts and that sleepiness was reduced following the transition from 8-h to 12-h shifts.
Clocks & Sleep 2019, 1 FOR PEER REVIEW A 6
B
Figure
Figure 2.2. (A). Dayshift
A. Day shiftsleepiness
sleepiness(Karolinska
(KarolinskaSleepiness
SleepinessScale;
Scale; KSS)
KSS) during
during the 8- versus the 12-h shift
shift
rosters.
rosters. (B). Nightshift
B. Night shiftsleepiness
sleepiness(KSS)
(KSS)during
duringthe
the8-8-versus
versusthe
the12-h
12-hshift
shiftrosters.
rosters.
2.5.2. Night Shift Sleepiness by Shift and Hour
2.5.2. Night Shift Sleepiness by Shift and Hour
No significant differences were found in sleepiness between the two night shifts recorded during
No significant differences were found in sleepiness between the two night shifts recorded during
each roster; therefore, hourly Karolinska Sleepiness Scale (KSS) was averaged over the two nights in
each roster; therefore, hourly Karolinska Sleepiness Scale (KSS) was averaged over the two nights in
each roster. Mixed models analysis was performed between 00:00–07:00, the clock hours that were
each roster. Mixed models analysis was performed between 00:00–07:00, the clock hours that were
included in both 8-h and 12-h shifts. Tests of within-subject effects showed a significant main effect for
included in both 8-h and 12-h shifts. Tests of within-subject effects showed a significant main effect
hour (F(7,432) = 6.95, p < 0.001) but no main effect for shift (F(1,136) = 0.03, p = 0.87), and a main effect for
for hour (F(7,432) = 6.95, p < 0.001) but no main effect for shift (F(1,136) = 0.03, p = 0.87), and a main effect
the hour*shift interaction (F(7,412) = 2.40, p = 0.02; Figure 2B). Sleepiness levels between 00:00–01:00
for the hour*shift interaction (F(7,412) = 2.40, p = 0.02; Figure 2B). Sleepiness levels between 00:00-01:00
were significantly lower than those between 03:00–07:00. Post hoc testing of the hour*shift interaction
were significantly lower than those between 03:00–07:00. Post hoc testing of the hour*shift interaction
revealed no statistically significant hourly differences between shifts, with the exception of 03:00, when
revealed no statistically significant hourly differences between shifts, with the exception of 03:00,
subjects were sleepier on the 12-h shift (mean ± SE KSS during 8-h: 3.10 ± 0.27 versus 12-h: 3.88 ± 0.31,
when subjects were sleepier on the 12-h shift (mean ± SE KSS during 8-h: 3.10 ± 0.27 versus 12-h: 3.88
p = 0.052).
± 0.31, p = 0.052).
Night Shift Sleepiness by Shift, Hour, Nap, and Caffeine
2.5.2.1. Night Shift Sleepiness by Shift, Hour, Nap, and Caffeine
Due to the confounding effects of caffeine intake and inadvertent naps during the 12-h shifts only
Due to the confounding effects of caffeine intake and inadvertent naps during the 12-h shifts
(see Section 2.2), we adjusted the night shift sleepiness model for both caffeine and naps. In the full
only (see Section 2.2.), we adjusted the night shift sleepiness model for both caffeine and naps. In the
model including all predictors (Table 3), main effects were found for hour (F(7,355) = 2.13, p = 0.04),
full model including all predictors (Table 3), main effects were found for hour (F(7,355) = 2.13, p = 0.04),
for shift (F(1,226) = 184.51, p < 0.001), for nap (F(1,78) = 9.81, p = 0.002), and for caffeine (F(1,388) = 46.51,
for shift (F(1,226) = 184.51, p < 0.001), for nap (F(1,78) = 9.81, p = 0.002), and for caffeine (F(1,388) = 46.51, p <
p < 0.001). There were significant two-way interactions for hour*shift (F(7,344) = 2.24, p = 0.03),
0.001). There were significant two-way interactions for hour*shift (F(7,344) = 2.24, p = 0.03), hour*nap
hour*nap (F(7,359) = 2.10, p = 0.04), shift*caffeine (F(1,386) = 76.07, p < 0.001), and a significant three-way
(F(7,359) = 2.10, p = 0.04), shift*caffeine (F(1,386) = 76.07, p < 0.001), and a significant three-way
shift*nap*caffeine interaction (F(1, 325) = 7.26, p < 0.001). No other two-way and three-way
interactions were found.Clocks&Sleep 2019, 1 232
shift*nap*caffeine interaction (F(1, 325) = 7.26, p < 0.001). No other two-way and three-way interactions
were found.
Table 3. Mixed model for sleepiness during the night shift by Shift, Hour, Nap, and Caffeine consumption.
Mean SE F(df) p
Shift
8-h 3.09 0.14 184.50 (1,226)Clocks&Sleep 2019, 1 233
Clocks & Sleep 2019, 1 FOR PEER REVIEW 8
8- h shift at 1:00 8- h shift at 3:00 8- h shift at 5:00
5.0 5.0
5.0
4.0 4.0
4.0
KSS
3.0
KSS
KSS
3.0 3.0
2.0 2.0
2.0
1.0 1.0 1.0
0.00 1.00 2.00 3.00 0.00 1.00 2.00 3.00 0.00 1.00 2.00 3.00
Caffeine (cups) Caffeine (cups) Caffeine (cups)
Nappers Non-nappers
12- h shift at 1:00 12- h shift at 3:00 12- h shift at 5:00
5.0 5.0
5.0
4.0 4.0
4.0
KSS
KSS
3.0 KSS 3.0
3.0
2.0 2.0
2.0
1.0 1.0
1.0
0.00 1.00 2.00 3.00 4.00 0.00 1.00 2.00 3.00 4.00
0.00 1.00 2.00 3.00 4.00
Caffeine (cups) Caffeine (cups) Caffeine (cups)
Figure Associations
3. 3.
Figure between
Associations cups
between ofof
cups caffeine and
caffeine sleepiness
and in in
sleepiness nappers versus
nappers non-nappers
versus during
non-nappers 8-h8-h
during versus 12-h
versus night
12-h shifts
night at 01:00,
shifts 03:00,
at 01:00, and
03:00, 05:00.
and 05:00.Clocks&Sleep 2019, 1 234
3. Discussion
When comparing functional outcomes due to transitions in the length of shifts, it is important
to consider additional changes that are implemented in connection with the transition. In order to
maintain a comparable number of weekly work hours, 12-h shift rosters in effect compress the number
of work days in the week [21]. Other changes include shift start time [8] and breaks and rest periods [6].
These and other changes may be considered necessary adaptations in the workplace, but they challenge
research efforts to tease apart the effects of the separate constituents on relevant functional outcomes.
Indeed, reviews comparing functional outcomes based on shift length have stressed the need to
comprehensively explore the complex interactions between the various factors [7,21].
In the present study, burnout was lower and subjective sleep quality was higher following the
transition from the 8-h to the 12- shift roster. Sleepiness increased throughout both day and night shifts
and was higher during the 8-h than the 12-h day and night shifts. Sleepiness increased throughout the
8-h night shift, whereas during the 12-h night shift, sleepiness was attenuated, likely due to inadvertent
napping of some of the participants.
In line with our first hypothesis, burnout on all three subscales and total score improved, as did
subjective sleep quality, following the transition from the 8-h to the 12-h shift roster. The rate of workers
who exceeded the cutoff score for poor sleep quality was lower in the 12-h than in the 8-h shift roster.
These results indicate decreased burnout and better sleep quality following the transition from the 8-h
to the 12-h shift rosters. However, actigraphy-based sleep measures did not differ between rosters,
with the exception of naps outside the main sleep periods, which showed improved sleep measures
(longer time in bed, longer sleep duration, and higher sleep efficiency) during the 12-h shift roster.
Interestingly, 36% of workers reported inadvertent naps during the 12-h night shift, between
03:00–04:00 at night. To account for this potential confounder, we compared all outcome measures
in nappers and non-nappers during both rosters. Burnout was higher among the nappers during
the 8-h but not the 12-h shift roster, whereas sleep efficiency (measured at home) was higher among
non-nappers compared to nappers during the 12-h shift roster only. These findings suggest that nappers
and non-nappers are qualitatively different in their adaptation strategies to shiftwork. Nappers may
have more difficulty adjusting to the short 8-h shift roster, as indicated by increased reported burnout;
however, during the 12-h shift roster, burnout was no longer higher in nappers than in non-nappers.
Furthermore, during the 12-h night shift, nappers took advantage of the opportunity to nap, yet their
sleep efficiency at home was compromised. It is likely that individual differences that are associated
with adaptation to shiftwork, such as age, chronotype, cognitive arousal, responsibilities, and sleep
opportunities at home, may underlie these different adaptation strategies [22,23].
Our hypothesis regarding the association between sleepiness and shift length was not supported.
During the day shift, sleepiness was lower during the 12-h shift than during the 8-h shift. During the
night shift, shift length interacted with hour such that during the 8-h shift, sleepiness initially decreased
(at 01:00) and subsequently increased linearly, whereas during the 12-h shift, a quadratic function was
observed, thus sleepiness showed an increase followed by a plateau, a decrease, and finally, no change.
This decrease in sleepiness in the 12-h shift is likely due to the inadvertent naps reported by some
of the workers (36%) (despite being clearly non-adherent to study protocol). However, findings also
show increased sleepiness in nappers compared to non-nappers, particularly between 02:00–07:00.
In a previous study comparing sleepiness and performance with and without a 30-minute nap in
a simulated night shift, alertness and performance improved in the nap compared to the no-nap
condition following an initial decline due to sleep inertia following the nap [24]. As napping was not
part of the study design, and as only about one third of our sample reported napping, and it was only
during the 12-h shift, we are unable to draw any firm conclusions regarding the temporal dynamics of
sleepiness with and without naps during 8-h and 12-h shifts.
We have previously demonstrated the efficacy of naps during the night shift on sleepiness and
performance [25]. In a study of shift working hospital nurses, a short scheduled nap benefited both
sleepiness and performance regardless of individual differences such as age and chronotype [25]. In theClocks&Sleep 2019, 1 235
present study, workers were not expected to nap; however, it appears that nappers were compelled to
do so, likely due to increased sleepiness compared to non-nappers.
Another common strategy to cope with sleepiness during the night shift is caffeine
consumption [26]. In the present study, dramatically higher caffeine consumption during the 12-h
as compared to the 8-h night shift may indicate that workers anticipated and experienced greater
sleepiness during the 12-h shift due to the extended hours that began three hours earlier than the 8-h
shift and attempted to battle this sleepiness by increasing their caffeine consumption. However, when
evaluating the relationships between caffeine and sleepiness in nappers and non-nappers, we find that
increased caffeine was associated with reduced sleepiness only in the non-nappers during the 8-h shift,
whereas sleepiness increased with caffeine consumption in both nappers and non-nappers during the
12-h shift, suggesting that caffeine was not effective in combating sleepiness. Whether these findings
suggest individual differences in sleepiness, anticipation, behavioral adaptation to shiftwork, or other
individual trait-like features is currently unclear. Individual trait-like vulnerability to sleep loss has
been suggested in experimentally induced sleep deprivation protocols [27] and in nighttime shiftwork
studies [22,28].
This study has some limitations. Due to management considerations of the airline company, we
were not able to conduct a crossover design, and therefore order effects (i.e., a shift from 8- to 12-h
versus a shift from 12- to 8-h shift rosters) could not be assessed. Furthermore, self-report measures are
subject to bias, and in the present study, reported caffeine consumption was particularly high during
the 12-h shift. Nevertheless, controlling for caffeine consumption did not substantially affect the main
findings. We also cannot rule out the possibility that some participants failed to report inadvertent
napping. Additionally, the day shift began one hour later, at 08:00 rather than 07:00 during the 12-h
roster. Although we found no differences in outcome measures when computing by clock time rather
than by shift start time, it is likely that any differences in outcome measures may be attributed to the
additional hour at home during the day, which may be devoted to family activities or an additional
hour of sleep, rather than to the difference in shift length. Another limitation is the small number of
workers we followed. Thus, our results should be cautiously interpreted, as they may not be indicative
of the true effect due to low statistical power. Finally, participants may have been subject to expectation
bias, i.e., their improved self-report assessments following the transition to the 12-h shift roster may
reflect expectations of the organization and the work environment. Anecdotal evidence obtained by
incidental conversations between participants and members of the research team suggested that most
of the participants were in favor of the transition. However, it is not possible to determine whether or
not these reports were biased by organizational considerations.
Notably, any transition in shift length ultimately affects several other parameters in the work
schedule, e.g., start times of each of the shifts, number of shifts per 24 hours, number of work shifts per
week, number of commutes per week, order of scheduled shifts and days off, etc. Therefore, it is not
entirely possible to separate the distinct characteristics of the two rosters and their relative effects on
study outcomes. These limitations are inherent to field studies, which nevertheless provide valuable
insights to management, policy makers, and employees.
In conclusion, the transition from 8-h to 12-h shift rosters was associated with lower burnout,
improved subjective evaluation of sleep quality, and improved quality of naps in the home environment.
Sleepiness was lower during the 12-h compared to the 8-h shift roster during both day and night shifts.
The effects of shift on sleepiness interacted with caffeine and napping, suggesting that behavioral
strategies aimed to combat night shift sleepiness differentially affected sleepiness depending on shift
length. Findings highlight that in addition to factors inherent to scheduling changes, individual
differences and behavioral choices should also be taken into consideration as factors that contribute to
the outcomes of scheduling changes in the work environment.Clocks&Sleep 2019, 1 236
4. Materials and Methods
4.1. Study Design
The study was a within-subject prospective repeated measures design comparing measures of
burnout, sleep, and sleepiness during 8-h versus 12-h shift rosters. As the study was performed in a
real-life setting, it was not possible to counterbalance. All participants were initially assessed during
their usual 8-h shift roster and reassessed three months after the transition to a 12-h shift roster.
4.2. Participants
Thirty-nine permanent employees (19 men and 20 women) were recruited from airline ground
crew managers at the Ben-Gurion International Airport. All employees worked on rotating shifts
full-time and had at least one year of experience in shiftwork.
Exclusion criteria included active chronic disease affecting daily functioning, regular use of
medication that affects level of alertness, employees with a child ≤1 year of age, and pregnancy.
The ethics committee at Haifa University approved this study (approval # 026/14), and all participants
signed informed consent.
4.3. Measures
1. Shirom Melamed Burnout Measure (SMBM) [29,30]. Burnout levels were measured using
a 14-item questionnaire that included three subscales: physical fatigue, emotional exhaustion, and
cognitive weariness. The participants were asked to rate their feelings during the past month on a scale
of 1 (almost never) to 7 (almost always); a higher score indicated higher levels of burnout (Cronbach’s
alpha 0.94 and 0.95 for 8- versus 12-h shift rosters, respectively).
2. Pittsburgh Sleep Quality Index (PSQI) [31,32]. The self-report questionnaire included 19
items grouped into 7 subscales on a 4-point scale (0–3, including subjective sleep quality, sleep latency,
sleep duration, sleep efficiency, sleep disorders, use of sleep medications, and daily function) and
summed to obtain a total score (total score >5 indicates poor sleep quality). Cronbach’s alpha was 0.71
and 0.83 for 8- versus 12-h shift rosters, respectively. In the current study, we used the total score as a
continuous measure, and the cutoff score was used to dichotomize participants with/without poor
sleep quality.
3. Activity monitoring: Objective sleep patterns were measured using an activity monitoring
device (Actiwatch 2, Phillips Respironics). This small wrist-worn device measures sleep patterns
continuously in the natural environment and provides objective data for sleep patterns. Actiwatch
output included 3 averaged variables for major sleep episodes and naps, as measured by the Actiwatch
algorithm: time in bed (TIB, determined by event markers provided by participants when retiring to
and getting out of bed), total sleep time (TST, hours from sleep onset until wake-up time), and sleep
efficiency (SE, the percentage of sleep minutes out of time in bed).
4. Karolinska Sleepiness Scale (KSS) [33]. Participants ranked their level of sleepiness from 1
to 9: 1 = very alert; 3 = alert; 5 = neither alert nor sleepy; 7 = sleepy, but no effort required to stay
awake; 9 = very sleepy, great effort required to stay awake. The KSS is widely used and has high
content validity.
5. Caffeine intake: To control for the alerting effects of caffeine, participants reported their hourly
caffeine consumption during the day and the night shift (number of cups of caffeinated beverages).
4.4. Procedure
The 8-shift roster included 11 days and nights, and the 12-hour shift roster included 7 days
and nights (see Tables 4 and 5). All participants were first tested during their usual 8-h shift roster
and again under the 12-h shift roster after three months following the transition from 8- to 12-h
shift rosters. Burnout (SMBM) and sleep quality (PSQI) measurements were completed once at the
beginning of data collection for each of the two rosters (8/12). Participants wore the Actiwatch for theClocks&Sleep 2019, 1 237
continuous collection of sleep measures during the full respective rosters. Subjective sleepiness (KSS)
was measured hourly throughout two night shifts and one day shift per roster.
Table 4. 8-h shift roster structure.
Day Night Free Free Evening Evening Evening
Day Shift Day Shift Night Shift Night Shift
Shift Shift Day Day Shift Shift Shift
Start of Day Night 1 Night 2
End of roster
roster assessment assessment assessment
Table 5. 12-h shift roster structure.
Day Shift Night Shift Free Day Free Day Day Shift Night Shift Free Day
Start of Night 1 Day Night 2
End of roster
roster assessment assessment assessment
4.5. Data Analysis
Statistical analyses were performed using the IBM SPSS Statistics version 21. To assess differences
in sleep and burnout measures in 8-h and 12-h shift rosters, differences in the 3 burnout subscales were
tested using repeated measures analysis, and differences in burnout and subjective sleep quality total
scores were tested using paired t-tests. The rate of participants exceeding the PSQI cutoff score between
8-h and 12-h shift rosters were tested by chi-square. Differences in objective sleep patterns were tested
using repeated measures analysis. Differences in sleepiness during day and night shifts in both rounds
were tested using repeated measures analysis of the overlapping hours. Since there were no significant
differences between the two recorded nights in sleepiness, a mean was calculated for each overlapping
hour in both night shifts per roster. Mixed models were performed to assess differences in sleepiness
levels by hour (clock time), shift (8/12), nap (nappers/non-nappers), and caffeine (number of cups of
caffeinated beverages per hour), for parallel hours of both shift rosters (night shift: 00:00–07:00; day
shift: 08:00–16:00).
Author Contributions: Conceptualization: A.R., M.B.Y., T.S., O.T.; Methodology: O.T., T.S., Investigation: S.S-H.;
Resources: A.R., M.B.Y.; Data curation: S. S-H; Formal analysis: O.T., T.S., S. S-H.; Writing - original draft
preparation: T.S., O.T., S. S-H.; Reviewing and editing: T.S., O.T.; Visualization: T.S., O.T., S. S-H.; Supervision: S.
S-H.; Project administration: A.R., M.B.Y.; Funding acquisition: A.R., M.B.Y.
Funding: The El Al management funded the purchase of the activity monitors.
Acknowledgments: The authors thank the El Al senior management for their support, and the ground crew
managers who volunteered to participate in the study.
Conflicts of Interest: The authors declare no conflict of interest. The funders had no role in the design of the
study; in the collection, analyses, or interpretation of data; in the writing of the manuscript, or in the decision to
publish the results.
Abbreviations
8-h 8-hour
12-h 12-hour
SMBM Shirom-Melamed Burnout Measure
PSQI Pittsburgh Sleep Quality Index
KSS Karolinska Sleepiness Scale
References
1. Reid, K.J.; Weng, J.; Ramos, A.R.; Zee, P.C.; Daviglus, M.; Mossavar-Rahmani, Y.; Sotres-Alvarez, D.;
Gallo, L.C.; Chirinos, D.A.; Patel, S.R. Impact of Shift Work Schedules on Actigraphy-Based Measures of
Sleep in Hispanic Workers: Results from the Hispanic Community Health Study/Study of Latinos Ancillary
Sueño Study. Sleep 2018, 41, 1–8. [CrossRef] [PubMed]Clocks&Sleep 2019, 1 238
2. Voinescu, B.I. Common Sleep, Psychiatric, and Somatic Problems According to Work Schedule: An Internet
Survey in an Eastern European Country. Int. J. Behav. Med. 2018, 456–464. [CrossRef] [PubMed]
3. Vedaa, Ø.; Mørland, E.; Larsen, M.; Harris, A.; Erevik, E.; Sivertsen, B.; Bjorvatn, B.; Waage, S.; Pallesen, S.
Sleep Detriments Associated with Quick Returns in Rotating Shift Work. J. Occup. Environ. Med. 2017, 59,
522–527. [CrossRef] [PubMed]
4. Åkerstedt, T.; Kecklund, G. What Work Schedule Characteristics Constitute a Problem to the Individual? A
Representative Study of Swedish Shift Workers. Appl. Ergon. 2017, 59, 320–325. [CrossRef] [PubMed]
5. Ihlström, J.; Kecklund, G.; Anund, A. Split-Shift Work in Relation to Stress, Health and Psychosocial Work
Factors among Bus Drivers. Work 2017, 56, 531–538. [CrossRef]
6. Dall’Ora, C.; Griffiths, P.; Ball, J.; Simon, M.; Aiken, L.H. Association of 12 h Shifts and Nurses’ Job Satisfaction,
Burnout and Intention to Leave: Findings from a Cross-Sectional Study of 12 European Countries. BMJ Open
2015, 5, e008331. [CrossRef] [PubMed]
7. Ferguson, S.A.; Dawson, D. 12-h or 8-h Shifts? It Depends. Sleep Med. Rev. 2012, 16, 519–528. [CrossRef]
8. Tucker, P.; Macdonald, I.; Folkard, S.; Smith, L. The Impact of Early and Late Shift Changeovers on Sleep,
Health, and Well-Being in 8- and 12-Hour Shift Systems. J. Occup. Health Psychol. 1998, 3, 265–275. [CrossRef]
9. Smith, L.; Folkard, S.; Tucker, P.; Macdonald, I. Work Shift Duration: A Review Comparing Eight Hour and
12 Hour Shift Systems. Occup. Environ. Med. 1998, 55, 217–229. [CrossRef]
10. Mitchell, R.J.; Williamson, A.M. Evaluation of an 8 Hour versus a 12 Hour Shift Roster on Employees at a
Power Station. Appl. Ergon. 2000, 31, 83–93. [CrossRef]
11. Oh, J.-I.; Yim, H.W. Association between Rotating Night Shift Work and Metabolic Syndrome in Korean
Workers: Differences between 8-Hour and 12-Hour Rotating Shift Work. Ind. Health 2018, 56, 40–48.
[CrossRef]
12. Peacock, B.; Glube, R.; Miller, M.; Clune, P. Police Officers’ Responses to 8 and 12 Hour Shift Schedules.
Ergonomics 1983, 26, 479–493. [CrossRef]
13. Rosa, R.R.; Colligan, M.J.; Lewis, P. Extended Workdays: Effects of 8-Hour and 12-Hour Rotating Shift
Schedules on Performance, Subjective Alertness, Sleep Patterns, and Psychosocial Variables. Work Stress
1989, 3, 21–32. [CrossRef]
14. Rosa, R.R. Performance, Alertness, and Sleep after 3·5 Years of 12 h Shifts: A Follow-up Study. Work Stress
1991, 5, 107–116. [CrossRef]
15. Rosa, R.R.; Bonnet, M.H. Performance and Alertness on 8 h and 12 h Rotating Shifts at a Natural Gas Utility.
Ergonomics 1993, 36, 1177–1193. [CrossRef]
16. Williamson, A.M.; Gower, C.G.I.I.; Clarke, B.C. Changing the Hours of Shiftwork: A Comparison of 8- and
12-Hour Shift Rosters in a Group of Computer Operators∗. Ergonomics 1994, 37, 287–298. [CrossRef]
17. Stimpfel, A.W.; Sloane, D.M.; Aiken, L.H. The Longer The Shifts For Hospital Nurses, The Higher The Levels
Of Burnout And Patient Dissatisfaction. Health Aff. 2012, 31, 2501–2509. [CrossRef]
18. Estryn-Béhar, M.; Van Der Heijden, B.I.J.M. Effects of Extended Work Shifts on Employee Fatigue, Health,
Satisfaction, Work/Family Balance, and Patient Safety. Work 2012, 41 (Suppl. 1), 4283–4290.
19. Stone, P.W.; Du, Y.; Cowell, R.; Amsterdam, N.; Thomas, A.; Linn, R.W.; Gladstein, A.; Walsh, M.; Mojica, L.A.
Comparison of Nurse, System and Quality Patient Care Outcomes in 8-Hour and 12-Hour Shifts. Med. Care
2016, 44, 1099–1106. [CrossRef]
20. Portela, L.F.; Luna, C.K.; Rotenberg, L.; Silva-Costa, A.; Toivanen, S.; Araújo, T.; Griep, R.H. Job Strain and
Self-Reported Insomnia Symptoms among Nurses: What about the Influence of Emotional Demands and
Social Support? Biomed Res. Int. 2015, 2015, 1–8. [CrossRef]
21. Dall’Ora, C.; Ball, J.; Recio-Saucedo, A.; Griffiths, P. Characteristics of Shift Work and Their Impact on
Employee Performance and Wellbeing: A Literature Review. Int. J. Nurs. Stud. 2016, 57, 12–27. [CrossRef]
22. Zion, N.; Drach-Zahavy, A.; Shochat, T. Who Is Sleepier on the Night Shift? The Influence of Bio-Psycho-Social
Factors on Subjective Sleepiness of Female Nurses during the Night Shift. Ergonomics 2018, 61, 1004–1014.
[CrossRef]
23. Zion, N.; Shochat, T. Cognitive Functioning of Female Nurses during the Night Shift: The Impact of Age,
Clock Time, Time Awake and Subjective Sleepiness. Chronobiol. Int. 2018, 35, 1595–1607. [CrossRef]
[PubMed]Clocks&Sleep 2019, 1 239
24. Tremaine, R.; Dorrian, J.; Lack, L.; Lovato, N.; Ferguson, S.; Zhou, X.; Roach, G. The Relationship
between Subjective and Objective Sleepiness and Performance during a Simulated Night shift with a
Nap Countermeasure. Appl. Ergon. 2010, 42, 52–61. [CrossRef] [PubMed]
25. Zion, N.; Shochat, T. Let Them Sleep: The Effects of a Scheduled Nap during the Night Shift on Sleepiness
and Cognition in Hospital Nurses. J. Adv. Nurs.. (Acceptance). [CrossRef] [PubMed]
26. Centofanti, S.; Banks, S.; Colella, A.; Dingle, C.; Devine, L.; Galindo, H.; Pantelios, S.; Brkic, G.; Dorrian, J.
Coping with Shift Work-Related Circadian Disruption: A Mixed-Methods Case Study on Napping and
Caffeine Use in Australian Nurses and Midwives. Chronobiol. Int. 2018, 35, 853–864. [CrossRef]
27. Van Dongen, H.P.A.; Baynard, M.D.; Maislin, G.; Dinges, D.F. Systematic Interindividual Differences in
Neurobehavioral Impairment from Sleep Loss: Evidence of Trait-Like Differential Vulnerability. Sleep 2004,
27, 423–433.
28. Van Dongen, H.P.A.; Caldwell, J.A.; Caldwell, J.L. Investigating Systematic Individual Differences in
Sleep-Deprived Performance on a High-Fidelity Flight Simulator. Behav. Res. Methods 2006, 38, 333–343.
[CrossRef]
29. Shirom, A.; Melamed, S. A Comparison of the Construct Validity of Two Burnout Measures in Two Groups
of Professionals. Int. J. Stress Manag. 2006, 13, 176–200. [CrossRef]
30. Armon, G.; Shirom, A.; Shapira, I.; Melamed, S. On the Nature of Burnout–insomnia Relationships: A
Prospective Study of Employed Adults. J. Psychosom. Res. 2008, 65, 5–12. [CrossRef]
31. Buysse, D.J.; Reynolds, C.F.; Monk, T.H.; Berman, S.R.; Kupfer, D.J. The Pittsburgh Sleep Quality Index: A
New Instrument for Psychiatric Practice and Research. Psychiatry Res. 1989, 28, 193–213. [CrossRef]
32. Shochat, T.; Tzischinsky, O.; Oksenberg, A.; Peled, R. Validation of the Pittsburgh Sleep Quality Index Hebrew
Translation (PSQI-H) in a Sleep Clinic Sample. Isr. Med. Assoc. J. 2007, 9, 853–856.
33. Åkerstedt, T.; Gillberg, M. Subjective and Objective Sleepiness in the Active Individual. Int. J. Neurosci. 1990,
52, 29–37. [CrossRef] [PubMed]
© 2019 by the authors. Licensee MDPI, Basel, Switzerland. This article is an open access
article distributed under the terms and conditions of the Creative Commons Attribution
(CC BY) license (http://creativecommons.org/licenses/by/4.0/).You can also read