Cairns Regional Council State of the Environment Report 2008/2009
←
→
Page content transcription
If your browser does not render page correctly, please read the page content below
Cairns Regional Council
State of the Environment Report
                      2008/2009

            1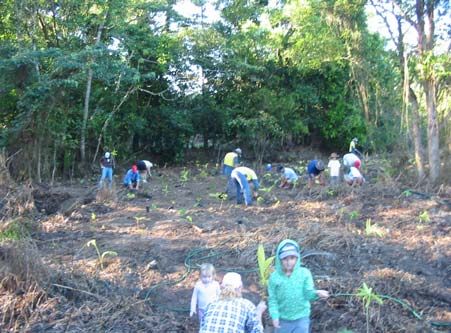
Table of Contents
Introduction .......................................................................................................................................... 3
      Environmental Indicators ........................................................................................................... 3
      Environmental Sustainability Group ......................................................................................... 3
      Liveability Indicators .................................................................................................................. 3
      At a Glance .................................................................................................................................. 4
Water ..................................................................................................................................................... 6
      Water Demand Management ...................................................................................................... 6
      Water Conservation Policy ........................................................................................................ 6
      Recycled Water Policy ................................................................................................................ 7
      Water Savings in Council Amenities ........................................................................................ 7
Climate Change and Sustainability..................................................................................................... 7
What is Council doing?........................................................................................................................ 8
      Greenhouse Gas Mitigation –Cities for Climate Protection .................................................... 8
      Local Adaptation Pathways Program ..................................................................................... 10
      ClimateSmart Home Living Program ...................................................................................... 11
      Energy and Emissions Information Management Project .................................................... 12
      Earth Hour ................................................................................................................................. 12
      Corporate Sustainability Policy .............................................................................................. 13
      Grid Connect Solar PV systems ............................................................................................. 13
      Solar Toolkits ........................................................................................................................... 14
      Biodiversity................................................................................................................................ 14
      Biodiversity in Our Region ...................................................................................................... 14
      Community Coastcare .............................................................................................................. 16
      Revegetation of Saltwater Creek Catchments, Mossman Golf Club .................................... 16
      Riparian Rehabilitation, Reef Rescue ..................................................................................... 16
      Feral Pig Control ....................................................................................................................... 17
      Council Services ...................................................................................................................... 17
      Urban Mangrove Management Strategy ................................................................................. 17
Waste................................................................................................................................................... 18
      Waste Strategy ......................................................................................................................... 18
      Glass Crusher ........................................................................................................................... 19
      Recycling in our community ................................................................................................... 20
Human Settlements............................................................................................................................ 20
      Mount Peter Master Planning .................................................................................................. 20
      Port Douglas Waterfront Master Planning ............................................................................. 21
      Character and Heritage Study ................................................................................................. 22
      Introduction of the Erosion and Sediment Control (ESC) ..................................................... 23
      Building Industry Environmental Awareness Campaign....................................................... 23
      Legislative Changes ................................................................................................................ 24
Liveability............................................................................................................................................ 24
A Snap Shot of the Cairns Population.............................................................................................. 24
      Population Change ................................................................................................................... 26
      Cairns Regional Council........................................................................................................... 26
      Queensland ............................................................................................................................... 26
      Housing Updates....................................................................................................................... 26
Measures on Affordability ................................................................................................................ 27
      Unemployment .......................................................................................................................... 29
Measures on Accessibility................................................................................................................. 30
Measures on Diversity ...................................................................................................................... 31
Measures on Equity .......................................................................................................................... 33
      Socio-Economic Index of Disadvantage ................................................................................. 33
Measures on Amenity and Well Being.............................................................................................. 34
Measures on Good Leadership ......................................................................................................... 35
Measures of a Great Place to Live .................................................................................................... 38

                                                                             2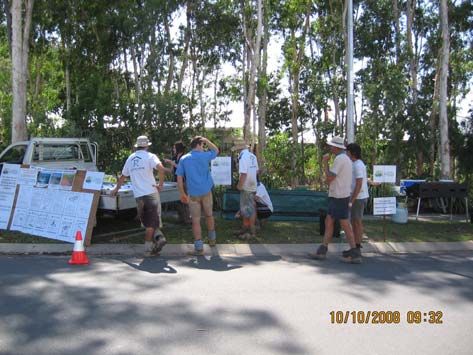
Introduction
Cairns Regional Council is committed to producing a State of the Environment (SoE) report
each year as part of its annual reporting process to the community.

State of Environment reports are critical tools that aim to help drive regional strategic change
towards best practice management of the environment.

The overall aim of a State of the Environment (SoE) Report is to report on environmental
indicators to provide environmental information in a consolidated source. The 2008/09 SoE
Report is the synthesis of efforts by Council to address its environmental duty and deliver a
transparent statement of Council’s performance during the year.

This report provides an information base to support the community, industry and Government
in working towards improved environmental management and the sustainable use of our
resources.

The following document offers an insight to local data, along with Council initiatives and
partnerships as it progresses the goal of caring for the environment.

In a region such as Far North Queensland our environment is also a key economic driver –
meaning there is so much more at stake for both Government and the community. Council
seeks to build on the following initiatives in coming years to help effect sustainable change and
environmental resilience.

Environmental Indicators
Environmental indicators are necessary to monitor the condition of the local environment and
the human activities that affect it.

Core environmental indicators for reporting on the state of the environment were developed by
the Environment Reporting Task Force of the Australian and New Zealand Environment and
Conservation Council (ANZECC) in 2000. The indicators used in this SoE Report, although
modified to incorporate the unique character of the Cairns region, are premised upon the core
environmental themes developed by the Department of the Environment and Heritage and are
similar to those used for Commonwealth State of the Environment Reporting (ANZECC 2000).

Environmental Sustainability Group
The information contained in this report has been prepared by Council’s Environmental
Sustainability Group (ESG). The aim of Environmental Sustainability Group (ECG) is to
facilitate information sharing, systems review, environmental issues, review corporate
programs/plan by Executive Management, raising environmental awareness within Council and
to the community.

Liveability Indicators

The indicators used in the Liveability section of this report are an information framework
designed to check the progress the region is making towards becoming ‘the best regional city
in Australia’. From the first Liveability Report in 2005, seven of the original indicators have been

                                                3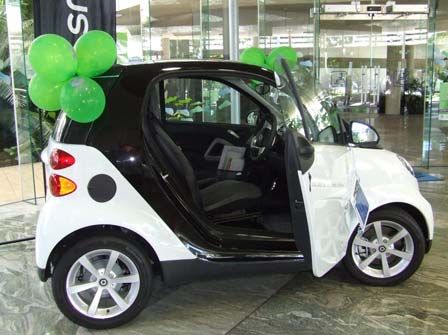
used as these cover a wide range of issues affecting the population. They are: Affordability,
Accessibility, Diversity, Equity, Amenity, Well-being and Good Leadership.

“At a Glance”
The former Cairns City and Douglas Shire Councils amalgamated to become the Cairns
Regional Council in March 2008. The 2008/09 data set is the first complete round of data that
has been complied for Cairns Regional Council. Prior to this most data sets are only available
for the former Cairns City Council.

         Data Category                                      2008/09
         Water
         Compliance with EPA sewage licensing
                                                            97%
         requirements
         Recycled Water Use                                 650ML
         Per capita daily water consumption (residential,
                                                            447L/day
         industrial, commercial and agricultural)
         Average amount of water used per person
                                                            212/L/day
         (residential)
         Energy
         Fuel use by Council Vehicles (diesel/unleaded)     1,733,634
         Diesel (L)                                         1,311,024
         Unleaded (L)                                       422,609
         GHG Emissions from Fuel use tonnes CO2             4,854
         Electricity use by Council (kWh)                   32,094,847
         GHG Emissions from electricity use tonnes CO2      33,761
         Street Lighting (kWh)                              7,119,125
         Buildings (kWh)                                    10,334,749
         Water and Sewage (kWh)                             14,640,973
         Habitat Protection
         Number of plantings by Council                     49,166
         Trees provided to Landcare and community groups    27,689
         Days of watering and maintenance                   221
         Days spent on site preparation                     21
         Number of seedlings potted                         105,675
         Hours spent on seed collection                     248
         Pest Management
         Number of days of pest mapping and survey          25
         Number of Pest Treatments                          325
         Number of declared animals destroyed (feral)       709
         Number Eastern Rainbow Fish Released               Nil
         Number Midge/Mosquito complaints received          1,235

                                               4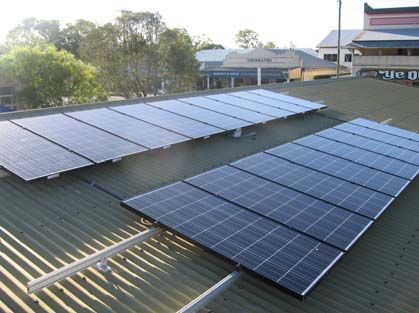
Data Category                                         2008/09
Number of days worked on weed control
Weeds of National significance (assisted days)        99
Class 1 Weeds – Assist State Government (days)        42
High Priority Weeds (days)                            138
Human Settlement
Planning Applications received                        517
Environmentally Relevant Activities licence
                                                      53
approvals
Identification of unlicensed Environmentally
                                                      No data available
Relevant Activities
Total number of Environmentally Relevant Activities   509

Waste to Bedminster/Landfill (tonnes)
Domestic Kerbside Waste to Bedminster                 48,913
Transfer Station General Waste to Bedminster          9,556
Domestic Kerbside Waste to Landfill                   Nil
Transfer Station Waste (inert) to Landfill            2,318
Bio-solids to beneficial re-use                       14,966
Compost Exported from Bedminster                      23,797
Kerbside Recycling                                    10,877
Recycled Material by Type (tonnes)
Aluminium cans                                        111
Cardboard                                             2,703
Glass                                                 1,462
HDPE (High-density polyethylene)                      159
Mixed plastics                                        168
PET (Polyethylene terephthalate)                      174
Steel cans                                            255
Recycling from Transfer Stations (tonnes)
Green waste                                           25,550
Metal                                                 2,903
Tyres                                                 15,494
Oil (litres)                                          51,760
Batteries                                             80

                                        5
Water
Water Demand Management
In July 2009 the revised Water Demand Management Strategy 2009/2012 was endorsed, after
the successful implementation of the 2006 strategy.

The aims of the Strategy are:

•    To build on current demand management activities

•    To achieve significant and sustained water savings by customers

•    To continue to build a water conservation culture in the community

•    To minimise losses and non revenue water in our distribution network

•    To improve water accounting via metering, data management and reporting

•    To ensure the region is leading by example in water conservation.

Since beginning to apply water demand management measures in 2006, the former Cairns
City Council gross per capita water consumption has fallen about 15 per cent from 528 litres in
2006 to 447 litres in 2008. Gross per capita consumption figures are calculated using total
water production data that includes residential, commercial and industrial consumption.

A range of demand management initiatives have, and will continue to be, employed across the
region including –

•    Education and communication campaigns

•    Council water conservation initiatives

•    Permanent water conservation measures (low level restrictions)

•    Water conservation incentives for commercial customers

•    The production and supply of recycled water

•    Installation of district meters, pressure management, leak detection and repair programs

•    Reduction of unbilled and illegal connections and volumetric charging for all connections

Council has also adopted the following revised policies -

Water conservation Policy (1:01:25)
This policy encourages the adoption of water conservation principles and supports operational
activities, Council assets and public facilities.

                                              6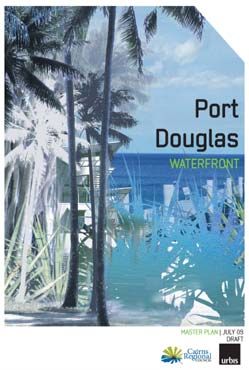
Recycled Water Policy (1:01:27)
This policy applies to the supply and use of recycled water produced by Council Wastewater
Treatment Plants.

Water savings in Council amenities
Waterless urinals and water saving devices on taps and showerheads have been installed in:

•    Council administration buildings in Mossman and Cairns

•    Public amenities block at George Davis Park and Mill Street in Mossman

•    Four Mile Park, Solander Boulevard, Mowbray Street, Market Park and Rex Smeal Park
     in Port Douglas

•    Teamsters Park in Craiglie.

These devices are engineered to function without water and deliver low cost of ownership and
maintenance. The waterless urinals will provide annual water savings of more than
600,000KL each year.

Climate Change and Sustainability
The Intergovernmental Panel on Climate Change’s (IPCC) Fourth Assessment Report (2007)
asserted that it is now ‘unequivocal’ the world is warming and the most likely cause is the
burning of fossil fuels for energy. It has also assessed that an increase in the intensity and
frequency of extreme climatic events is virtually certain.

The panel identified that Far North Queensland was one of six key ‘hot spots’ in Australia
where the impacts of climate change are likely to be significant. It also identified potentially
large losses to the built environment of the region from flooding, sea-level rise and storm
surges associated with tropical cyclones.

In addition, Far North Queensland is home to two World Heritage areas - the Great Barrier
Reef and Wet Tropics Rainforests. These iconic natural places contain unique biodiversity
and wonder, attracting significant input to Australia’s natural ecosystem services and tourism
economy.

Per capita, Queensland is one of the highest emitters of greenhouse gases in the world. In
2007, Queensland was responsible for more greenhouse gas emissions than any other state
in Australia, and had the highest per capita emissions of all Australian states.

According to the Garnaut Climate Change Review conducted by Professor Ross Garnaut and
commissioned by Australia's Commonwealth, State and territory Governments into the impacts
of climate change on the Australian economy, the Queensland economy could shrink by more
than 10 per cent by 2100 as a result of climate change.

                                              7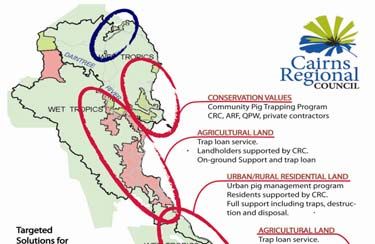
What is Council doing?
Greenhouse Gas Mitigation - Cities for Climate Protection (CCP)

Council is committed to reducing its impact on climate change by actively reducing its
greenhouse gas (GHG) emissions. As a “Cities for Climate Protection Leader”, Council has
been working to improve its quadruple bottom line for more than a decade.

Reducing emissions saves on Council’s energy costs and its impact on the climate. It also
improves the amenity of the built and natural environment for the broader community.

Council amalgamations enabled two Cities for Climate Protection Programs (CCP) to be
integrated. CCP has been a National program for more than 10 years, empowering Local
Governments to reduce GHG emissions. Although the Federal funding for the CCP Program
has been withdrawn, Council has been proactive in ensuring that the GHG mitigation program
adheres to the National Greenhouse Energy Reporting Act.

A GHG emissions inventory was completed in 2007/08 to benchmark Council’s emissions for
comparisons into the future.

The inventory illustrates the breakdown of emissions across the following five corporate
sectors:

•    Buildings/facilities

•    Streetlights

•    Vehicle fleet

•    Water & sewage electricity

•    Corporate waste.
In addition, there are two categories of direct emissions which are community emissions:

•    Landfill

•    Waste water treatment.
The total greenhouse emissions for the 2007-08 financial year were 133,880 tonnes CO2
equivalent. The breakdown per sector is shown in Figure 1.

This includes energy emissions and direct waste emissions. The inclusion of landfill emissions
has significantly increased Council’s carbon footprint.

                                             8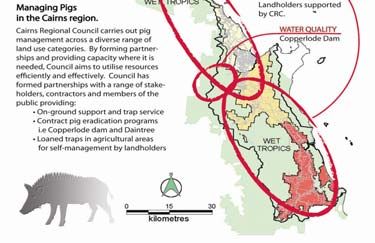
GHG Emissions by Sector (%)

                                      10%          8%   3%          Buildings
                                                            5%      Vehicle Fleet
                                                                    Streetlights
                                                             11%
                                                                    Water/Sewerage Electricity
                                                                    Corporate Waste
                                                             1%
                                                                    Landfill
                                                                    Sewerage Treatment Plants
                                62%

         Figure 1 – GHG emissions for 2007/08 including landfill & waste water treatment

Figure 2 illustrates the profile of greenhouse emissions per corporate sector which excludes
landfill. Total GHG emissions within these corporate sectors (within Council operations) totals
36,800 tonnes Co2-e.

                                        CCP GHG Emissions by Sector (%)

                                             3%                    Buildings
                                                         28%
                                                                   Vehicle Fleet
                          41%                                      Streetlights

                                                                   Water/Sewerage Electricity

                                                            10%    Corporate Waste

                                                  18%

           Figure 2 – GHG emissions for 2007/08 exc. landfill & waste water treatment

The next milestones in this process include the adoption of a greenhouse reduction target and
a GHG Mitigation Action Plan which will be included in Council’s Climate Change Strategy for
implementation.

Council has been working in an aligned and strategic manner with the Far North Queensland
Regional Organisation of Councils to share professional and resource capacity in GHG
mitigation and sustainability across the region.

Some of the mitigation actions so far include:

•    Timers on water boiling units

•    C-Bus electrical system for Spence Street Administration building

•    Solar public lighting/parks, boat ramps

•    Renewable energy on library buildings

•    Voltage reduction for building lighting circuits

•    Replacement and upgrade of Building Management System at Spence Street.

                                                        9
Promotion and support for Earth Hour event – Cairns region saved about 15 tonnes of
greenhouse causing carbon dioxide by switching off for Earth Hour in 2009:
• Shut down and switch off education program
• Energy audits of Council swimming pools
• Delamping unnecessary workshop lights
• Organic waste diversion from landfill
• Smart cars for vehicle fleet
• Paper reduction strategy.
Local Adaptation Pathways Program – Climate Adaptation Risk Assessment and
Action Plan
Cairns Regional Council is the first Local Government in North Queensland to complete a
detailed climate change risk assessment and Climate Change Adaptation Action Plan. The
project is critical to better understand and capture the range of climate change risks and
opportunities that Council may encounter in the delivery of its services to the community and
provide adaptation actions to address the risks.
Council was successful in receiving funding from the Commonwealth Department of Climate
Change through round one of the Local Government Adaptation Pathways Program (LAPP) in
May 2008. Consultants AECOM were commissioned for this project with a timeline from June
08 – July 09.
Objectives of the project were to:
• Assess the risks of climate change against a range of climate variables
• Identify the priority risks for further focus and investigation
• Formulate an action plan to provide adaptation strategies to high risk climate change
impacts
• Identify any gaps in knowledge and barriers to implementation.
Scope of the Project
The focus of the risk assessment was on investigating council’s ‘urban management systems’.
Urban management systems were defined in this project as the local land use planning and
development frameworks as well as the decision processes that define the form, and ongoing
function of an urban community. This definition incorporates the planning, delivery and
management of essential social and economic infrastructure and services that are provided by
council.
10The report contains a number of recommendations under the following categories:
• Corporate governance
• Land use planning and development
• Assets and operations
• Natural disaster planning and response
• Environment and community health.
Council has addressed a number of these recommendations and will use others to help guide
decision-making based on a cost benefit analysis. The full report can be found on Council’s
website - www.cairns.qld.gov.au
Figure 3 – One of Council’s Smart Fortwo Cars
ClimateSmart Home Living Program - Grid connect PV system installed on
Gordonvale Library
The ClimateSmart Living Project was offered to four Local Government areas in Queensland
during 2008/09. Ergon Energy, with funding from the Department Environment Resource
Management (DERM), partnered with Council to deliver energy efficiency outcomes for the
township of Gordonvale.
Through the ClimateSmart Living Project Council aimed to:
• Become a leader in responsible and successful climate change initiatives
• Provide the community with knowledge and skills to manage energy use
• Reduce energy usage and consequent greenhouse gas emissions
• Facilitate sustained change in behaviour in energy usage within communities.
The ClimateSmart Living Program provided the opportunity for Council to further the scope of
its environmental education and connect specifically with key sustainability educators in the
Gordonvale area. Council officers were able to add value to work being undertaken at
Gordonvale State School in relation to greenhouse mitigation and action planning.
11In addition the partnership between Council, Ergon Energy and Department of Environment
and Resource Management (formerly Environmental Protection Agency) provided an
opportunity to share resources, information and also offered an increased capacity for
community engagement. The following were key achievements in the duration of
ClimateSmart Living in Gordonvale:
• A 2 kW Grid connect solar PV system was installed on the Gordonvale Library
• Energy education delivered to schools in the Gordonvale area
• Audits and recommendations for Council buildings
• Community Engagement.
Figure 4 – Solar Panels on Gordonvale Library
Energy and Emissions Information Management Project
Council was successful in its Expression of Interest to Local Governments for Sustainability
(ICLEI) to participate in National Energy Information Management and Emissions Reporting
project. ICLEI received 54 Expressions of Interest and 10 Local Governments were chosen to
participate in this project.
Actions documented in this project will form a section of Council’s Climate Change Strategy
which will be developed in 2009/2010. The Climate Change Strategy aims to bring together
action plans from greenhouse mitigation, adaptation and emissions information management
to improve Council’s climate change response.
This project has highlighted the need to invest in a centralised system to collect, manage and
maintain primary emissions data to be able to progress as a leader in greenhouse mitigation.
Such a system can assist Council in managing greenhouse gas emissions for environmental,
social and financial benefit.
Earth Hour
In 2009 Earth Hour was supported locally by Council in partnership with Ergon Energy, the
Great Barrier Reef Marine Park Authority (GBRMPA), Lincolne Scott, World Wildlife Fund
(WWF) and the Queensland Government ClimateSmart Home Service.
12On 28 March 2009, Council joined more than 88 countries in turning off all non-essential
lighting for Earth Hour. Nearly half of all Australians (47 per cent) participated in Earth Hour
and 56 per cent (312) of local councils in Australia committed to Earth Hour. Approximately 85
per cent of Australia's population resides within these 312 local government areas.
A target of a 10 per cent reduction of electricity in the Cairns Region was achieved - a 3 per
cent increase from the 2008 target. The 10 per cent reduction equates to a reduction of 20
megawatt hours of power - equivalent to switching off approximately 25,000 60-watt light
bulbs. This saved approximately 15 tonnes of greenhouse gases, which is equivalent to taking
nearly 25,000 unleaded-fuelled cars off the road for an hour.
Corporate Sustainability Policy
The Corporate Sustainability Policy was adopted by Council on 11 February 2009.
In adopting a Corporate Sustainability Policy Council acknowledged the role it plays in
reducing the impact of human based activities on the natural environment by considering
sustainability within its strategic and operational responsibilities.
The aim of this policy is to embed sustainability principles into the operational function of the
organisation.
A commitment to sustainability means following the principles of ecological sustainable
development and creating objectives for sustainable practice which enhance the health of our
community and natural environment, while ensuring social justice, quality of life and holistic
prosperity.
The intent of the policy is to:
• Respond to the challenge of climate change
• Maintain and restore the natural environment
• Use our resources more efficiently
• Reduce our environmental impact
• Display strong leadership to the community
• Reduce financial losses associated with inefficient energy and resource consumption.
Grid connect solar PV system on Mossman and Gordonvale Libraries
Two grid connected solar energy systems were installed at the Gordonvale and Mossman
libraries in August 2008.
Installation of the systems is part of Council’s Greenhouse Gas Mitigation Action Plan and
quadruple bottom line approach. Benefits include reduced electricity bills, furthered community
education opportunities and reduced greenhouse gas emissions.
Each 2kW grid connect system reduces the libraries’ annual electricity bill by more than $500
and saves more than 3 tonnes of greenhouse gas emissions a year.
13Solar toolkits for Mossman and Gordonvale Libraries
Council has two interactive toolkits, which are available for schools to hire from the
Gordonvale and Mossman libraries as part of Council’s ongoing involvement in the Climate
Smart Living Project.
Featuring a solar-panelled briefcase donated by Ergon Energy, the interior holds a fan, radio,
fluorescent lamp, liquid crystal display and a buzzer.
The Solar tool kits are the region’s first educational tool kit to demonstrate the power of the
sun.
The special briefcase also includes a Power Mate energy monitor and tailored literature on
renewable energy and energy efficiency.
Figure 5 – Students investigating Solar tool kit
Biodiversity
Significance of Biodiversity in our Region
The 4,091 square kilometres of land administered by Council covers an area internationally
recognised for its scenic beauty and outstanding richness of biodiversity. The region features
a significant portion of two World Heritage listed areas, the rainforests of the Wet Tropics and
the reefs and waters of the Great Barrier Reef. Diversity of life forms range from single-celled
organisms to the giant Stockwellia trees of the East Mulgrave River valley.
Numerous migratory species, protected by international agreements, also reside for at least a
part of the year in this region. These migratory species depend on the wetlands, waterways,
coastal waters and terrestrial habitats from mangrove edges to mountain tops for food and
shelter during their stop-over in the region.
Regional ecosystems and the Vegetation Management Act 1999 form the main legislative
framework for the protection of vegetation in Queensland.
14Figure 6 – Mossman Gorge
The Cairns Region contains 144 regional ecosystems across three bioregions with the vast
amount housed in the Wet Tropics. Regional ecosystems of the Cape York Peninsular and
Einasleigh Uplands bioregions only occur to a small extent in the north-western portion of the
region. Fifteen of the 144 regional ecosystems of the Cairns Region have an Endangered
status, 94 have Of Concern status with 35 identified as Not of Concern. Some 328 broad
vegetation types are recognised.
The principle legislation for the conservation and protection of biodiversity in Queensland is
the Nature Conservation Act 1992 (NCA). This Act is supported and reinforced by the
Environment Protection & Biodiversity Conservation Act 1999 (EPBC) at the Federal level.
There are 2,505 Vascular plants of the region listed as Rare & Threatened under the NCA,
299 Presumed Extinct under the NCA, 14 Endangered, 29 Vulnerable and 34 Rare.
Some 369 introduced exotic vascular plant species are recorded as naturalised in the Cairns
Region. Some of these naturalised exotic plant species along with feral animals are a major
threat to biodiversity.
Qualitative and quantitative information on the biodiversity of the Cairns Region is in most
cases unknown at the genetic, species and ecosystem level. It is therefore difficult in most
instances to detect changes or trends due to climate change or other factors as there are
no baseline studies that can serve as a benchmark.
As part of the 2009/2014 Corporate Plan, Council has resolved to develop a Biodiversity
Strategy for the region. This will assist in achieving Objectives 1.1 and 1.2 of the Corporate
Plan:
1.1 Deliver improved management of the regions natural resources and biological diversity
for sustainability and ecosystem health.
1.2 Achieve greater recognition of the natural environment as an integral part of the regions
identity and fundamental to quality of life.
15Community Coastcare
Revegetation of Saltwater Creek Catchments, Mossman Golf Club
The initial site for stage one was marked out by golf club representatives at the end of March
2009, prior to site preparation / spray works being carried out by Council staff.
During April 2009 a total of 2,750 native plants were planted on site by Council staff, 23 Miallo
State School students, and 2 nursery volunteers.
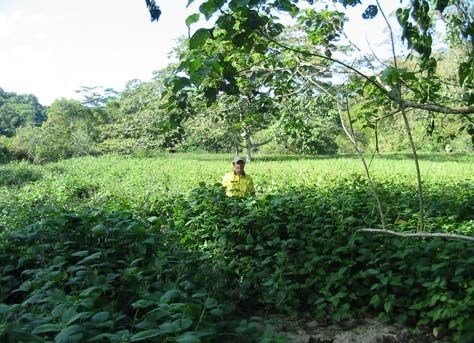
Riparian Rehabilitation, Reef Rescue – Brillantasia lamium, Whyanbeel Catchment
The funding provided for this project has complemented existing and other externally funded
projects at Whyanbeel, with the assistance of the Whyanbeel Action Group. The total
infestation in the Whyanbeel Catchment is estimated to be approximately 150 hectares.
Control works on Brillantasia lamium along Whyanbeel Creek have been undertaken over the
last year with a total 36 hectares of Brillantasia having initial treatment at the top of the
catchment. The program has focused on the riparian areas of the Whyanbeel Creek system.
A total of 5437 native trees have been planted to date, with further restoration works
scheduled and to be funded in the near future. GIS mapping of the Brillantasia in Whyanbeel
has been completed to enable ongoing management.
Figure 7 – Control Site before
Figure 8 – and after – revegetation
16Feral Pig Control
Council carries out a diverse and integrated feral animal management program across a
diverse range of land use categories in partnership with Government agencies and
landholders.
Council Services
On-ground support and trap service –
• Where landholders do not have capacity, Council assists with trap loan, trap delivery and
installation/removal, training, free euthanasia, free bait and free disposal
• Loaned traps in agricultural areas for self management by landholders
• Targeted Contract pig control programs
Figure 9 - Council Feral Pig Management
Urban Mangrove Management Strategy
Council is working with Queensland Department Primary Industries & Fisheries (QPIF) in
developing Council’s Urban Mangrove Management Strategy for drains and waterways under
their responsibility. The objective of the strategy is to:
• provide options for management of urban marine plants within Council's jurisdiction, by
identifying those areas that require maintenance, those areas that require rehabilitation
and those that should be protected and enhanced
• reduce administration costs for Local Government and QPIF
• enhance understanding and management of fish habitats for Ecologically Sustainable
Development
17• develop an agreed planning framework between Council and QPIF for public works
within/adjacent to Declared Fish Habitat Areas
• identify areas where there is provision for protection of fish habitats and meeting
community requirements
• provide support for innovative techniques and restoration of mangrove communities
(environmental offsetting)
The overall aim in developing this strategy is to replace Council's current fisheries
development approval process for works outside of the current Code of Self-Assessable
Development (MP02). The Strategy will provide a holistic approach to mangrove maintenance
in urban environments that is supported by Council's planning instruments and QPIF’s marine
plant management policies.
QPIF has been successful in negotiating similar Urban Mangrove Management Strategies with
Bundaberg and Brisbane City Councils. This has encouraged other local governments like
Cairns Regional Council to jointly develop their own strategies with QPIF, to improve the
management of mangrove systems which provides so many benefits to the community.
Waste
Waste Strategy
The new Waste Management Strategy is currently nearing completion involving consideration
of the following stages:
• Where are we now? involves identifying current waste, recycling and composting rates,
understanding the provision of waste management services within the strategy area.
• Where do we want to get to? where does Council want to be on a strategic perspective
in relation to waste management? i.e. what level of recycling & composting is to be
achieved, waste minimisation activity, diversion of residual waste from landfill and
establishing the approach to meeting other government targets and the overall provision
of services.
• What do we need to do to get there? this involves considering the options for reducing
waste, increasing recycling and composting rates and managing residual waste to
increase diversion from landfill. The development of specific Action plans will be
required.
Since 2002 the former Cairns City Council had continued to improve waste management with
the introduction of an advanced resource recovery facility (composting facility), opening a
Materials Recovery Facility (MRF), increased kerbside dry recycling services and a range of
initiatives to increase recycling and reuse.
The overall recycling rate (diversion from landfill) of municipal waste has increased over the
past three years from 31 per cent in 2005/06 compared to 45 per cent diversion from landfill
throughout 2007/08. The total volume of dry kerbside recycling diverted from landfill has
increased over the past four years from 17 per cent in 2004/05 to 43 per cent in 2007/08.
18While these measures are proving successful the amount of waste produced by the region is
still increasing. The new Strategy will guide the way we manage our waste over the next five
years.
Actions under consideration for the future include:
• To reduce growth in waste generation each year and achieve zero waste generation
growth as a long term aspiration
• To achieve and maintain a kerbside dry recycling rate of product sorted at the MRF and
sent for reprocessing
• To achieve and maintain an overall recycling rate (diversion from landfill)
• To build efficient recycling services with increased local markets and demand for
recovered resources
• To optimise residual waste treatment and recovery and minimise waste sent to landfill
• To show leadership and coordination in regards to waste management in the region and
provide best value services.
Glass Crusher Demonstration Project
A glass crusher has been installed at the Materials Recovery Facility (MRF) through a project
jointly funded by the National Packaging Covenant and the Department of Environment and
Resource Management to enable local alternative uses for glass to be developed.
Prior to this, glass collection and recycling in Cairns and North Queensland was difficult as the
glass was transported to Brisbane for reprocessing. The long transportation distance also
increased the risk of further glass breakage, resulting in loads being rejected.
The project is intended to evaluate the economic return, potential market and supply capacity
in Cairns and surrounding Local Government regions for the use of crushed glass as an
aggregate substitute or other media substitute.
The focus in this initial stage is to seek out all possible local markets for the crushed glass
product and provide sample material for businesses to use in trials. The most likely uses could
include:
• A substitute for sand for pipe embedment
• An aggregate for the construction of concrete and cement blocks
• Blast medium for abrasive blasting
• A filtering compound to be used instead of sand in sand filters.
19Recycling in our community
The Water and Waste education officer has worked closely with Gordonvale State School in
bringing public awareness of “plastics” to the Gordonvale community. The officer negotiated
with the local IGA and proposed a “recycling station” for people to deposit unwanted plastic
bags. The Operations Manger of the IGA acknowledged that it was a great opportunity to
work with the local community and organised a container and transport of the plastic bags to a
recycling station in Townsville.
Students from Gordonvale State School decorated the container with environmental messages
about the harmful effects of plastic bags entering our environment. There has been a fantastic
community response, with plastic bags being deposited in and even being picked up to be
reused at the IGA and other stores throughout Gordonvale.
The students have had excellent feedback from the community and have been encouraged to
further sustainable practices for the Gordonvale area.
Figure 12 – Gordonvale State School students
Human Settlement
Major Strategic Planning Projects for the Region
Mount Peter
The Mount Peter area has been identified as the main urban growth corridor for Cairns with
development expected to occur over the next 20-30 years to cater for a population of up to
50,000 people.
The Mount Peter Project is one of the largest master planning exercises undertaken in
Queensland. Whilst the expected completion date for this Project is 2011, a large component
of the planning was undertaken in 2009. In February 2009, the Mount Peter Enquiry By
Design (EBD) Workshop was held and provided a collaborative forum for a diverse range of
government and community stakeholders to positively contribute to the future design of Mount
Peter.
20Mount Peter's Vision, established in 2007, provided guidance during the EBD (which resulted
in the EBD Outcomes Report and draft Urban Framework Plan) and continued to effect the
development of the draft Structure Plan and other outputs. The Vision's six key themes that all
played a part in assisting to build the draft Structure Plan and other outputs included:
• Integrated & sustainable infrastructure
• Unique natural environment
• Strong vibrant community
• Innovative urban structure and design
• Thriving economy and local employment
• Connected community
Port Douglas Master Planning
Port Douglas is an iconic Australian destination, with all the attributes, opportunities and risks
of a tropical waterfront destination set between two World Heritage areas.
Development associated with such a location requires a balance of considerations across
elements including environment, heritage, economy, industry, community and the area’s World
Heritage status. Council has faced such a challenge with a proposed integrated development
plan for the Port Douglas Waterfront.
Driven by the community’s overwhelming desire to protect the local environment, unique
character and iconic value, the master planning process also sought to facilitate outcomes that
nurtures economic development and strengthen tourism appeal in the longer term.
A need for an integrated plan was identified by the former Douglas Shire Council and the
community in order to provide certainty for the future of the Port Douglas Waterfront. A master
planning process commenced which ensured ongoing collaboration with community, expert
consultancies, State Agencies and Council.
The Master Plan provides benefits for the community, economy, natural and physical
environment and character, all of which contribute to the value of Port Douglas. Strategies
within the plan provide guidance to ensure its benefits are realised with time. These strategies
relate to access, land use and economics, environment and sustainability, physical character,
public realm and streetscape, and phasing and implementation.
The intent of the plan is to provide a coherent and accessible waterfront that better meets
needs of residents, businesses and tourists.
Key elements of the Waterfront will include:
• Protection and enhancement of existing environmental, economic and social assets of
Port Douglas
• A walkable waterfront with the return of significant areas of waterfront to public space
uses
21• A working waterfront which plays an important economic and tourism role
• A quayside public plaza to provide a node for community events and improves pedestrian
connections
• A reshaped quay line
• Increased public mooring
Figure 10 – Port Douglas Waterfront Master Plan
In recognition of the outstanding potential to cement the iconic characteristics, economic
sustainability and environmental credentials of the town, Council appointed design specialists
Urbis to prepare the draft master plan for the Port Douglas Waterfront.
Seeking to integrate existing values and features of the waterfront with a range of new
initiatives, the plan aims to cement the western shoreline of the peninsular as one of the
world’s greatest waterfronts.
After an Enquiry By Design Workshop in October 2008 a Draft Master Plan was developed for
community consultation. Public feedback on the initial plan – which occurred during February
March – was considered in the final formulation of the July 2009 Draft Master Plan.
Both the Project Advisory Group and the Waterfront Management Committee were appointed
to review the final draft and provide comment to Council in order to finalise the plan.
Council will consider adoption of the plan in November 2009.
Character and Heritage Study
As part of ongoing efforts to improve local planning processes, throughout 2008/09 Council
developed two complementary codes - the Character Precinct Code and the Multiple Dwelling
(Small Scale Development) Code. These codes aim to manage development within identified
character precincts.
The codes seek to balance the community’s desire to retain the character of their
neighbourhoods while still allowing development opportunity and increased density in the
precincts which are located in close proximity to the CBD or an activity centre.
22Strengthened demolition provisions within the Character Precinct Code aims to retain
character housing and streetscape values. The code also seeks to ensure that new
development is sympathetic to and respectful of the character and addresses key issues of
renovation, extension and relocation and the raising and building underneath of character
buildings.
The Multiple Dwelling (Small Scale Development) Code was developed to encourage in-fill
development of between three to five dwellings. Streetscape values are maintained through
the retention of the existing character building to the front of the property, with new
development to the rear. This form of development offers an alternative to developing larger
scale multiple dwellings and development potential to individual landowners who previously
could not achieve the Residential 3 zoning potential due to the small lot size restrictions.
Council is committed to the continues review and improvement of planning controls with
Council undertaking a Neighbourhood Character Study throughout 2009/10 which will inform a
further round of amendments to the CairnsPlan. Evolution of the controls to manage
development within character precincts is evidence of Council’s commitment to delivering
good planning policy.
Introduction of the Erosion and Sediment Control (ESC) a sub-unit of the
Environmental Protection Unit (EPU).
In response to community interest in focusing on erosion and sediment controls on large
subdivisions and a departmental change in operations, Council’s Environmental Protection
Unit expanded to include two new positions to monitor erosion and sediment controls
specifically on subdivisions. This new sub-unit also was responsible for monitoring ESC on
individual building sites.
Since the inception of the unit in September 2008, the team has inspected every existing and
new subdivision within the Council boundaries. Further to this strategy, the team has also
endeavoured to meet every building company throughout the region to discuss compliance,
regulation and statutory requirements.
Building Industry Environmental Awareness Campaign
The Environmental Protection Unit conducted a building industry environmental awareness
campaign prior to the Wet season in 2008. The objective was to advise the building industry of
the upcoming wet season compliance program conducted by Environmental Protection
Officers.
The awareness campaign comprised of taking information out to the builders, targeting new
subdivision areas from Mossman through to Edmonton. Builders, subcontractors, developers
and contractors were treated to a BBQ and discussions with the EP team.
23Figure 11 – Awareness Campaign at Trinity Park
Changes to the Environmental Protection Act 1994 and Environmental Protection
Regulation 2008
The Environmental Protection Regulation 2008 underwent a 10 year review in 2007 and
subsequently major changes were made to the regulation and to the Environment Protection
Act 1994.
This has effected the operational requirements for Environmental Protection Unit including;
• New devolved delegations which charges Council with administering commercial
nuisance
• Complete review of Environmentally Relevant Activities (ERA’s) which included:
- All ERAs subject to an annual return fee
- New categories and thresholds for some ERAs
Liveability
Liveability describes the overall attractiveness of an area as a place to live and is one of the
key reasons people give for moving to or remaining in an area. Liveability often refers to the
relationship people have with their environment that can be made up of urban, natural, built,
places and people.
As much new data as is possible to obtain and/or generate has been used in the report below.
Where data has traditionally been obtained from the 2006 census and where it has not
changed, the measure has not been commented on. There will be a new national census in
2011 which will provide much more new data on population, housing, and migration etc.
A Snap Shot of the Cairns Population
The estimated resident population of Cairns Regional Council at 30 June 2008 (predicted) was
158,653 people, an increase of 5 985 people or 3.9% over the year. This compares to a 3.5%
increase over the previous year.
24Estimated Resident Population for Cairns Regional Council
180,000
158,653
160,000
147,538
140,000
128,095
120,828
120,000
Population Size
98,413
100,000
84,172
80,000
69,411
60,000
40,000
20,000
0
1981 1986 1991 1996 2001 2006 2008(p)
Population at Year to June
Projected population increases indicate that by June 30, 2016 the expected population of
Cairns Regional Council will have grown to 182 684. By 2021 the population is expected to
reach 195 540 and by 2026 the population is expected to grow to 208 532 – a growth rate
between 2006 and 2026 of 1.7%.
Annual Population Change Ten Year Series to June 30th
4500
4020
4000
3500
2968
Number Population Change
3000 2900
2724 2710
2500
2000
1500
1000
500
0
1981-1991 1991-2001 2001-2011 2011-2021 2021-2031
Ten Year Series
25The graph above shows by how many people the population of the Cairns Region has grown
and how it is predicted to grow up to 2031. It is envisaged that the period between 2001 and
2011 will see the most people arrive in the region.
Population change
People are living longer and we are having fewer children which points towards a dramatic
change in the age structure of society. Australia is ageing and the Cairns Region is reflecting
this change.
Cairns Regional Council
Age 0-14 15-24 25-44 45-64 65+
group
2006 21.5 13.1% 31.9% 24.7% 8.8%
%
2031 17.3 11.2% 27.8% 25.8% 17.9%
%
By 2031, the proportion of people aged over 65 years will have doubled. The age group
distributions displayed in the table above are similar to those across Queensland. One
difference between Cairns and the rest of the state the however, is the proportion of people
aged 65+ in Cairns will remain a smaller number than other places such as the Tablelands.
Queensland
Age 0-14 15-24 25-44 45-64 65+
group
2006 20.4 14.1% 28.6% 24.8% 12.1%
%
2031 17.7 21.1% 25.5% 24.4% 20.3%
%
The median age of people in Cairns will rise from 35 years in 2006 to 41 years in 2031. The
median age of people in Townsville, by way of comparison over the same time period, is
predicted to increase from 33 years in 2006 to 39 years in 2031. The median age of people on
the Tablelands however, is predicted to increase from 41 years in 2006 to 48 in 2031.
Housing Updates
In the year to June 2009, Cairns was one of only four Local Government Areas (LGA) outside
of South East Queensland to rate as one of the top 10 areas for dwelling approvals. However,
between June 2008 and June 2009 the dwelling approval numbers fell. All of the top 10 LGAs
for dwelling approvals (Brisbane, Gold Coast, Moreton Bay, Sunshine Coast, Ipswich,
Townsville, Logan, Fraser Coast, Cairns and Mackay) experienced this decline in the
approvals.
Cairns (number nine in the top 10 list of areas for dwelling approvals) experienced a 60.7%
decline for all dwelling approvals between 30 June 2008 to 30 June 2009, a 54.2% decline in
approvals for houses and 74.5% decline in approvals for other types of dwelling such as
townhouses or units over the same time period which was no doubt a symptom of the world
wide global financial downturn.
26Dwelling Approvals
2500
2,203
2000
1490
1500
Number
2008
2009
1000
865
683 713
500
182
0
Houses Other Total
Type
Measures on Affordability
Affordability refers to the ability of Cairns Regional Council residents to access and live in
appropriate and affordable accommodation.
One way of measuring Affordability is to examine rents. Figures from Queensland's
Residential Tenancies Authority (RTA) show the average cost of renting in 2009 in the Cairns
region has fallen compared to rental costs in 2008. Figures indicate the average cost of renting
a two-bedroom unit was $250 in the June 2009 quarter - down $10 per week from June 2008
and the cost of a three-bedroom house fell by $20 per week over the same time scale.
Rental Costs Cairns & Townsville Average Cost Per Two Bed Unit Over June Quarter 2007, 2008 &
2009
280
270
260
Dollar Value
250
Cairns $
Townsville $
240
230
220
210
2007 2008 2009
June Quarters
27The graph above shows how the average cost of renting a two bedroom unit compares
between Cairns and Townsville over a time period of three years. The rent in Cairns dropped
by $10 between June 2008 and June 2009 whereas the rents in Townsville rose by $10 per
week.
Rental Costs Three Bed House June Quarters 07, 08 & 09 Cairns and Townsville
330
320
310
Dollar Value
300
Cairns $
Townsville $
290
280
270
260
2007 2008 2009
June Quarters
The above graph displays the average cost of renting a three bedroom house in Cairns and
Townsville over the June quarters from 2007, 2008 and 2009. Whilst the rental price in Cairns
was on average $15 higher per week in 2007, by 2009 the cost of renting in Cairns compared
to Townsville had fallen with average weekly rents $20 cheaper indicating that Cairns has more
affordable rents.
Weekly Rental Costs for House & Units Brisbane and Cairns June Quarters 07, 08 and 09
400
350
300
250
DOllar Value
Jun-07
200 Jun-08
Jun-09
150
100
50
0
Cairns house Cairns unit Brisbane house Brisbane unit
28When we compare the average rental costs of Brisbane to Cairns over the June quarters of
2007 through to 2009, it is clear how much more affordable Cairns is to Brisbane.
Unemployment
The Cairns region has experienced some of the highest rates of unemployment in Australia.
Data available from the Department of Employment and Workplace Relations (currently only
available for the March 2008 and March 2009 time periods) shown below in the graph,
displays how there has been a rise in the levels of unemployment over the time period.
Unemployment has affected different areas of Cairns in different ways. Where figures are
available, the highest rate in 2008 was experienced in the central suburbs and the lowest rate
in the northern suburbs. In 2009, nearly all the areas of Cairns were beginning to experience
similar rates between 6.1% and 7.7% of the population of those areas. Once again, the
northern suburbs still had the lowest rates of under 4%. By comparison, Yarrabah experienced
the largest unemployment rates of the region with an unemployment rate of 10.8%.
With the decrease in building activity has come a slight fall in median house purchase prices to
$333 000 thereby making housing more affordable. However, unemployment rates in Cairns
are still amongst the highest in Australia. In the June quarter 2009 there were 6 389 people
unemployed. This represents an unemployment rate of 7.1% compared with Queensland
which had a smoothed unemployment rate of 4.4%. Unfortunately but to be expected, these
high unemployment rates have had a negative effect on the affordability measure.
Unemployment Rate March 08 to March 09
12.00
10.00
8.00
Percentage Rate
Unemployment Rate (%)March 08
6.00
Unemployment Rate (%)March 09
4.00
2.00
0.00
Cairns- Cairns Cairns City Cairns Mt Cairns Cairns Pt B Cairns Cairns Yarrabah
Barron Central Whitfield Northern Trinity Western
Suburbs Suburbs Suburbs
Statistical Local Area
29You can also read