California Market Squid - Seafood Watch
←
→
Page content transcription
If your browser does not render page correctly, please read the page content below
California Market Squid
                                                   Doryteuthis (Loligo) opalescens

                                                      ©Monterey Bay Aquarium

                                                            California

                                                        Purse seines
                                                            January 9, 2019
                                              Seafood Watch Consulting Researcher

Disclaimer
Seafood Watch ® strives to have all Seafood Reports reviewed for accuracy and completeness by external scientists with expertise in ecology,
fisheries science and aquaculture. Scientific review, however, does not constitute an endorsement of the Seafood Watch program or its
recommendations on the part of the reviewing scientists. Seafood Watch is solely responsible for the conclusions reached in this report.

Seafood Watch Standard used in this assessment: Standard for Fisheries vF3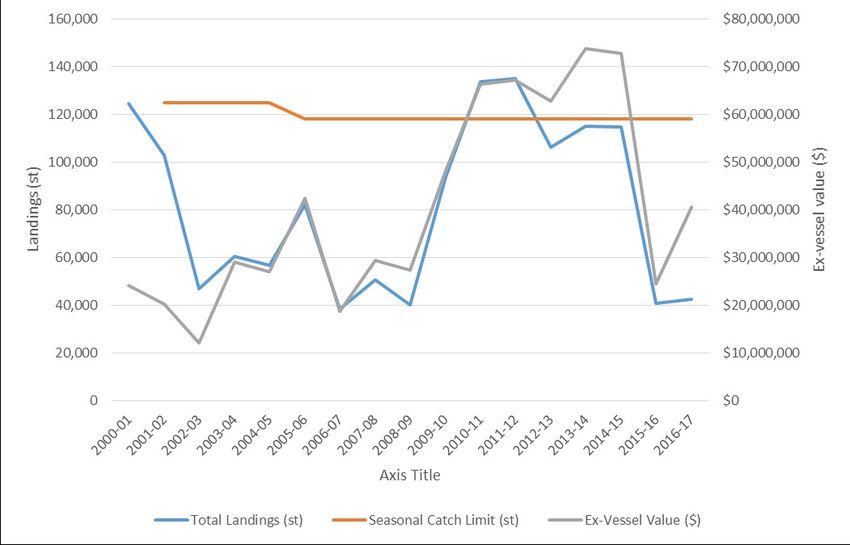
Table of Contents

About
. . . . . . . . . Seafood                . . . . . . . . . . . . . . . . . . . . . . . . . . . . . . . . . . . . . . . . . . . . . . . . . . . . . . . . . . . . . . . . . . . . . . . . . . . . . . . . . . . . . . . . . . . . . . . . .3
                  . . . . . . . . . . . .Watch                                                                                                                                                                                            ........................

Guiding               . . . . . . . . . . . . . . . . . . . . . . . . . . . . . . . . . . . . . . . . . . . . . . . . . . . . . . . . . . . . . . . . . . . . . . . . . . . . . . . . . . . . . . . . . . . . . . . . . . . . . . . . . . .4
. . . . . . . . . . .Principles                                                                                                                                                                                                            ........................

. . . . . . . . . . . . . . . . . . . . . . . . . . . . . . . . . . . . . . . . . . . . . . . . . . . . . . . . . . . . . . . . . . . . . . . . . . . . . . . . . . . . . . . . . . . . . . . . . . . . . . . . . . . . . . . . . . . . . .5
Summary                                                                                                                                                                                                                                    ........................

Final
. . . . . . . Seafood                . . . . . . . . . . . . . . . . . . . . . . . . . . . . . . . . . . . . . . . . . . . . . . . . . . . . . . . . . . . . . . . . . . . . . . . . . . . . . . . . . . . . . . . . . . . . . . . . . . .7
              . . . . . . . . . . . .Recommendations                                                                                                                                                                                      ........................

. . . . . . . . . . . . . . . . . . . . . . . . . . . . . . . . . . . . . . . . . . . . . . . . . . . . . . . . . . . . . . . . . . . . . . . . . . . . . . . . . . . . . . . . . . . . . . . . . . . . . . . . . . . . . . . . . . . . . .8
Introduction                                                                                                                                                                                                                               ........................

. . . . . . . . . . . . . . . . . . . . . . . . . . . . . . . . . . . . . . . . . . . . . . . . . . . . . . . . . . . . . . . . . . . . . . . . . . . . . . . . . . . . . . . . . . . . . . . . . . . . . . . . . . . . . . . . . . . . .12
Assessment                                                                                                                                                                                                                                .........................

      Criterion
      . . . . . . . . . . . .1:
                              . . .Impacts
                                    . . . . . . . . . . .on
                                                          . . . the
                                                                . . . . . Species
                                                                          . . . . . . . . . . Under           . . . . . . . . . . . . . . . . . . . . . . . . . . . . . . . . . . . . . . . . . . . . . . . . . . . . . . . . . . . . .12
                                                                                              . . . . . . . . Assessment                                                                                                               ..........................

      Criterion
      . . . . . . . . . . . .2:
                              . . .Impacts
                                    . . . . . . . . . . .on
                                                          . . . Other           . . . . . . . . . . . . . . . . . . . . . . . . . . . . . . . . . . . . . . . . . . . . . . . . . . . . . . . . . . . . . . . . . . . . . . . . . . . .21
                                                                . . . . . . . . Species                                                                                                                                                ..........................

      Criterion
      . . . . . . . . . . . .3:
                              . . .Management                        . . . . . . . . . . . . . . . . . . . . . . . . . . . . . . . . . . . . . . . . . . . . . . . . . . . . . . . . . . . . . . . . . . . . . . . . . . . . . . . . .24
                                   . . . . . . . . . . . . . . . . .Effectiveness                                                                                                                                                     ..........................

      Criterion
      . . . . . . . . . . . .4:
                              . . .Impacts
                                    . . . . . . . . . . .on
                                                          . . . the
                                                                . . . . . Habitat
                                                                          . . . . . . . . . .and        . . . . . . . . . . . . . . . . . . . . . . . . . . . . . . . . . . . . . . . . . . . . . . . . . . . . . . . . . . . . . . . .31
                                                                                              . . . . . Ecosystem                                                                                                                      ..........................

. . . . . . . . . . . . . . . . . . . . . . . . . . . . . . . . . . . . . . . . . . . . . . . . . . . . . . . . . . . . . . . . . . . . . . . . . . . . . . . . . . . . . . . . . . . . . . . . . . . . . . . . . . . . . . . . . . . . .37
Acknowledgements                                                                                                                                                                                                                          .........................

. . . . . . . . . . . . . . . . . . . . . . . . . . . . . . . . . . . . . . . . . . . . . . . . . . . . . . . . . . . . . . . . . . . . . . . . . . . . . . . . . . . . . . . . . . . . . . . . . . . . . . . . . . . . . . . . . . . . .38
References                                                                                                                                                                                                                                .........................

                                                                                                                 2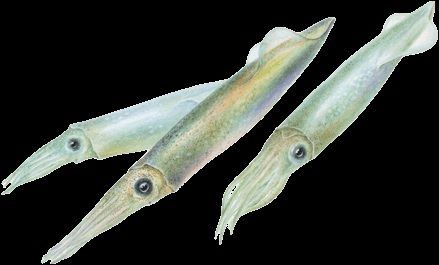
About Seafood Watch
Monterey Bay Aquarium’s Seafood Watch program evaluates the ecological sustainability of wild-caught and
farmed seafood commonly found in the United States marketplace. Seafood Watch defines sustainable seafood
as originating from sources, whether wild-caught or farmed, which can maintain or increase production in the
long-term without jeopardizing the structure or function of affected ecosystems. Seafood Watch makes its
science-based recommendations available to the public in the form of regional pocket guides that can be
downloaded from www.seafoodwatch.org. The program’s goals are to raise awareness of important ocean
conservation issues and empower seafood consumers and businesses to make choices for healthy oceans.

Each sustainability recommendation on the regional pocket guides is supported by a Seafood Watch
Assessment. Each assessment synthesizes and analyzes the most current ecological, fisheries and ecosystem
science on a species, then evaluates this information against the program’s conservation ethic to arrive at a
recommendation of “Best Choices,” “Good Alternatives” or “Avoid.” This ethic is operationalized in the Seafood
Watch standards, available on our website here. In producing the assessments, Seafood Watch seeks out
research published in academic, peer-reviewed journals whenever possible. Other sources of information
include government technical publications, fishery management plans and supporting documents, and other
scientific reviews of ecological sustainability. Seafood Watch Research Analysts also communicate regularly with
ecologists, fisheries and aquaculture scientists, and members of industry and conservation organizations when
evaluating fisheries and aquaculture practices. Capture fisheries and aquaculture practices are highly dynamic;
as the scientific information on each species changes, Seafood Watch’s sustainability recommendations and the
underlying assessments will be updated to reflect these changes.

Parties interested in capture fisheries, aquaculture practices and the sustainability of ocean ecosystems are
welcome to use Seafood Watch assessments in any way they find useful.

                                                        3
Guiding Principles
Seafood Watch defines sustainable seafood as originating from sources, whether fished1 or farmed that can
maintain or increase production in the long-term without jeopardizing the structure or function of affected
ecosystems.
The following guiding principles illustrate the qualities that fisheries must possess to be considered sustainable
by the Seafood Watch program (these are explained further in the Seafood Watch Standard for Fisheries):
Follow the principles of ecosystem-based fisheries management.
Ensure all affected stocks are healthy and abundant.
Fish all affected stocks at sustainable levels.
Minimize bycatch.
Have no more than a negligible impact on any threatened, endangered or protected species.
Managed to sustain the long-term productivity of all affected species.
Avoid negative impacts on the structure, function or associated biota of aquatic habitats where fishing
occurs.
Maintain the trophic role of all aquatic life.
Do not result in harmful ecological changes such as reduction of dependent predator populations, trophic
cascades, or phase shifts.
Ensure that any enhancement activities and fishing activities on enhanced stocks do not negatively affect the
diversity, abundance, productivity, or genetic integrity of wild stocks.
These guiding principles are operationalized in the four criteria in this standard. Each criterion includes:
Factors to evaluate and score
Guidelines for integrating these factors to produce a numerical score and rating
Once a rating has been assigned to each criterion, we develop an overall recommendation. Criteria ratings and
the overall recommendation are color coded to correspond to the categories on the Seafood Watch pocket guide
and online guide:
Best Choice/Green: Are well managed and caught in ways that cause little harm to habitats or other wildlife.
Good Alternative/Yellow: Buy, but be aware there are concerns with how they’re caught.
Avoid/Red Take a pass on these for now. These items are overfished or caught in ways that harm other
marine life or the environment.
1 “Fish” is used throughout this document to refer to finfish, shellfish and other invertebrates
4Summary
This report provides recommendations for the US domestic fishery for market squid (Doryteuthis opalescens,
formerly Loligo opalescens). Market squid range from southeastern Alaska to Punta Eugenia, Baja California Sur,
Mexico. The fishery for market squid occurs along the US West Coast and is one of the largest fisheries by mass
in the country. Since 1986, nearly all market squid have been fished and landed in the state of California. As
such, this report assesses and provides a recommendation for only the purse seine market squid fishery in
California.
Criterion 1
There are no biomass reference points, so biomass relative to a sustainable level is unknown. However, a
Productivity-Susceptibility Analysis suggests market squid are not highly vulnerable to being overfished, and
multiple data-poor approaches based on distinct data sources suggest little reason for concern that the stock is
overfished. Egg escapement is used as a reference point for fishing mortality, but no recent estimates are
available; therefore, fishing mortality relative to a sustainable level is unknown.
Criterion 2
Bycatch in the market squid fishery is generally very low and is most commonly comprised of other forage
species like sardine, anchovy and mackerels. Chinook salmon and mammals are also infrequently caught,
though not at a frequency or volume great enough for significant concern. Deterrent devices ("seal bombs") are
used in the fishery to scare away mammals from fishing nets. The noise from detonations could potentially
affect the behavior of marine mammals. Risso's dolphins could be especially vulnerable to the noise source,
since they tend to be less opportunistic in their prey selection than other mammals and so may be more
dependent on squid abundance. Research on this topic is in the early stages, with nothing on actual impacts
published or conclusive at this time.
Criterion 3
The market squid fishery is managed by the California Department of Fish and Wildlife under the Market Squid
Fishery Management Plan. Measures include weekend closure dates (noon Friday to noon Sunday), which
provide for uninterrupted spawning; a restricted access program with provisions for initial entry into the fishery,
permit types, permit fees, and permit transferability; an annual catch limit of 118,000 short tons (107,047 MT);
a fishing-mortality reference point of 30% egg escapement; and numerous spatial closures. The fishery
management strategy does have weaknesses in terms of the more robust reference points and assessments
used for similar fisheries around the world, and in terms of ratcheting down permitted fishing mortality during
years of low abundance, including a minimum biomass below which fishing should not occur.
Ongoing research and monitoring allows for an indication of stock status, but is not conducted frequently
enough to give a good indication that fishing mortality is at a sustainable level. Studies examining the use of
paralarval abundance as an indicator of future CPUE have demonstrated this as an effective and accurate tool. If
used in management, this should aid greatly in the ability to estimate each year’s exploitable biomass through
annual pre-fishing season surveys, as is strongly recommended for cephalopod fisheries by researchers.
Bycatch is thought not to be a problem, based on a pilot observer program in place from 2004 to 2008.
However, it would be prudent to confirm that this is still the case given that study was conducted a decade ago.
Also, current efforts to determine the impacts of deterrents such as seal bombs on mammals associated with
the squid fishery, especially Risso's dolphins, should provide important insight into these collateral impacts on
other species.
CDFW enforces existing regulations through the use of mandatory logbooks and port-side samplers that collect
data on landings and bycatch. At this time there is no evidence of substantial illegal fishing. Monitoring of the
catch allows managers to close the fishery before the catch limit of 118,000 short tons (107,047 MT) is reached.
However, since the catch limit was implemented with the completion of the Market Squid Fishery Management
5Plan in 2005, the catch limit has been exceeded twice, in 2010 and 2011, which suggests monitoring and
enforcement may not be enough to control fishing effort in years of high squid abundance.
Criterion 4
The purse seine fishery for market squid is conducted on sandy and muddy substrate and there is evidence the
fishery at least occasionally interacts with the seafloor (based on bycatch species, the combination of net height
and water depth at setting sites, and the capture of egg capsules). It is not clear that the many areas closed to
squid fishing and other types of fishing on the California coast actually amount to 20% of representative
habitats. These spatial management areas, combined with other measures, such as the catch limit and
weekend closures, may allow for some protection of the ecosystem role of market squid, but their effectiveness
is uncertain and detrimental food web impacts are possible.
6Final Seafood Recommendations
CRITERION CRITERION 2:
1: IMPACTS IMPACTS ON CRITERION 3: CRITERION 4:
ON THE OTHER MANAGEMENT HABITAT AND OVERALL
SPECIES/FISHERY SPECIES SPECIES EFFECTIVENESS ECOSYSTEM RECOMMENDATION
California market squid Green Green (5.000) Yellow (3.000) Yellow (3.000) Best Choice
California Eastern (3.318) (3.495)
Central Pacific, Purse
seines, United States
of America
Scoring Guide
Scores range from zero to five where zero indicates very poor performance and five indicates the fishing
operations have no significant impact.
Final Score = geometric mean of the four Scores (Criterion 1, Criterion 2, Criterion 3, Criterion 4).
Best Choice/Green = Final Score >3.2, and no Red Criteria, and no Critical scores
Good Alternative/Yellow = Final score >2.2-3.2, and neither Harvest Strategy (Factor 3.1) nor Bycatch
Management Strategy (Factor 3.2) are Very High Concern2, and no more than one Red Criterion, and no
Critical scores
Avoid/Red = Final Score ≤2.2, or either Harvest Strategy (Factor 3.1) or Bycatch Management Strategy
(Factor 3.2) is Very High Concern or two or more Red Criteria, or one or more Critical scores.
2 Because effective management is an essential component of sustainable fisheries, Seafood Watch issues an Avoid
recommendation for any fishery scored as a Very High Concern for either factor under Management (Criterion 3).
7Introduction
Scope of the analysis and ensuing recommendation
Market squid (Doryteuthis opalescens, formerly Loligo opalescens) range from southeastern Alaska to Punta
Eugenia, Baja California Sur, Mexico (Okutani and McGowan 1969). The fishery for market squid occurs along
the US West Coast and is one of the largest fisheries by mass in the country. Since 1986, nearly all market squid
have been fished and landed in California using either purse seine or, to a much lesser extent, brail gear. This
report assesses the California market squid fishery using purse seines.
Species Overview
California market squid is a short-lived species (6 to 9 months) (Zeidberg 2013) that has been an important
commercial fishery species since the 1860s. The purse seine market squid fishery in California is present in both
the northern and southern coastline, and these two regions are often examined separately in the literature. The
northern fishery around Monterey Bay typically operates from April through November, and the southern fishery
around the Channel Islands and coastal areas typically operates from October through March due to regional
and temporal differences in peak spawning (Porzio and Brady 2008).
Prior to 2001 the California Legislature managed the market squid fishery in California (where virtually all
landings have occurred). In 1997, the Legislature issued a moratorium on the number of permits; 243 squid
vessel (purse seine) permits and 53 light boat (attracting) permits were issued for the following season (Porzio
and Brady 2008). In 2001 the squid fishery was included under the federal Coastal Pelagic Species Fishery
Management Plan (CPS FMP), listed as a monitored species overseen by the National Marine Fisheries Service
(NMFS), and the Pacific Fishery Management Council (PFMC), which designated authority for management to
the Department. In 2004 the California Fish and Game Commission approved the Market Squid Fishery
Management Plan, which went into effect at the start of the 2005/2006 fishing season (CDFW 2005). The plan
contains measures such as weekend closure dates (noon Friday to noon Sunday), which provide for
uninterrupted spawning; a restricted access program with provisions for initial entry into the fishery, permit
types, permit fees and permit transferability; an annual (1 April to 31 March) catch limit of 118,000 short tons
(107,047 MT) (Porzio 2012) (CDFW 2005); and numerous spatial closures. In 2015, 75 vessel permits (66
transferable), 34 light boat permits, 44 brail (scoop net) permits (only one of which landed squid) and zero
experimental permits were issued (PFMC 2017). Of the 75 vessel permits issued, 57 made commercial landings
in 2015, with 45 making up 95% of the landings (by tonnage) (PFMC 2017).
A proxy MSY approach in the MSFMP employs the "egg escapement method" (discussed in Criterion 1 and
Criterion 3). The method is considered an informal assessment tool with the aim of maintaining a long-term
average catch similar to what would be harvested using MSY (Macewicz et al., 2004) (PFMC 2011). This
threshold is currently set at 30% (a “preliminary statistic intended as a precautionary reference point” (PFMC
2011)). In order to successfully use the egg escapement method, data need to be analyzed in a timely manner
to enable effective management actions. The egg escapement model is not used as a real-time tool for
management (pers. comm., Dorval 2018), but rather a method of assessing the effectiveness of management,
which is an appropriate use regarding the accuracy of the model. The assumptions of the egg escapement
model are that a) only mature squid are harvested, b) potential fecundity and number of eggs are accurately
measured, c) life history parameters such as natural mortality and egg laying rate are accurately estimated, and
d) instantaneous fishing mortality can be used as management units (e.g., used as fishing effort) (Macewicz et
al. 2004) (PFMC 2014).
8Production Statistics
Though established in 1863, California’s market squid fishery did not expand much until the 1980s to 1990s.
Diminishing squid fisheries in other parts of the world coupled with an expanding market in China drove demand
for increased landings of market squid from the US West Coast (NMFS 2012). Landings have been almost
entirely from nearshore waters in California (NMFS 2016). Though environmental factors, largely El Nino events,
have limited landings in some years, the overall trend has been toward increased landings (Figure A), and the
value has increased as well (Figure B). Market squid landings were over 104,084 MT in 2014 (NMFS, 2016a),
down slightly from a record high of 130,851 MT in 2010 (NMFS 2016a) when the catch limit was exceeded (it
was also exceeded the following year) (Figure B). In 2010, the mass of this single species fishery was
approximately 66% of all capture fisheries in California as well as 41% of the value (Sweetnam 2011). These
high landings represent a major increase from lower production levels from 2003 to 2008, when landings fell as
low as 40,011 MT (Figure A). Although landings in the Southern California Bight (the southern fishery) have
exhibited "regional domination" in recent years, market squid landings in Monterey Bay (the northern fishery)
increased sharply in 2010 and 2011 (Sweetnam 2011). Monterey Bay landings had been less than 1,000 MT per
year from 2007 to 2009, but increased to over 20,000 MT in 2010 (Sweetnam 2011) and 2014 (Van Noord and
Dorval 2017).
Figure A:
Figure 1 Commercial landings (metric tons) of market squid in California from 1979-2015. Data from CDFW
2017.
9Figure B:
Figure 2 Commercial landings (short tons) and ex-vessel value ($) of market squid in California from 2000-2017.
Red line is catch limit; this was exceeded in the 2010-2011 and 2011-2012 seasons. Data from CDFW 2018.
Importance to the US/North American market.
The value of market squid has increased dramatically over the past decade (Figure B), and in recent years squid
landings have contributed more to the ex-vessel value of all West Coast landings than all finfish combined
(Figure C). In 2011, 130,027,624 kilos (~130,027.624 MT) of squid were exported out of California ports, worth
USD 178.5 million. The volume exported was higher than the yearly quota indicating it included inventories from
previous years (PFMC 2014), though the quota was also exceeded in 2010 (Figure B). China received 58% of
this export, with over 80% of the total export going to China, Philippines, Spain, Vietnam, Japan, and Hong
Kong. The domestic sales were mostly made to restaurants, Asian fish markets, or as bait.
10Figure C:
Figure 3 Percentage contribution of west coast CPS finfish and market squid landings to the total ex-vessel
value of all west coast landings from 1981-2011 (Figure from PFMC, 2014).
Common and market names.
Market squid have previously been referenced in the literature as Loligo opalescens, prior to the name change
to Doryteuthis opalescens. Common names for market squid include California market squid, squid, calamari,
and opalescent inshore squid (FDA 2016).
Primary product forms
Edible parts of squid include the arms, the mantle (tube), and the fins. Cleaned tubes and arms, squid rings,
stuffed squid, squid steak, and calamari are the primary product forms for human consumption (Sea Fare Group
2011). Squid are an excellent source of protein, selenium, riboflavin, and vitamin B12 (NFMS 2012d). Although
most market squid is frozen prior to human consumption, smaller amounts are sold fresh or canned. Market
squid is also sold frozen or live as bait for commercial and recreational fisheries (Porzio and Brady 2008).
11Assessment
This section assesses the sustainability of the fishery(s) relative to the Seafood Watch Standard for Fisheries,
available at www.seafoodwatch.org. The specific standard used is referenced on the title page of all Seafood
Watch assessments.
Criterion 1: Impacts on the Species Under Assessment
This criterion evaluates the impact of fishing mortality on the species, given its current abundance. When
abundance is unknown, abundance is scored based on the species’ inherent vulnerability, which is calculated
using a Productivity-Susceptibility Analysis. The final Criterion 1 score is determined by taking the geometric
mean of the abundance and fishing mortality scores. The Criterion 1 rating is determined as follows:
Score >3.2=Green or Low Concern
Score >2.2 and ≤3.2=Yellow or Moderate Concern
Score ≤2.2=Red or High Concern
Rating is Critical if Factor 1.3 (Fishing Mortality) is Critical
Guiding Principles
Ensure all affected stocks are healthy and abundant.
Fish all affected stocks at sustainable level.
Criterion 1 Summary
CALIFORNIA MARKET SQUID
Region | Method Abundance Fishing Mortality Score
California/Eastern Central 3.67: Low Concern 3.00: Moderate Concern Green (3.318)
Pacific | Purse seines |
United States of America
Criterion 1 Assessment
SCORING GUIDELINES
Factor 1.1 - Abundance
Goal: Stock abundance and size structure of native species is maintained at a level that does not impair
recruitment or productivity.
5 (Very Low Concern) — Strong evidence exists that the population is above an appropriate target
abundance level (given the species’ ecological role), or near virgin biomass.
3.67 (Low Concern) — Population may be below target abundance level, but is at least 75% of the target
level, OR data-limited assessments suggest population is healthy and species is not highly vulnerable.
2.33 (Moderate Concern) — Population is not overfished but may be below 75% of the target abundance
level, OR abundance is unknown and the species is not highly vulnerable.
1 (High Concern) — Population is considered overfished/depleted, a species of concern, threatened or
endangered, OR abundance is unknown and species is highly vulnerable.
12Factor 1.2 - Fishing Mortality
Goal: Fishing mortality is appropriate for current state of the stock.
5 (Low Concern) — Probable (>50%) that fishing mortality from all sources is at or below a sustainable
level, given the species ecological role, OR fishery does not target species and fishing mortality is low
enough to not adversely affect its population.
3 (Moderate Concern) — Fishing mortality is fluctuating around sustainable levels, OR fishing mortality
relative to a sustainable level is uncertain.
1 (High Concern) — Probable that fishing mortality from all source is above a sustainable level.
CALIFORNIA MARKET SQUID
Factor 1.1 - Abundance
CALIFORNIA/EASTERN CENTRAL PACIFIC, PURSE SEINES, UNITED STATES OF AMERICA
Low Concern
There are no estimates of a sustainable level of abundance for California market squid, and abundance is
unknown (PFMC 2010), in great part because the constant population turnover (see PSA below) makes it very
difficult to extrapolate long term trends in abundance. Management reference points are based on an "egg-
escapement model," which allows for the estimation of reproductive output and fishing mortality rates, but this
approach is not designed to assess species abundance and is not intended for that purpose in this
fishery (Dorval et al. 2013) (pers. comm., J. Lindsey, April 2017).
A PSA analysis (see below) suggests that life history characteristics indicate a moderate-to-high productivity.
The fishery targets mature spawners and uses lights to aggregate them. In the case of longer-lived species
that spawn multiple times, targeting spawning aggregations can increase the vulnerability of the species to
overfishing. Market squid, however, die after spawning and the fishery has been found to catch very few
immature individuals (Macewicz 2004). Research on squid captured within the spawning grounds and brought
into captivity has led to the suggestion that squid may not spawn for up to two weeks after arrival to the
spawning grounds (Perretti et al. 2016), but when observed in the wild it was concluded that six days is likely
the maximum longevity of a squid in the spawning grounds (Macewicz 2004). Thus, we have deemed market
squid to have a moderate vulnerability to the fishery.
Although there are order of magnitude fluctuations in biomass over time, the available evidence suggests little
reason for concern:
Commercial landings data show an upward trend in CPUE (catch per unit effort) from the 2005/2006 to the
2014/2015 fishing seasons (Figure 1) (Van Diggelen 2017).
The mean size (measured by mantle length) and mean individual mass of squid caught by the fishery
remained stable from 2000 to 2013 (Figure 2) (Protasio et al. 2014).
The median size of pre-spawning market squid taken in an annual rockfish midwater survey remained
stable or even increased over the 2004 to 2015 time series (although uncertainty in the estimate is high)
(Figure 3) (Ralston et al. 2018). This research also suggests that surveys of juvenile market squid through
trawl sampling could be used as an indicator of population biomass and future landings in the
fishery (Zeidberg et al. 2006) (Ralston et al. 2018).
Recent studies utilizing fishery independent data primarily focus on midwater trawls examining
paralarval (Van Noord and Dorval. 2017) (Wells et al. 2017) and juvenile squid abundance (Ralston et al.
2018), which as stated above correlate well with the future CPUE observed when the paralarval cohort
observed reaches full maturation and is therefore targeted by the fishery. The paralarval and juvenile
13abundance shows that, though catch rate was relatively high from 2010 to 2015 (Van Diggelen 2017),
paralarval abundance was anomalously high during the same time period (Wells et al. 2017). Furthermore,
Van Noord and Dorval (2017) conclude that the highest impact on paralarval (and therefore adult) market
squid abundance appeared to be environmental factors, with their study focusing on El Niño and La Niña
conditions specifically.
In summary, although abundance relative to sustainable levels is unknown, the combination of a non-high
vulnerability to overfishing and multiple data-poor approaches, with distinct data sources suggesting no reason
to conclude the stock is overfished, allows for a score of “low" concern.
Justification:
Figure 4 Market squid catch per unit effort from commercial data (landings/set) for the seasons 2005-2006 to
2014/2015 (Van Diggelen, 2017).
14Figure 5 Mean (±SD) dorsal mantle length (DML; A) and mass (B) for male and female California market squid
across all regions by commercial fishing season (Figure from Protasio et al., 2014).
Figure 6 Median mantle length of market squid taken in the midwater trawl survey from 2004-2015. The 5th
(p05), 25th (p25), 50th (median), 75th (p75), and 95th (p95) percentiles of survey catches are depicted for
each year (Figure from Ralston et al., 2018).
Market squid are short-lived, semelparous animals, meaning they live less than one year and die soon after
15spawning. As a result, there is no generational overlap and the population size reflects only the previous
generation’s spawning success and the new generation’s survivorship (Dorval et al. 2013) (Zeidberg 2013).
The commercial harvest from year to year is inconsistent, and numerous studies indicate paralarval
abundance is highly linked to environmental factors (Vojkovich 1998) (Zeidberg et al. 2006) (Koslow and Allen
2011) (Van Noord and Dorval 2017).
The best measure currently for squid population trends is the catch data provided by the fishery (PFMC 2014).
Established in 1863, California’s market squid fishery did not expand much until the late 1980s. Seasonal
landings of market squid began and continued to increase from 1986 until 2003 to 2008, when landings fell
from a high of 118,902 MT to a low of 38,099 MT (CDFW 2016a) (Figure 1). Landings started to rebound after
2009, and in 2013 the market squid fishery was California’s largest fishery, with landings estimated at 104,404
MT (PFMC 2014), a value that was maintained in 2014 with landings over 104,084 MT. In 2015–2016 the
population again declined to 2003 to 2008 levels (CDFW 2016a) (Figure 1). Although fishing occurs
predominately on spawning aggregations in shallow water, squid have been documented at greater depths
(Zeidberg 2013) (Van Noord and Dorval 2017). Behavior can change during El Niño periods, driving the squid
to deeper water, resulting in low stock biomass in the shallower areas typically fished, and rendering the
stock unavailable to the fishery (Van Noord and Dorval. 2017). Therefore, it is unclear if trends in catch data
reflect availability to the fishery or overall stock size (NMFS 2012) (CDFW 2005). Landings are also affected by
squid size available to the fishery and market demand.
Environmental factors play a large role in influencing market squid biomass, and can be the cause of large
declines in commercial landings in some years. Large inter-annual population fluctuations are believed to
largely occur in response to environmental factors (Vojkovich 1998) (Zeidberg et al. 2006) (Koslow and Allen
2011) (Van Noord and Dorval 2017), and market squid abundance appears to be strongly related to El Niño
Southern Oscillation (ENSO) cycles. During extreme El Niño events (e.g., 1982–83, 1997–98, 2006), both squid
landings and catch per unit effort declined (Zeidberg et al. 2004) (Porzio 2012), although in La Niña years they
have historically been high (Marinovic 2007) (Marinovic 2003). The available evidence suggests that dramatic
fluctuations in landings are more likely due to changes in abundance driven by environmental factors, rather
than shifts in availability to the fishery (Reiss et al. 2004) or as the result of pressures exerted by the
fishery (Van Noord and Dorval 2017).
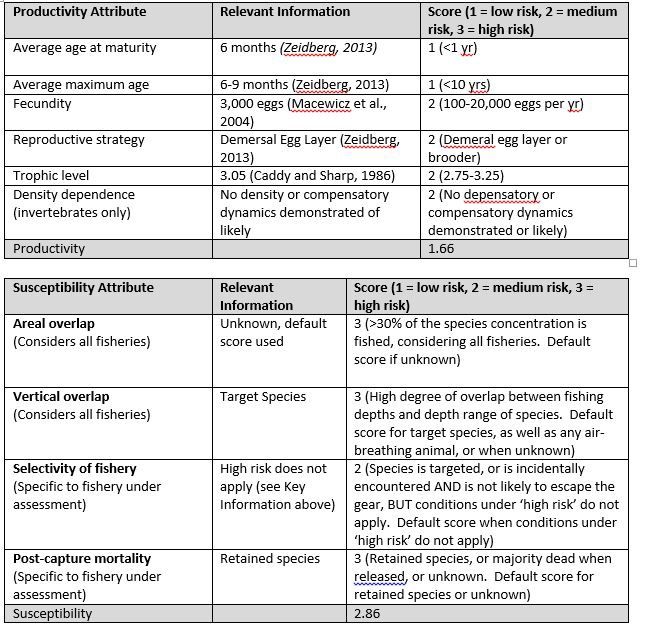
Productivity-Susceptibility Analysis:
Figure 7
Using the scores presented in the table below, it was determined that market squid have an overall
productivity score (P) of 1.66 and an overall susceptibility score (S) of 2.33, giving market squid a vulnerability
score (V) of 2.862, a medium level of vulnerability. For details on the PSA scoring and approach, please see
the Seafood Watch Standard for Fisheries (v3.1) on our website at http://www.seafoodwatch.org/seafood-
recommendations/our-standards (permalink http://www.montereybayaquarium.org/-
16/m/C3EE8C68DA2A47B18A64BE6DBA72F76F.pdf).
Figure 8
Factor 1.2 - Fishing Mortality
CALIFORNIA/EASTERN CENTRAL PACIFIC, PURSE SEINES, UNITED STATES OF AMERICA
Moderate Concern
For market squid, egg escapement is currently used as a proxy for MSY, with escapement limits set at
0.30 (PFMC 2014). Dorval et al. (2013) estimated a range of 0.08 to 0.75 (and in most quarters higher than
0.3) when they broke down the most heavily fished areas on the California coastline into three separate
regions. This suggests that proportional egg escapement was generally higher than 30% in most fishing
seasons during that time period (Dorval et al. 2013). The data used in that study were from 1999 to 2006,
now more than a decade old. Work is currently ongoing to improve understanding of the fishery’s impacts on
17the population, including improvement in the timely estimation of critical parameters of the egg escapement
model (“the mantle condition index”) (McDaniel 2015) and extension of the Dorval et al. (2013) time series to
2014, and the development of a long-term index of paralarval abundance (Van Noord and Dorval 2017) (Wells
et al. 2017) (Ralston et al. 2018) (PFMC 2017). Based on the information currently available, however, it is
unclear whether the egg escapement model is a good proxy for MSY, or whether egg escapement in recent
years has been above the goal. For these reasons, fishing mortality relative to a sustainable level is
considered unknown, and a score of "moderate" concern is applied.
Justification:
For market squid, the Overfishing Limit (OFL) and Allowable Biological Catch (ABC) are both set at the fishing
mortality that results in a threshold level of egg escapement of at least 30% (the proxy for MSY)
(http://www.pcouncil.org/wp-content/uploads/I2c_SUP_SSC_NOV2010BB.pdf). At the time these thresholds
were set, managers considered the state measures in place (weekend closures, area closures, harvest cap)
enough of a buffer to not worry about setting the ABC lower than the OFL (pers. comm., J. Lindsey, 29 March
2017).
Recent efforts to better estimate market squid biomass and egg escapement are improving researchers’
abilities to determine abundance and fishery impact. One study in particular broke down the California
coastline into the three major fishing regions, each of which encompass multiple known spawning
grounds (Dorval et al. 2013) (Figure 7). This model demonstrated a certain level of variability in spawning
biomass based on fishing region, producing a maximum peak abundance of spawning stock in two of the three
regions studied ranging from 215,000 to 254,000 MT in a single quarter (Figure 6). The third region studied
was often several orders of magnitude lower. However, authors noted that, given the inherent annual and
inter-annual variability in the market squid population, real time sampling would be needed to make any
conclusive statements about long term trends in the fluctuations of biomass in a healthy market squid
population. Such sampling would be both exceptionally time consuming and costly. For these reasons there
are no biological reference points based on biomass for this fishery. CDFW uses the “egg escapement
method” as a measure of fishing mortality (CDFW 2005). This approach relies on mantle length and gonad
measurements. The method assumes the weight of a typical egg and uses that to compute the number of
eggs in a sampled female, and then compares that value to the potential fecundity at the given mantle length
in order to compute the realized fecundity. A mean is calculated for the stock based on the samples taken in
given areas at given times, resulting in an egg escapement value for the stock. The target reference used
under this approach is the ratio of realized- to maximum-potential fecundity and is set at an egg escapement
of 0.30. However, given that different fishing levels can produce a 30% proportional egg escapement (pers.
comm., E. Dorval, 11 October 2016), it is difficult to directly convert this into a relative FMSY.
18Figure 9 Landings (Mt) of market squid in California by Region and quarter from 1999 to 2006 (Figure from
Dorval et al., 2013).
19Criterion 2: Impacts on Other Species All main retained and bycatch species in the fishery are evaluated under Criterion 2. Seafood Watch defines bycatch as all fisheries-related mortality or injury to species other than the retained catch. Examples include discards, endangered or threatened species catch, and ghost fishing. Species are evaluated using the same guidelines as in Criterion 1. When information on other species caught in the fishery is unavailable, the fishery’s potential impacts on other species is scored according to the Unknown Bycatch Matrices, which are based on a synthesis of peer-reviewed literature and expert opinion on the bycatch impacts of each gear type. The fishery is also scored for the amount of non-retained catch (discards) and bait use relative to the retained catch. To determine the final Criterion 2 score, the score for the lowest scoring retained/bycatch species is multiplied by the discard/bait score. The Criterion 2 rating is determined as follows: Score >3.2=Green or Low Concern Score >2.2 and ≤=3.2=Yellow or Moderate Concern Score ≤=2.2=Red or High Concern Rating is Critical if Factor 2.3 (Fishing Mortality) is Crtitical Guiding Principles Ensure all affected stocks are healthy and abundant. Fish all affected stocks at sustainable level. Minimize bycatch. Criterion 2 Summary Only the lowest scoring main species is/are listed in the table and text in this Criterion 2 section; a full list and assessment of the main species can be found in Appendix A. CALIFORNIA MARKET SQUID - CALIFORNIA/EASTERN CENTRAL PACIFIC - PURSE SEINES - UNITED STATES OF AMERICA Subscore: 5.000 Discard Rate: 1.00 C2 Rate: 5.000 Species Abundance Fishing Mortality Subscore No other main species caught There is currently no observer program in place for the squid fishery. A pilot observer program from 2004 to 2008 found no species that regularly consist of >5% of the catch in this fishery (see tables in the discards section below). Pacific sardine, Chinook salmon, and marine mammals are discussed below, but none are assessed any further herein (see p. 16 in the Seafood Watch Wild Capture Standard V 3.2 for an explanation of the thresholds for inclusion in an assessment). - Pacific sardine are incidentally caught and landed, and though the volume landed is typically low relative to the directed fishery, the incidental catch has increased as a percentage of total fishing mortality due to zero landings from directed fisheries in the US (closed since July 2015) and Canada (since 2012). From 2017 landings data, less than 0.1% of market squid landings contained NSP sardine, accounting for
- Chinook salmon is caught and is a species of concern, but the occurrences of this species as bycatch are
reported to be very infrequent, and in most years were reported in less than 1% of all observed loads (PFMC
2014), levels deemed by managers to be low enough to not be of concern (pers. comm., J. Lindsay, 3 October
2016).

 - Some marine mammals, specifically sea lions, seals, and common dolphins as well as gulls are considered
occasional bycatch (PFMC 2011). The mammals are not generally caught, but rather seen jumping in and out
of the net, and managers do not consider the bycatch of marine mammals a concern for this fishery (pers.
comm., J. Lindsay, 3 October 2016). Furthermore, NOAA classifies the California market squid fishery as a
Category III fishery, meaning that there is "a remote of or no known incidental mortality and serious injury of
marine mammals"(NOAA 2018). The effects of so-called "seal bombs" being used to protect nets and otherwise
deter marine mammals in the market squid fishery are unknown. The noise from detonations, which can
number up to tens of thousands in a single site a month, could potentially affect the behaviour of marine
mammals, especially cetaceans such as blue and fin whales, Cuvier's beaked whales, and Pacific-white sided
and Risso's dolphins. Risso's dolphins could be especially vulnerable to the noise source, as they tend to be less
opportunistic in their prey selection than other mammals and so may be more dependent on squid abundance.
Research on this topic is in the early stages, with nothing on actual impacts published or conclusive at this time
(Meyer-Löbbecke 2017) (Meyer-Löbbecke 2016) (pers. comm., S. Baumann-Pickering, UCSD 2018).

2.4 - Discards + Bait / Landings
CALIFORNIA / EASTERN CENTRAL PACIFIC, PURSE SEINES, UNITED STATES OF AMERICA
< 100%
Discards are minimal (Table 2) and no bait is used in this fishery.
Justification:

                                                        21
Figure 11 Preliminary catch summary from vessels targeting market squid from NMFS-SWR coastal pelagic
species pilot observer program, 2004-2008. Table from (PFMC 2011)
(PFMC 2011).
Figure 12 Annual reported squid landings and incidental catch reported on landing receipts with greater than
fifty percent market squid (by tonnage per landing) from 2008 – 2013 for round haul purse seiners. Table
adapted from (PMFC, 2014) and (NMFS, 2016).
(PFMC 2014) (NMFS 2016).
22Criterion 3: Management Effectiveness
Five factors are evaluated in Criterion 3: Management Strategy and Implementation, Bycatch Strategy, Scientific
Research/Monitoring, Enforcement of Regulations, and Inclusion of Stakeholders. Each is scored as either
‘highly effective’, ‘moderately effective’, ‘ineffective,’ or ‘critical’. The final Criterion 3 score is determined as
follows:
5 (Very Low Concern) — Meets the standards of ‘highly effective’ for all five factors considered.
4 (Low Concern) — Meets the standards of ‘highly effective’ for ‘management strategy and implementation‘
and at least ‘moderately effective’ for all other factors.
3 (Moderate Concern) — Meets the standards for at least ‘moderately effective’ for all five factors.
2 (High Concern) — At a minimum, meets standards for ‘moderately effective’ for Management Strategy and
Implementation and Bycatch Strategy, but at least one other factor is rated ‘ineffective.’
1 (Very High Concern) — Management Strategy and Implementation and/or Bycatch Management are
‘ineffective.’
0 (Critical) — Management Strategy and Implementation is ‘critical’.
The Criterion 3 rating is determined as follows:
Score >3.2=Green or Low Concern
Score >2.2 and ≤3.2=Yellow or Moderate Concern
Score ≤2.2 = Red or High Concern
Rating is Critical if Management Strategy and Implementation is Critical.
GUIDING PRINCIPLE
The fishery is managed to sustain the long-term productivity of all impacted species.
Criterion 3 Summary
Research
Management Bycatch and Stakeholder
Fishery Strategy Strategy Monitoring Enforcement Inclusion Score
Fishery 1: California / Eastern Moderately Highly Moderately Moderately Highly Yellow
Central Pacific | Purse seines | Effective Effective Effective Effective Effective (3.000)
United States of America
Criterion 3 Assessment
Factor 3.1 - Management Strategy and Implementation
Considerations: What type of management measures are in place? Are there appropriate management goals,
and is there evidence that management goals are being met? Do manages follow scientific advice? To achieve a
highly effective rating, there must be appropriately defined management goals, precautionary policies that are
based on scientific advice, and evidence that the measures in place have been successful at
maintaining/rebuilding species.
23CALIFORNIA / EASTERN CENTRAL PACIFIC, PURSE SEINES, UNITED STATES OF AMERICA
Moderately Effective
The market squid fishery is managed by the California Department of Fish and Wildlife under the Market Squid
Fishery Management Plan. Measures include weekend closure dates (noon Friday to noon Sunday), which
provide for uninterrupted spawning; a restricted access program with provisions for initial entry into the
fishery, permit types, permit fees and permit transferability; an annual (1 April to 31 March) catch limit of
118,000 short tons (107,047 MT) (Porzio 2012) (CDFW 2005), and numerous spatial closures. The CDFW is
currently in the process of revising the Marine Life Management Master Plan, which will influence the way all
California fisheries are managed (CDFW 2018). In addition, the CDFW is working on an "Enhanced Status
Report" which can act as a tool to inform any actions (pers. comm., CDFW 2018). Whether any of this work
will lead to actual changes in the management of the market squid fishery is yet to be seen.
The fishery is also monitored under the Coastal Pelagic Species Fishery Management Plan at the Pacific
Fishery Management Council. Although no biomass-based reference points have been developed due to the
life history and plasticity of the species, numerous data-poor approaches suggest little reason for concern over
the population being overfished (see Criterion 1). Fishing mortality-based reference points have been set at a
threshold of two consecutive years of exceeding the egg escapement goal of at least 30% (see Criterion 1), at
which point it could be considered for more active management. It is not clear how the PFMC determines
whether escapement goals have been met in a timely manner; however, since the latest analysis was by
Dorval et al., based on data from 1999 to 2006 (Dorval, Crone, and J.D. McDaniel. 2013). The fishery lacks the
more robust reference points and stock assessments used for similar fisheries around the world (e.g.,
Japanese flying squid in Japan (Yamashita, Norio, et al. 2013) (Hideaki, Kidokoro. et al. 2013) (Japanese
Fisheries Agency 2015) (Japanese Fisheries Agency 2015); longfin squid in the US—biomass reference points
only (Hendrickson, L.C. 2017)). The strategy also has a weakness in terms of ratcheting down permitted
fishing mortality during years of low abundance, and there is no minimum biomass set below which fishing
should not occur. For these reasons, management strategy and implementation is deemed "moderately
effective."
Justification:
Both the annual catch limit and the egg escapement limits were formulated partially in consideration of the
fishing mortality of the previous decade, during which time there were multiple years with landings >100,000
tons without any decline in landings during the following years, indicating this level of catch is
sustainable (CDFW 2005). Catch limits based on historical catch are supported by guidance from NOAA
fisheries, which states that “in data-poor situations such as the market squid fishery, a proxy may be used for
MSY, and that it is reasonable to use recent average catch from a period when there is no qualitative or
quantitative evidence of declining abundance” (PFMC 2014). A proxy was therefore used to determine the MSY
because there was not adequate data to make a mathematical MSY determination. The average of the
landings obtained in the ten, five, and three years before the report was used as a proxy for MSY. This was
then used to determine the annual catch limit (118,000 short tons), though the least conservative (highest
volume) catch limit was ultimately selected (CDF&G 2005, Table 3.2), a limit based on historically high
landings in the three immediately preceding seasons (1999 to 2002). The ability of the fishery to support
landings of greater than 100,000 tons in the 1999/2000 fishing season and then sustain landings of the same
magnitude over the next two seasons was thought to demonstrate the population could withstand this level of
fishing (CDFW 2005). Dorval et al. (2013) agreed with this sentiment, indicating that because the fishery
captures mostly adult squid (95% of landings) that have likely already released much of their eggs before
capture combined with the weekend, Channel Island, and MPA closures give the opportunity for a high
proportion of egg escapement to offset the negative effects of the fishery on the stock (Dorval, Crone, and J.D.
McDaniel. 2013)
Large-scale spatial closures within state-designated ecological reserves, such as the Channel Islands and
areas protected under the Marine Life Protection Act (MLPA), provide additional areas where uninterrupted
spawning can occur (Porzio 2012). At least 14.6% of available market squid spawning grounds in Southern
24California are within no-take marine protected areas, but the relative contribution of these MPAs to market
squid spawning success and recruitment is not known (Van Diggelen 2017).
Permits are required for any directed take of market squid (CDFW 2013). The catch limit does not take into
consideration market squid caught for use as bait, since this is believed to be a relatively low percentage of
catch for this species. Furthermore, there is the question of the presence of market squid egg capsules in a
small percentage of the purse seines. Despite the suggestion that the origin of these egg capsules could be
explained by aging the embryos within the egg capsules to determine whether or not they were laid after the
squid within the net had been captured, there is no evidence this has thus far been implemented (PFMC
2014). This is more fully addressed in Criteria 4.1a.
Factor 3.2 - Bycatch Strategy
Considerations: What type of management strategy/measures are in place to reduce the impacts of the fishery
on bycatch species and when applicable, to minimize ghost fishing? How successful are these management
measures? To achieve a Highly Effective rating, the fishery must have no or low bycatch, or if there are bycatch
or ghost fishing concerns, there must be effective measures in place to minimize impacts.
CALIFORNIA / EASTERN CENTRAL PACIFIC, PURSE SEINES, UNITED STATES OF AMERICA
Highly Effective
Based on the catch reported via landing receipts with greater than 50% market squid, this fishery has very
limited bycatch, and with no species besides the target species making up >5% of the catch, no species of
concern regularly caught, and limits in place for the incidental catch of sardine, bycatch strategy is deemed
"highly effective."
Factor 3.3 - Scientific Research and Monitoring
Considerations: How much and what types of data are collected to evaluate the fishery’s impact on the species?
Is there adequate monitoring of bycatch? To achieve a Highly Effective rating, regular, robust population
assessments must be conducted for target or retained species, and an adequate bycatch data collection
program must be in place to ensure bycatch management goals are met.
CALIFORNIA / EASTERN CENTRAL PACIFIC, PURSE SEINES, UNITED STATES OF AMERICA
Moderately Effective
The short lifespan and rapid turnover of the California market squid make it challenging to establish an
accurate, up-to-date stock assessment. Though egg escapement data are calculated based on gonad weight
of captured squid (PFMC 2017) and some scientific studies have been conducted on the impact of the fishery
on the market squid population, the large time and monetary commitment required to collect samples for
these studies limit them to a frequency too low to enable implementation of real-time management strategies.
Research has been conducted that suggests exploitation may be at a sustainable level, but it is currently based
on fisheries data only (Dorval, Crone, and J.D. McDaniel. 2013)(Protasio 2014), and in the case of Dorval et
al., on data that is more than ten years old. There is no public evidence that egg escapement is calculated in
reasonable timeframes. Studies examining the use of paralarval abundance as an indicator of future CPUE
have demonstrated this as an effective and accurate tool (see Criterion 1.1). If used in management, this
should aid greatly in the ability to estimate each year’s exploitable biomass through annual pre-fishing season
surveys, as is strongly recommended for cephalopod fisheries by researchers, e.g. (Rodhouse et al. 2014) and
is conducted for some other squid fisheries (see C3.1).
25Bycatch is thought not to be a problem, based on a pilot observer program in place from 2004 to 2008.
However, it would be prudent to confirm that this is still the case given that the study was conducted a decade
ago and there have been anecdotal reports of Risso's dolphins (a species not observed caught during the pilot
program) caught in squid nets in 2018 (KION 2018). In addition, current efforts to determine the impacts of
deterrents such as seal bombs on mammals associated with the squid fishery, especially Risso's dolphins,
should be continued (see Criterion 2).
The score for this factor is driven by a rating of "moderately effective" for the research and monitoring of the
fishery’s impacts on the squid population.
Justification:
As mentioned above there are no estimates of biomass currently available for this species. Though there are
some data on the stock status in regards to long term trends, at this time “there is no reliable measure of
annual recruitment success beyond information obtained from the fishery” (PFMC 2014); nonetheless, studies
on paralarval abundance have given a valuable insight into the effects of environmental fluctuations on the
market squid population. Koslow and Allen, (2011) found that market squid paralarval abundance in the
Southern California bight is significantly correlated with near-surface temperature, nutrient and chlorophyll
concentrations, the El Niño-Southern Oscillation Index (ENSO), and to a lesser extent with the Pacific Decadal
Oscillation (PDO) (Koslow and Allen 2011). A more recent study has concluded that, not only does abundance
of market squid at all life stages decline during El Niño, but adult squid behavior changes in a way that
reduces catchability (Van Noord and Dorval 2017). ENSO and PDO indices could thus be used as a rough
fishery independent indicator of market squid stock size. Monitoring of the ENSO and PDO indices could be
used to predict an upcoming drop in the market squid stock size and facilitate adaptive, real-time
management of the market squid resource (Koslow and Allen 2011), but this has not yet been attempted.
Numerous studies have been conducted on the reproductive habits of market squid (Macewicz 2004)
(Forsythe, Kangas, and Hanlon. 2004) (Zeidberg, et al. 2011)(Zeidberg, et al. 2004), a particularly important
factor in informing the use of egg escapement as a proxy for MSY. Observations using ROVs during peak squid
mating season revealed that squid mating and egg laying predominantly occur at night on sandy bottoms and
within a narrow temperature range (10 to 14.4 °C) (Zeidberg, et al. 2011).
Studies have also been used to determine that the fishery has not had an impact on the size at maturity or sex
ratio (Protasio 2014). However, environmental factors such as the ENSO can have an effect on body size,
resulting in smaller squid with slower growth rates during El Niño compared to squid during La Niña (Jackson
and Domeier 2003) (Reiss et al. 2004). The standard method of recording body size in this species is through
measurement of the dorsal mantle length (DML) and body mass. Although both DML and mass frequently
fluctuate from season to season, there has been no indication of a substantial decrease in either category
over the past 13 years (Protasio 2014). A best-case model of spawning stock status and showed spawning
stock levels implied the current catch limit is quite conservative (Dorval, Crone, and J.D. McDaniel. 2013).
Dorval and his colleagues also looked at the maturity of squid caught by the fishery and found that immature
squid accounted for less than 5% of the catch in most of areas they studied, leading to the conclusion that the
spatial dynamics in the overall fishery do not appear to noticeably influence spawning and reproduction of the
overall squid population. However, the study acknowledged that, given the brevity of the fishing seasons (3 to
4 months) and the species’ rapid turnover of generations, it is difficult to collect and process enough samples
for this method to provide data for real time management.
A study conducted by Zeidberg et al. (2011) suggested that, when taking the average market squid lifespan (6
to 10 months) into consideration, many squid caught by the commercial fishery must have been spawned
during a season that has not traditionally supported the squid fishery. The authors suggest that surveys of egg
beds in the seasons that have not traditionally supported market squid fisheries would allow for better
understanding of migration and spawning patterns and could provide management with valuable information.
Many suggest incidences of bottom contact with the purse seines are minimal; the official stance of the Pacific
26Fishery Management Council is that the exact extent to which the purse seines contact the sea floor and
contribute to the mortality of market squid egg capsules is currently unknown (PFMC 2014). In this document
it is indicated that examining the egg capsules found within the purse seine and aging the embryos would be a
reliable method to determine if the eggs were taken from the sea floor or laid by already captured females
within the net; this practice does not appear to have been implemented at this time. Seafloor contact
associated with the use of purse seine nets in shallow water and the subsequent mortality of squid eggs have
been poorly studied, but acoustic techniques used to estimate egg beds on shallow substrates could help
assess this damage (Foote et al. 2006). It has been demonstrated that acoustic surveys could serve as
important management tools by efficiently mapping the locations of spawning grounds used, which are subject
to frequent change from one spawning season to the next (Young, et al. 2011) (Foote, et al. 2006).
Performing reconnaissance mapping early in each fishing season could help to determine how many spawning
areas are protected by MPAs already in place and designate seasonally adaptive no-take spawning zones if
needed. Estimating biomass of both reproductive output and the population could be used to help develop
stock assessments (Young, et al. 2011). However, a dynamic, spatially based management system would be
both cost and time prohibitive, and may not incur any additional benefits over the current static system, which
allows undisturbed areas to establish complex and resilient ecosystems overtime (pers. comm., Van Noord
2018).
Factor 3.4 - Enforcement of Management Regulations
Considerations: Do fishermen comply with regulations, and how is this monitored? To achieve a Highly Effective
rating, there must be regular enforcement of regulations and verification of compliance.
CALIFORNIA / EASTERN CENTRAL PACIFIC, PURSE SEINES, UNITED STATES OF AMERICA
Moderately Effective
CDFW enforces existing regulations through the use of mandatory logbooks and port-side samplers that collect
data on landings and bycatch. At this time there is no evidence of substantial illegal fishing. Monitoring of the
catch allows managers to close the fishery before the catch limit of 118,000 short tons (107,047 MT) is
reached e.g., (CFDW 2010)(CDFW2011). However, since the catch limit was implemented with the completion
of the Market Squid Fishery Management Plan in 2005, the catch limit has been exceeded twice, in 2010 and
2011 (see Figure B in the Introduction and repeated below), which suggests monitoring and enforcement may
not be enough to control fishing effort in years of high squid abundance. Enforcement is therefore considered
"moderately" effective for this fishery.
Justification:
The CDFW is the governing body that manages the California market squid fishery. There are several
mechanisms in place to work to ensure sustainable fishing practices within this fishery (CDFW 2005).
Permitting is well enforced, and there is a restricted access program in place for this fishery, which has a
capacity goal of 55 market squid vessel permits, 18 market squid brail permits, and 34 light boat permits.
Permits are not required to catch market squid for use as live bait, because this is believed to be a relatively
low percentage of catch for this species. Also important to the scoring of this factor is the enforced use of port
sampling and logbooks from the CDFW to track data on landings and bycatch. In addition to the pilot observer
program initiated by NMFS from 2004 to 2008, dock-side sampling for this species is currently conducted by
CDFW in the counties where the majority of squid landings occur. This includes Monterey, Santa Barbara,
Ventura, and Los Angeles, with the primary goal of “monitoring changes in the biological characteristics of
market squid in the fishery and to characterize California’s commercial market squid fishery.” Efforts have also
been made to obtain 12 samples of market squid per month from each main port complex and to get visual
27You can also read