California Sea Otter (Enhydra lutris nereis) Census Results, Spring 2019 - Data Series 1118 - USGS ...
←
→
Page content transcription
If your browser does not render page correctly, please read the page content below
California Sea Otter (Enhydra lutris nereis) Census Results,
Spring 2019

Data Series 1118

U.S. Department of the Interior
U.S. Geological Survey
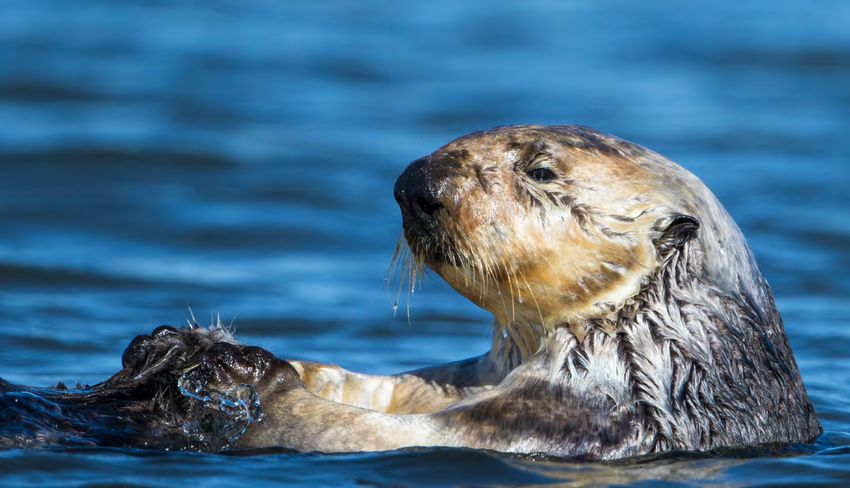
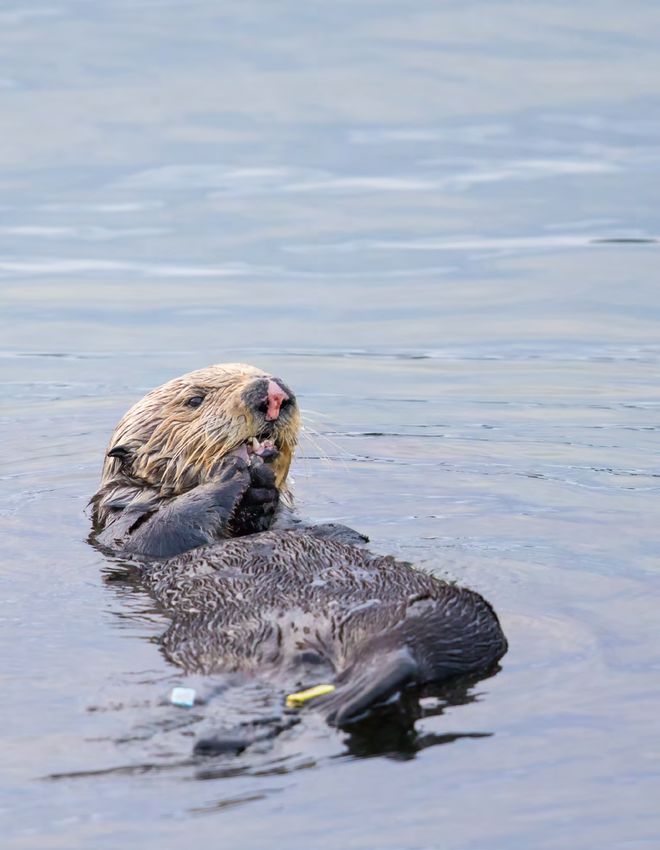
Front Cover. A male sea otter grooming between foraging dives in Elkhorn Slough, California. Photograph taken by Joe Tomoleoni,
U.S. Geological Survey, February 3, 2016.

Back Cover. A tagged female sea otter feeding on sand dollars in Monterey, California. Photograph taken by Joe Tomoleoni, U.S. Geological
Survey, February 28, 2018.
California Sea Otter (Enhydra lutris nereis)
Census Results, Spring 2019

By Brian B. Hatfield, Julie L. Yee, Michael C. Kenner, and Joseph A. Tomoleoni

Data Series 1118

U.S. Department of the Interior
U.S. Geological Survey
U.S. Department of the Interior
DAVID BERNHARDT, Secretary

U.S. Geological Survey
James F. Reilly II, Director

U.S. Geological Survey, Reston, Virginia: 2019

For more information on the USGS—the Federal source for science about the Earth, its natural and living
resources, natural hazards, and the environment—visit https://www.usgs.gov or call 1–888–ASK–USGS.
For an overview of USGS information products, including maps, imagery, and publications,
visit https://store.usgs.gov.

Any use of trade, firm, or product names is for descriptive purposes only and does not imply endorsement by the
U.S. Government.

Although this information product, for the most part, is in the public domain, it also may contain copyrighted materials
as noted in the text. Permission to reproduce copyrighted items must be secured from the copyright owner.

Suggested citation:
Hatfield, B.B., Yee, J.L., Kenner, M.C., and Tomoleoni, J.A., 2019, California sea otter (Enhydra lutris nereis) census
results, spring 2019: U.S. Geological Survey Data Series 1118, 12 p., https://doi.org/10.3133/ds1118.

ISSN 2327-638X (online)
iii

Acknowledgments
The annual census is conducted in partnership with personnel of the California Department
of Fish and Wildlife, Monterey Bay Aquarium, the U.S. Fish and Wildlife Service and others.
Experienced and dedicated volunteers also provided invaluable assistance. The NAVAIR
Ranges Sustainability Office of the U.S. Navy is acknowledged for access to and logistical
support for the sea otter surveys at San Nicolas Island. The Pacific Gas and Electric Company
is acknowledged for providing access to the coastline in the vicinity of the Diablo Canyon
Power Plant.
iv

     Contents
     Abstract............................................................................................................................................................1
     Introduction and Methods.............................................................................................................................1
     California Sea Otter Census Results............................................................................................................3
          Range-Wide Summary..........................................................................................................................3
          Range-Wide Trends...............................................................................................................................3
          Regional Trends......................................................................................................................................3
          Geographic Distribution......................................................................................................................10
     References Cited..........................................................................................................................................12

     Figures
              1.     Map showing distribution of sea otters along the mainland coast of central
                     California and at San Nicolas Island, 2019................................................................................2
              2.     Graph showing trends in abundance of sea otters in California, based on 3-year
                     running averages of raw counts.................................................................................................6
              3.     Graph showing regional trends in abundance of sea otters along the mainland
                     coast, central California, and at San Nicolas Island, southern California...........................7
              4.     Map showing variation in local population density of sea otters along the
                     mainland coast, central California..............................................................................................8
              5.     Map showing local trends in abundance of sea otters along the mainland coast,
                     central California...........................................................................................................................9
              6.     Graph showing variation over time in the location of the northern and
                     southern range boundaries of sea otters along the mainland coast, central
                     California, 1983–2019...................................................................................................................11

     Table
              1.     Summary of spring survey counts of sea otters in California, and 3-year
                     averages, 1983–2019.....................................................................................................................4

     Conversion Factors
     International System of Units to U.S. customary units

            Multiply                       By                    To obtain
                                        Length
      meter (m)                            3.281             foot (ft)
      meter (m)                            1.094             yard (yd)
      kilometer (km)                       0.6214            mile (mi)

     Datum
     Horizontal coordinate information is referenced to the World Geodetic System 1994.
California Sea Otter (Enhydra lutris nereis) Census
Results, Spring 2019
By Brian B. Hatfield, Julie L. Yee, Michael C. Kenner, and Joseph A. Tomoleoni
Abstract completed annually since 1982, except for 2011, when weather
conditions prevented survey completion. The survey entails
The 2019 census of southern sea otters (Enhydra lutris a combination of aerial and shore-based counts, providing an
nereis), also known as California sea otters, was conducted uncorrected and exhaustive count of the entire range of the sea
from early May to early July along the mainland coast of otter in coastal California. Shore-based counts are used in all
central California and in April at San Nicolas Island in areas accessible by ground-based observers, except in regions
southern California. The range-wide index, defined as the where sea otters tend to be located far offshore (such as
3-year average of combined counts from the mainland range shallow, sandy embayments) where they are more difficult to
and San Nicolas Island, was 2,962, a decrease of 166 sea count reliably from the shore. In these areas, aerial surveys are
otters from the index for the previous year. The 5-year flown along contiguous transects oriented parallel to the shore
average trend in the range-wide index, including both the and covering all areas between the coastline and the 60-meter
mainland range and San Nicolas Island populations, was flat (m) depth contour. Details of survey methods, as well as data
at 0.12 percent growth per year. The northern range boundary and metadata from this survey and surveys from previous
was not calculated because of limitations in survey resources years, are available in Hatfield and others (2019).
required to survey areas north of the range from the previous The spring 2019 mainland sea otter count began on
year (2018); however, the southern range boundary expanded May 1 and was completed by July 9, 2019. Overall viewing
slightly by 0.5 kilometer, where a negligible trend in sea conditions in 2019 were very good, better than those
otter counts (0.55 percent growth per year) corresponded to encountered during the 2018 spring census (View Score=3.0 in
the lack of meaningful population range expansion at the 2019 compared to 2.4 in 2018, where 0=poor, 1=fair, 2=good,
southern periphery. 3=very good, and 4=excellent). The surface canopies of kelp
(predominantly Macrocystis pyrifera) were qualitatively noted
by observers to be far below the seasonal normal in the central
portions of the mainland range (from Monterey to Cayucos)
Introduction and Methods and about normal near both ends of the mainland range. Sea
otters along the mainland were surveyed from Pigeon Point
A range-wide census is conducted collaboratively in San Mateo County in the north to Santa Barbara Harbor
each spring by the U.S. Geological Survey, the California in Santa Barbara County in the south (fig. 1). A separate,
Department of Fish and Wildlife, the Monterey Bay Aquarium, ground-based survey of the sea otter population at San Nicolas
and others to monitor trends in abundance and distribution of Island was completed earlier in the spring (April 19–23) under
the southern sea otter (Enhydra lutris nereis), also known as good/very good survey viewing conditions (View Score=2.5).
California sea otters, and thus to provide State and Federal Macrocystis canopies at San Nicolas Island were estimated to
resource agencies with the information requested for effective be below normal for the time of year.
management. The standardized census has been conducted and2 California Sea Otter (Enhydra lutris nereis) Census Results, Spring 2019
124° 123° 122° 121° 120° 119° 118°
38°
Pillar Point
Pigeon Point
Point Año Nuevo
37°
Capitola
Seaside
Monterey
Big Sur
36°
Cape
EXPLANATION
San Martin
Southern sea otter distribution
Current extent of Cayucos
established range
One extralimital sea otter
35°
WASHINGTON
IDAHO
Santa Barbara
OREGON Point
Conception Gaviota
State Rincon
Beach Point
34° NEVADA
CA
LI
FO
R San Nicolas Island
NI
Area A
of map
33°
Base map data from Google, 2018 0 25 50 100 KILOMETERS
Mercator Auxiliary Sphere, WGS 1984
0 25 50 100 MILES
Figure 1. Distribution of sea otters (Enhydra lutris nereis) along the mainland coast of central California and at San Nicolas Island,
2019.California Sea Otter Census Results 3
California Sea Otter Census Results Regional Trends
Regional trends in abundance within the mainland range
Range-Wide Summary can vary considerably. The 5-year trend for the center segment
of the range, between Seaside and Cayucos (fig. 3), remains
The Southern Sea Otter Recovery Plan (U.S. Fish and
positive at 2.38 percent per year ( = 1.02). One factor
Wildlife Service, 2003) recommends using the 3-year running
possibly contributing to the positive trend in the central range
average of total counts as the official metric for monitoring
is the recent increase in availability of sea urchins and mussels
trends, thereby reducing the influence of anomalously high
(sea otter prey), a phenomenon that likely has several causes
or low counts from any particular year. The 3-year average of
including the ecological absence of the predatory sunflower
combined counts from the mainland range and San Nicolas
star, Pycnopodia helianthoides, from a sea star wasting disease
Island therefore represents the official index of relative
(Burt and others, 2018). This surge in prey availability might
abundance for southern sea otters, the current value of which
explain the larger number of sea otters in this part of the range
is 2,962 (table 1).
over the last several years compared to the long-term average.
As previously noted by Hatfield and others (2018), the slowing
Range-Wide Trends trend in this area suggests a limit to the potential growth
owing to the prey subsidy.
There is a considerable degree of uncertainty (random The pattern is different to the north of the central region,
variation owing to sampling and measurement error) in with a 5-year trend of –8.72 percent per year ( = 0.91). The
any 1-year count, and thus longer-term trends are far more 5-year trend in the southern region was also negative this year
informative than year-to-year differences. We therefore report (–1.62 percent per year with = 0.98; fig. 3). The trends in
trends over the past 5 years as (the geometric mean of the the northern and southern regions are consistent with elevated
annual rate of change λ) and as mean percent change. The observations of shark-bite mortality in recent years in these
annual λ values are computed by dividing the 3-year running outer regions of lower population density (fig. 4). The specific
average count by the equivalent value from the previous areas where the population trends are most negative are in the
year. Thus, λ = 1 indicates a constant population or 0-percent north from Davenport to north Monterey Bay and in the south
change. Mean percent change is calculated from the mean rate from Pismo Beach to Lompoc (fig. 5). These areas tend to
of change as ( – 1) × 100 percent. have little or no kelp canopy and thus represent high-risk areas
The 3-year running average count of the mainland for sea otters, as the presence of kelp is believed to provide
population is 2,863, a decrease of 5.7 percent from the some degree of refuge from shark bites (Tinker and others,
previous-year value (table 1). This decrease in the 3-year 2015; Nicholson and others, 2018).
average is associated with a flattened 5-year trend for the There is no evidence of population growth in the 2019
mainland (–0.13 percent per year; = 1.00). The high pup- range-wide 5-year trend, nor in many areas to the north and
to-independent ratio observed in the spring of 2018 (22.5) in to the south of the central region (areas from which future
the mainland population dropped to a more typical value of range expansion would occur; fig. 5; Tinker and others, 2008;
16.0 in 2019 (table 1). The 3-year running average total count Lafferty and Tinker, 2014). Using the northern range extent
of the San Nicolas Island population increased to 99 (table 1), calculated in 2018, the 5-year trend in sea otter counts was
which continues a positive trend of about 9.58 percent per positive in the northern 30 kilometer (km) of the range at
year ( = 1.10; fig. 2). The overall 5-year trend for southern 9.4 percent growth per year and negligible in the southern
sea otters (including both mainland and San Nicolas Island 30 km of the range at 0.55 percent growth per year.
populations) is flat at 0.12 percent per year ( = 1.00).Table 1. Summary of spring survey counts of sea otters (Enhydra lutris nereis) in California, and 3-year averages, 1983–2019.
4 California Sea Otter (Enhydra lutris nereis) Census Results, Spring 2019
[—, no data; %, percent]
Mainland range San Nicolas Island Range-wide
Year Pups Total Pups Total Total Index of
Independents Pups Total Pups per 100 Independents Independents
(3-year (3-year (raw (raw (3-year relative
(raw count) (raw count)(raw count) independents (3-year average) (raw count)
average) average) count) count) average) abundance
1983 1,156 121 1,277 10.5 — — — — — — — —
1984 1,180 123 1,303 10.4 — — — — — — — —
1985 1,119 242 1,361 21.6 1,152 162 1,314 — — — — —
1986 1,358 228 1,586 16.8 1,219 198 1,417 — — — — —
1987 1,436 226 1,662 15.7 1,304 232 1,536 — — — — —
1988 1,504 221 1,725 14.7 1,433 225 1,658 — — — — —
1989 1,571 285 1,856 18.1 1,504 244 1,748 — — — — —
1990 1,466 214 1,680 14.6 1,514 240 1,754 14 3 17 — —
1991 1,700 241 1,941 14.2 1,579 247 1,826 14 2 16 — —
1992 1,810 291 2,101 16.1 1,659 249 1,907 10 2 12 15 —
1993 2,022 217 2,239 10.7 1,844 250 2,094 7 4 11 13 —
1994 2,076 283 2,359 13.6 1,969 264 2,233 10 4 14 12 —
1995 2,095 282 2,377 13.5 2,064 261 2,325 9 4 13 13 —
1996 1,963 315 2,278 16.0 2,045 293 2,338 12 4 16 14 —
1997 1,919 310 2,229 16.2 1,992 302 2,295 16 0 16 15 —
1998 1,955 159 2,114 8.1 1,946 261 2,207 12 2 14 15 —
1999 1,858 232 2,090 12.5 1,911 234 2,144 18 3 21 17 —
2000 2,053 264 2,317 12.9 1,955 218 2,174 21 2 23 19 —
2001 1,863 298 2,161 16.0 1,925 265 2,189 21 5 26 23 —
2002 1,846 293 2,139 15.9 1,921 285 2,206 22 5 27 25 —
2003 2,270 235 2,505 10.4 1,993 275 2,268 33 5 38 30 —
2004 2,495 330 2,825 13.2 2,204 286 2,490 27 4 31 32 —
2005 2,417 318 2,735 13.2 2,394 294 2,688 22 3 25 31 —
2006 2,369 323 2,692 13.6 2,427 324 2,751 36 5 41 32 —
2007 2,637 389 3,026 14.8 2,474 343 2,818 26 4 30 32 —
2008 2,434 326 2,760 13.4 2,480 346 2,826 22 3 25 32 —
2009 2,263 391 2,654 17.3 2,445 369 2,813 27 6 33 29 —
2010 2,452 267 2,719 10.9 2,383 328 2,711 38 7 45 34 —
2011 — — — — — — — 44 6 50 43 —Table 1. Summary of spring survey counts of sea otters (Enhydra lutris nereis) in California, and 3-year averages, 1983–2019.—Continued
[—, no data; %, percent]
Mainland range San Nicolas Island Range-wide
Year Pups Total Pups Total Total Index of
Independents Pups Total Pups per 100 Independents Independents
(3-year (3-year (raw (raw (3-year relative
(raw count) (raw count)(raw count) independents (3-year average) (raw count)
average) average) count) count) average) abundance
2012 2,486 379 2,865 15.2 2,469 323 2,792 48 10 58 51 —
2013 2,444 455 2,899 18.6 2,465 417 2,882 54 8 62 57 2,939
2014 2,410 469 2,879 19.5 2,447 434 2,881 59 9 68 63 2,944
2015 2,688 505 3,193 18.8 2,514 476 2,990 54 7 61 64 3,054
2016 3,078 433 3,511 14.1 2,725 469 3,194 92 12 104 78 3,272
2017 2,211 396 2,607 17.9 2,659 445 3,104 72 9 81 82 3,186
2018 2,438 548 2,986 22.5 2,576 459 3,035 81 14 95 93 3,128
2019 2,583 413 2,996 16.0 2,411 452 2,863 109 12 121 99 2,962
Combined:
5-year (2015–19) geometric mean annual growth rate (% change): Mainland: –0.13 San Nicolas: 9.58
0.12
California Sea Otter Census Results 56 California Sea Otter (Enhydra lutris nereis) Census Results, Spring 2019
3,300 330
3,000 300
2,700 270
Number of sea otters (3−year-average count),
Number of sea otters (3−year-average count),
2,400 240
mainland / range-wide
2,100 210
San Nicolas Island
1,800 180
1,500 150
1,200 120
900 90
600 60
300 30
0 0
1985 1990 1995 2000 2005 2010 2015 2020
Year
EXPLANATION
Population metric
Range-wide
Mainland population
Mainland independents
San Nicolas Island population
San Nicolas Island independents
Figure 2. Trends in abundance of sea otters (Enhydra lutris nereis) in California, based on 3-year running averages of raw counts.
Data are shown for all sea otters (solid lines) and independents (non-pups; dashed lines) for the mainland range (left axis, blue lines),
San Nicolas Island (right axis, brown lines), and for the entire range after 2012 (left axis, solid black line), when counts were combined
to create the official index of relative abundance.California Sea Otter Census Results 7
2,500
2,000
1,500
Sea otter abundance
1,000
500
0
1980 1985 1990 1995 2000 2005 2010 2015 2020
Year
EXPLANATION
Portion of range
North (Pigeon Point–Seaside)
Central (Seaside–Cayucos)
South (Cayucos–Gaviota)
San Nicolas Island
Figure 3. Regional trends in abundance of sea otters (Enhydra lutris nereis) along the mainland coast, central California, and at
San Nicolas Island, southern California. Raw counts and 3-year running averages (solid lines across entire length of each time series)
are plotted for the north (blue), central (dark coral), and southern (green) regions of the mainland coast and for San Nicolas Island
(brown). The most recent 5-year average trend (calculated as the geometric mean annual rate of change) is shown as a solid line at the
end of each time series.8 California Sea Otter (Enhydra lutris nereis) Census Results, Spring 2019
122° 121° 120°
Pigeon Point
Point Año Nuevo
37° Capitola
Seaside
EXPLANATION
Sea otter density
Otters per 500 meters
of coast
36°
Cape
10 San Martin
5
0
Cayucos
WASHINGTON
IDAHO
OREGON
35°
NEVADA
CA
LI Lompoc
FO
Area R
of map NI
A
Gaviota State Beach
Point Conception
Rincon Point
Base map data from Google, 2018
Mercator Auxiliary Sphere, WGS 1984 0 25 50 KILOMETERS
0 25 50 MILES
Figure 4. Variation in local population density (number of sea otters per 500 meters of coast) of sea otters (Enhydra lutris nereis) along
the mainland coast, central California. Data for San Nicolas Island are not shown because spatially explicit analyses are not currently
conducted for San Nicolas Island.California Sea Otter Census Results 9
122° 121° 120°
Pigeon Point
Point Año Nuevo
Davenport
37° Capitola
Seaside
Monterey
36°
Cape
San Martin
Cayucos
EXPLANATION
Population trend
Pismo Beach
5-year exponential
rate of change
35°
0.1
0.0
−0.1 Lompoc
−0.2 Gaviota State Beach
Point Conception
Rincon Point
Base map data from Google, 2018
Mercator Auxiliary Sphere, WGS 1984 0 25 50 KILOMETERS
0 25 50 MILES
Figure 5. Local trends in abundance of sea otters (Enhydra lutris nereis) along the mainland coast, central California. Trends represent
mean exponential rates of change, log(λ), estimated by fitting a log-linear model to the most recent 5-year time series at each point on
the coast and then spatially smoothing the calculated trend using a 10-kilometer moving window average.10 California Sea Otter (Enhydra lutris nereis) Census Results, Spring 2019
Geographic Distribution (20 contiguous ATOS intervals each) and taking the northern
and southern ATOS values, respectively, of the northernmost
The mainland population of the southern sea otter is and southernmost stretches in which at least 5 otters were
descended from a small, remnant population in Big Sur that counted for at least 2 consecutive spring surveys during the
survived the North Pacific fur trade. Because of this historical last 3 years.
pattern of depletion and recovery, the population has been The northernmost sea otters detected in the 2019
slowly expanding to the north and south along the California mainland survey were near Point Año Nuevo (ATOS 180)
coast from the source location in Big Sur. The rate of range again this year. At the southern end of the mainland range,
expansion to the north and south has varied over time, and 102 sea otters were counted southeast of Point Conception,
traditionally the rate of spatial spread has been faster to the 67 more than were counted in 2018. Only one sea otter was
south (Lubina and Levin, 1988) than to the north. Because counted this year southeast of Gaviota State Beach (ATOS
of the one-dimensional nature of the California coast, the 1162; the same number as last spring), with this animal being
location of the northern and southern range boundaries can be observed approximately 25 km east of Gaviota State Beach.
described using the “ATOS” line (the “As The Otter Swims” Owing to limited availability of the survey aircraft and pilots,
line). The ATOS line is a linear axis described as a series of we were unable to survey north of Pigeon Point to Pillar Point
points spaced regularly at 500-m intervals along the 10-m this year. As a result, the official northern range limit cannot be
depth contour. A value of 0 is arbitrarily assigned to the calculated. However, there have been very few credible reports
ATOS point at the southern tip of the Golden Gate Bridge in of stranded or live sea otters north of Pigeon Point during
San Francisco, and then ATOS values increase as one moves the previous year. It is highly unlikely that many sea otters
south along the coast, with ATOS 1111 corresponding to occur beyond Pigeon Point this year. The southern limit of
Point Conception. To standardize descriptions of the sea otter the official sea otter range along the mainland coast expanded
distribution in California, the officially recognized mainland very slightly from 2018 (fig. 6) by one ATOS unit and is about
range boundaries are defined by combining independent sea 4.5 km west of Gaviota State Beach (ATOS 1154; fig. 1).
otters within a moving window of 10-km stretches of coastlineCalifornia Sea Otter Census Results 11
100
200
300
400
500
600
ATOS axis
700
800
900
1000
1100
1200
1300
1980 1985 1990 1995 2000 2005 2010 2015 2020
Year
EXPLANATION
Range boundary
North boundary
South boundary
Figure 6. Variation over time in the location of the northern and southern range boundaries (defined on the “As The Otter Swims”
[ATOS] scale) of sea otters (Enhydra lutris nereis) along the mainland coast, central California, 1983–2019. The northern boundary in 2019
was not calculated owing to limited aerial survey resources. Increasing or decreasing intervals between ATOS values represent the
rate of range expansion or contraction.12 California Sea Otter (Enhydra lutris nereis) Census Results, Spring 2019
References Cited Lubina, J.A., and Levin, S.A., 1988, The spread of a
reinvading species—Range expansion in the California
sea otter: American Naturalist, v. 131, no. 4, p. 526–543,
Burt, J.M., Tinker, M.T., Okamoto, D.K., Demes, K.W., https://doi.org/10.1086/284804.
Holmes, K., and Salomon, A.K., 2018, Sudden collapse
of a mesopredator reveals its complementary role in Nicholson, T.E., Mayer, K.A., Staedler, M.M., Fujii, J.A.,
mediating rocky reef regime shifts: Proceedings of the Murray, M.J., Johnson, A.B., Tinker, M.T., and
Royal Society B, Biological Science, v. 285, no. 1883, Van Houtan, K.S., 2018, Gaps in kelp cover may threaten
https://doi.org/10.1098/rspb.2018.0553. the recovery of California sea otters: Ecography, v. 41,
no. 11, p. 1751–1762, https://doi.org/10.1111/ecog.03561.
Hatfield, B.B., Yee, J.L., Kenner, M.C., Tomoleoni, J.A., and
Tinker, M.T., 2018, California sea otter (Enhydra lutris Tinker, M.T., Doak, D.F., and Estes, J.A., 2008,
nereis) census results, spring 2018: U.S. Geological Survey Using demography and movement behavior to
Data Series 1097, 10 p., https://doi.org/10.3133/ds1097. predict range expansion of the southern sea otter:
Ecological Applications, v. 18, no. 7, p. 1781–1794,
Hatfield, B.B., Yee, J.L., Kenner, M.C., and Tomoleoni, J.A., https://doi.org/10.1890/07-0735.1.
2019, Annual California sea otter census—2019 spring
census summary: U.S. Geological Survey data release, Tinker, M.T., Hatfield, B.B., Harris, M.D., and Ames, J.A.,
https://doi.org/10.5066/P9B2KNB3. 2015, Dramatic increase in sea otter mortality from white
sharks in California: Marine Mammal Science, v. 32, no. 1,
Lafferty, K.D., and Tinker, M.T., 2014, Sea p. 309–326, https://doi.org/10.1111/mms.12261.
otters are recolonizing southern California in
fits and starts: Ecosphere, v. 5, no. 5, p. 1–11, U.S. Fish and Wildlife Service, 2003, Final revised recovery
https://doi.org/10.1890/ES13-00394.1. plan for the southern sea otter (Enhydra lutris nereis):
U.S. Fish and Wildlife Service, Region 1, Portland, Oreg.,
58 p., accessed August 8, 2016, at https://www.fws.gov/
ventura/docs/species/sso/recoveryPlan/ssorecplan.pdf.For more information concerning the research in this report, contact the Director, Western Ecological Research Center U.S. Geological Survey 3020 State University Drive East Sacramento, California 95819 https://www.usgs.gov/centers/werc Publishing support provided by the U.S. Geological Survey Science Publishing Network, Sacramento Publishing Service Center
Hatfield and others—California Sea Otter (Enhydra lutris nereis) Census Results, Spring 2019—Data Series 11118

                                                                                                                 https://doi.org/10.3133/ds1118
                                                                                                                 ISSN 2327-638X (online)
You can also read