Cambridge Family Wellbeing Centre Profile - Released: 9th September 2021 - Sefton Council
←
→
Page content transcription
If your browser does not render page correctly, please read the page content below
Last Updated: 09/09/2021 – FINAL

Family Wellbeing Centre
Profile

Cambridge

Released: 9 th September 2021

Collated by Della Haddley
Commissioning Support & Business Intelligence Service
Data, Insight, Business Intelligence, & Performance

                                                        1/22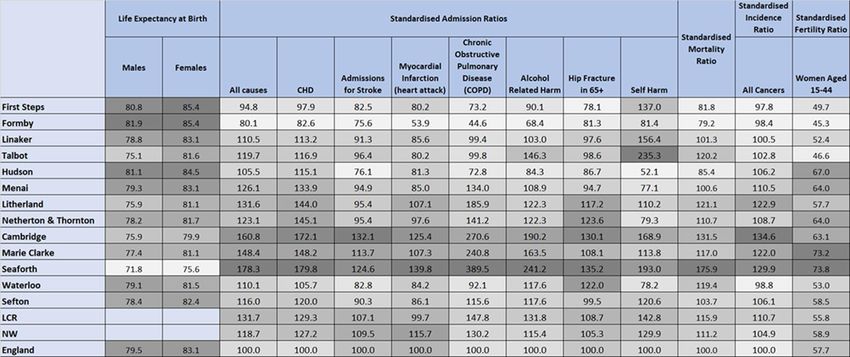
Last Updated: 09/09/2021 – FINAL

Document Control

Issue/Amendment Record

Document Ownership
Role            Name/Title
Author          Della Haddley
Release         Wayne Leatherbarrow
Authority       Service Manager - Performance & Intelligence

Distribution
Restricted Internal

                                                               2/22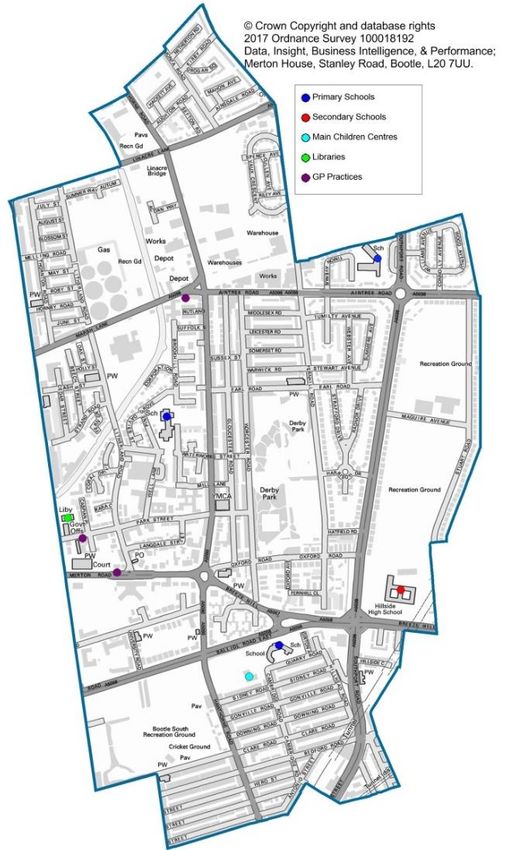
Last Updated: 09/09/2021 – FINAL

                                                                            Health .............................................................. 15
Contents                                                                       Hospital Admissions .................................... 15
                                                                               Children Overweight (inc Obesity) .............. 15
Document Control ............................................. 2
                                                                            Service Demand & Delivery............................. 16
Highlights ........................................................... 4
                                                                               Children’s Social Care .................................. 16
Overview............................................................ 5
                                                                               Early Help .................................................... 16
   Demographics ................................................ 5
                                                                               Children Centres.......................................... 16
   Deprivation .................................................... 5
                                                                               Youth Offending Team (YOT) ...................... 17
   Employment .................................................. 5
                                                                               Sefton Turnaround ...................................... 17
   Benefits .......................................................... 5
                                                                            MOSAIC Profile ................................................ 18
   Education ....................................................... 6
                                                                            Family Wellbeing Centre Comparators ........... 19
   Community Safety ......................................... 6
                                                                            Notes on Data & Methodology ....................... 20
   Social Care ..................................................... 6
                                                                            Source ............................................................. 22
   YOT ................................................................ 6
Demographics .................................................... 8
   Food bank ...................................................... 8
Deprivation ........................................................ 8
   Children Living in Low Income Families ......... 8
   Income Deprivation Affecting Children Index
   (IDACI) by Cambridge Schools (2019) ............ 8
   Index of Multiple Deprivation (IMD) by
   Cambridge Schools (2019) ............................. 9
Implications for Service Delivery ....................... 9
Welfare, Economy, & Business ........................ 10
   Economically Active ..................................... 10
   Free School Meals........................................ 10
   Benefits ........................................................ 10
   Emergency Limited Assistance Scheme (ELAS)
   Applications ................................................. 10
Education ......................................................... 11
   Early Years ................................................... 12
   Key Stage 2 .................................................. 12
   Key Stage 4 .................................................. 12
   Special Education Needs (SEN) .................... 13
   High Needs Funding (HNF) .......................... 13
Community Safety ........................................... 14
   Crime ........................................................... 14
   Anti-social Behaviour (ASB) ......................... 14
   Deliberate Fires ........................................... 14

                                                                                                                                             3/22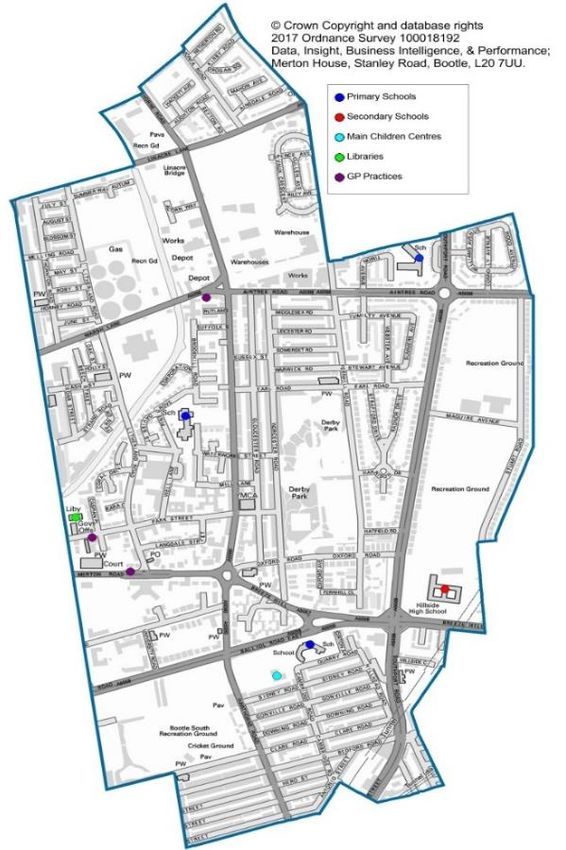
Last Updated: 09/09/2021 – FINAL

Highlights

                                   4/22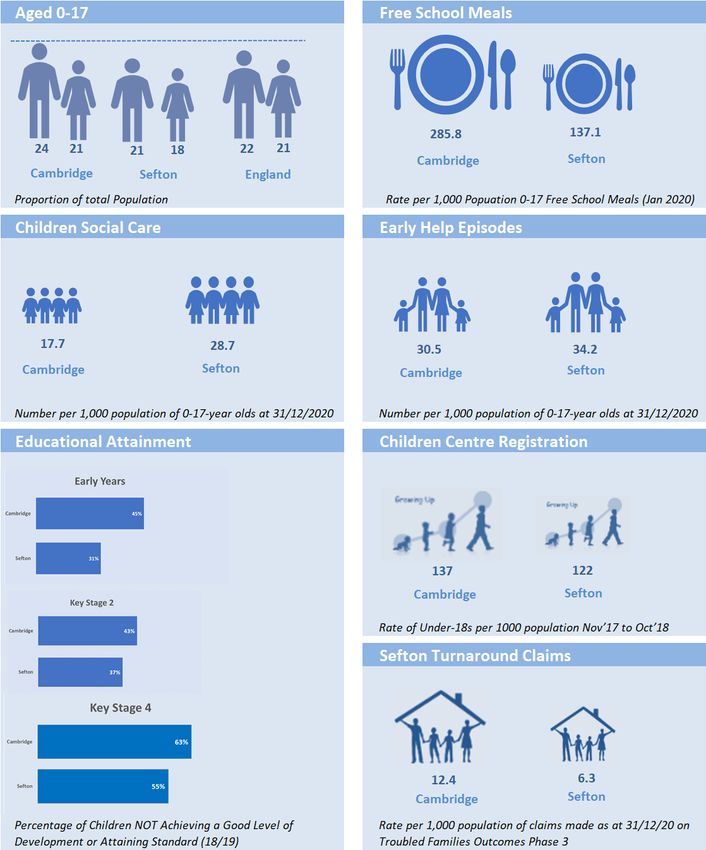
Last Updated: 09/09/2021 – FINAL
Overview Demographics
The latest 2019 population estimates indicate
Sefton is a metropolitan borough of there are approximately 12,556 people living in
Merseyside; England and its local authority is Cambridge.
Sefton Council.
The proportion of females to males is slightly
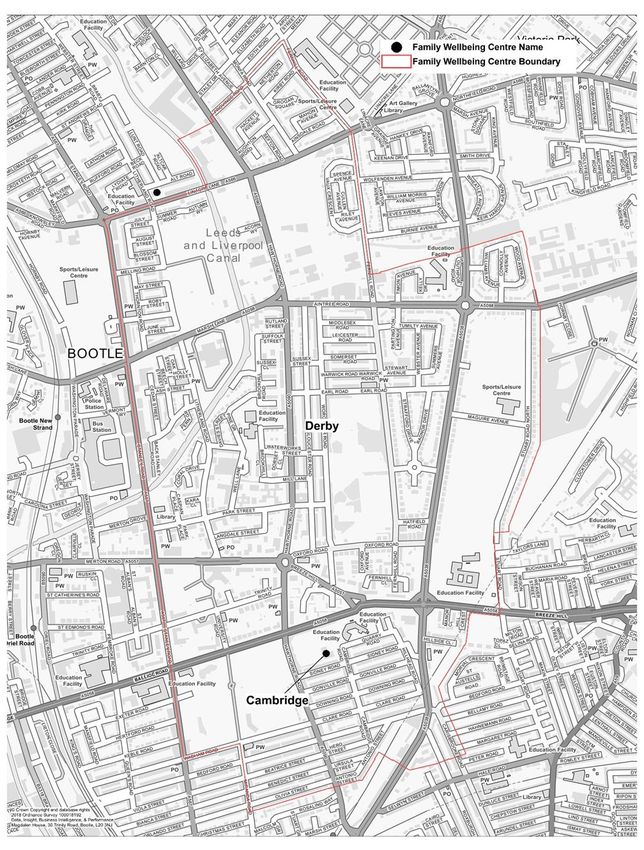
The Cambridge Family Wellbeing Centre is lower than the wider Sefton rate, the Liverpool
based at Cambridge Road, Bootle and provides City Region and England at approximately 51-49
services to the Ward of Derby. Derby is one of per cent.
the 22 Wards that make up Sefton
Metropolitan Borough Council. It is one of the After a review of the 2011 census, 97.4% of the
most southerly wards in the borough and Sefton population has a White ethnic
covers part of the Bootle area. Derby is background with 2.6% of the Sefton population
bordered by Linacre to the West, Litherland / having Black, Minority Ethnicity (BME).
Netherton & Orrell to the North, and Liverpool
City Council to the East and South. Sefton’s most commonly used languages: 98.0%
of people living in Sefton speak English. The
In the ward there are: other top languages spoken are 0.6% Polish,
Three Primary Schools 0.1% Portuguese, 0.1% All other Chinese, 0.1%
Latvian, 0.1% Spanish, 0.1% Lithuanian, 0.1%
One Secondary School
Arabic, 0.1% Bengali, 0.1% Turkish.
One Free School
One main Children Centre 22.5% of the population of the area are under
18 and just under two thirds (62.5%) are of
One Library
traditional working age (16-64).
Three General Practitioner (GP) Surgeries (as of
2014)
Deprivation
The level of deprivation in Child Poverty and
Children in Low Income Families in Cambridge is
10% higher than Sefton.
Employment
Just over 40% of the total population in
Cambridge are in employment, which is almost
two thirds of the 16-64-year-old population in
the area.
6% are unemployed
4% are recorded as students.
Benefits
16% of the households in Cambridge are
receiving Housing Benefit.
12% of the total ELAS (Emergency Limited
Assistance Scheme) applications between
January and December 2020 originated from
the area.
5/22
Last Updated: 09/09/2021 – FINAL

Education
The schools within the Cambridge area have        The COVID-19 pandemic has led to a dramatic
equal proportion of male and female students.     loss of human life and presents an
                                                  unprecedented challenge to public health, food
Only two schools were OFSTED rated as ‘Good’      systems and the world of work. The economic
with one being ‘Outstanding’. However, one        and social disruption caused by the pandemic is
school did receive an ‘Inadequate’ rating and     devastating. People are at risk of falling into
one ‘Requires Improvement’                        extreme poverty and being undernourished.
                                                  Workforces are at risk of losing their livelihoods
The rate of Free School Meals in Cambridge is
                                                  without the means to earn an income during
considerably higher than Sefton.
                                                  lockdowns, many are unable to feed themselves
Just under 20% of students received SEN/EHC
                                                  and their families. For most, no income means
support, higher than across Sefton.
                                                  no food, or, at best, less food and less nutritious
                                                  food.
Compared to Sefton as a whole, attainment for
Early Years, Key Stage 2 and Key Stage 4,         Different forms of support are key, including
Cambridge has a higher percentage of students     cash transfers, child allowances and healthy
achieving less than expected.                     school meals, shelter and food relief initiatives,
                                                  support for employment retention and
Community Safety                                  recovery, and financial relief for businesses,
                                                  including micro, small and medium-sized
Overall levels of crime in Cambridge are
                                                  enterprises. In designing and implementing
considerably higher than across Sefton as a
                                                  such measures it is essential that governments
whole.
                                                  work closely with employers and workers.
Violent crime is the most reported type –
                                                  It is uncertain how long the impact of the Covid
representing over two fifths of crime in the
                                                  19 pandemic will continue to influence the
area.
                                                  economy and livelihoods.
Levels of anti-social behaviour (ASB) are also    Therefore, given the frequency with which
higher than Sefton-wide patterns with ‘Rowdy      some data sets within this document are
Inconsiderate Behaviour’ being the most           updated, the information recorded may not
common type of ASB.                               fully yet reflect the full impact.
The rate of Deliberate Fire incidents in
Cambridge per 1,000 population is also higher
than across Sefton with ‘Secondary Fires’ being
the highest incident reported.

Social Care
The support needs from Children’s Social Care
and Early Help provision are lower compared to
the Sefton average.

YOT
Between January 2020 and December 2020
there were 17 young people on YOT
interventions.

                                                                                                6/22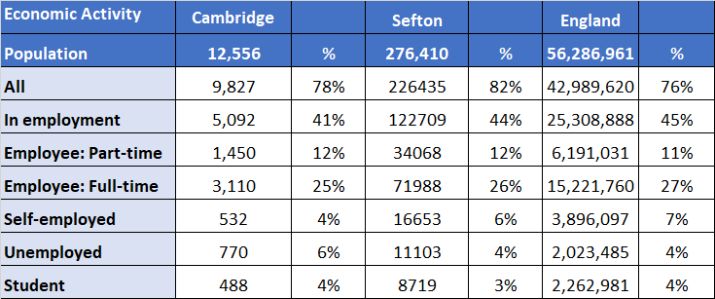
Last Updated: 09/09/2021 – FINAL

                                   7/22
Last Updated: 09/09/2021 – FINAL

Demographics                                          Deprivation
The proportion of females to males is slightly        Children Living in Low Income Families
higher across Cambridge and the wider Sefton
                                                      The percentage of 0-19-year olds living in low
rate, the Liverpool City Region and England at an
                                                      income families during 2019/2020 in the
average of roughly 51%-49%.
                                                      Cambridge reach was 10% higher than Sefton as a
                                                      whole.
The percentage of working age (16-64) individuals
in the Cambridge area is over 3% higher than the
percentage across Sefton but comparable with
Liverpool City Region and across England. This
may mean that demand for jobs or benefit
support in the area could be higher than that of
the borough.
The Cambridge area accounts for 6% of the 0-5-
year olds in the borough and 5% of the under 18-
year olds in Sefton.
At June 2019, the most recent data available for
Teenage Pregnancies, Sefton recorded a rate per
1,000 population of 20.7 which is comparable to
the rate Regionally (21.1) but slightly higher than
England (16.4).
                                                      Income Deprivation Affecting Children Index
                                                      (IDACI) by Cambridge Schools (2019)
                                                      Within the Sefton Borough, 13,053 children
                                                      attending schools are affected by income
                                                      deprivation of which 15% are attending schools
                                                      within the Cambridge reach.

Food bank
In the financial year 2019/20 households in the
Cambridge reach received 750 Food bank
vouchers from the Trussell Trust, which accounted
for 8.9% of the Sefton total. These vouchers
helped 1,743 people (978 adults and 765
children).

                                                                                                    8/22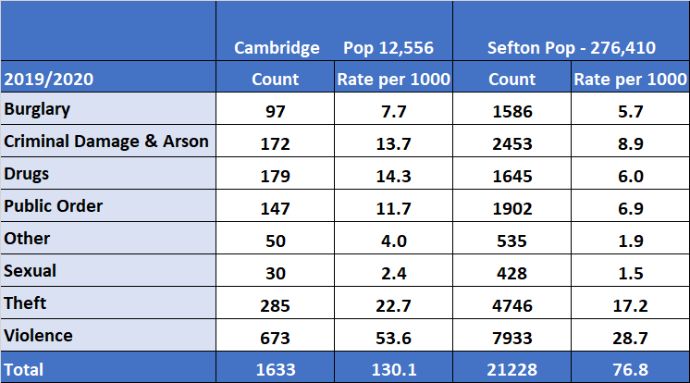
Last Updated: 09/09/2021 – FINAL

Index of Multiple Deprivation (IMD) by          Implications for Service Delivery
Cambridge Schools (2019)
Within the Sefton Borough, 3,433 children       Due to the demographic makeup, the overall lower
attending schools are affected by Multiple      yet increasing deprivation and average to better
Deprivation of which 4% are attending schools   health seen across the area, demands on services in
within the Cambridge reach.                     the area should be lower than compared to other
                                                areas and Sefton as a whole; however, these may
                                                increase in the foreseeable future due to an aging
                                                population and increases in overall deprivation
                                                seen. Key service demands could include:

                                                ▪   There are small pockets of higher-level
                                                    deprivation of all types in the area coupled with
                                                    increased levels of certain type could lead to
                                                    the requirement for more services than
                                                    compared to most residents across the
                                                    borough.

                                                ▪   Budgets cuts seen by both Merseyside Police
                                                    and Merseyside Fire and Rescue coupled with
Income Deprivation Affecting Children Index         the increases in rates deliberate fire incidents
                                                    within the area may result in increases in
IDACI Score by LSOA (2019)                          demand and therefor increasing level of direct
                                                    costs. Associated with these issues are also
                                                    indirect costs including lowered levels of
                                                    community satisfaction and wellbeing; and
                                                    reduced attractiveness to encourage businesses
                                                    and job creators to locate in the area.

                                                ▪   There are overall lower than average levels of
                                                    reliance on benefits in the area, yet changes
                                                    made in the Welfare Reform Act may see
                                                    increased levels of vulnerable households and
                                                    widening in inequalities in households, leading
                                                    to demands on services such as Food Banks,
                                                    Emergency Limited Assistance Scheme, Housing
                                                    Benefits, and Homeless Services.

                                                ▪   Demand on services including adult social care
                                                    and health services may be higher than average
                                                    in Cambridge. Living in socioeconomically
                                                    deprived areas is associated with poor health
                                                    and a shorter life and the direct effect of
                                                    COVID-19 is making these inequalities worse.
                                                    The wider indirect effects of the pandemic on
                                                    health – for example from foregone care for
                                                    other conditions, and ill-health resulting from
                                                    economic insecurity – are likely to have a
                                                    similar but longer lasting impact.

                                                                                              9/22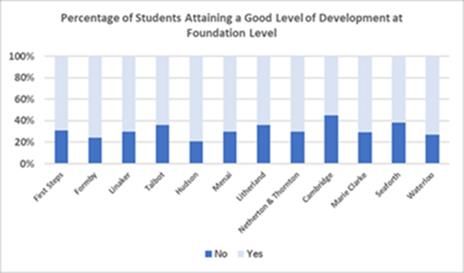
Last Updated: 09/09/2021 – FINAL

Welfare, Economy, & Business                        Benefits
                                                    As at Jan’21 of all working age benefit claimants
According to Experian Mosaic in 2020, just under    (16-64) within the area, 16% were in receipt of
two fifths of households within Cambridge had an    Personal Independent Payment (PIP). This is a rate
annual income of less than £15,000, 14% higher      of 157.0 per 1,000 population, considerably higher
than the rate across Sefton. However, the rate of   than across Sefton with a rate of 101.1 per 1,000.
household income between £20,000 and £29,999,
Cambridge was just under 2% lower than in           As at Jan’21 there were 2,350 Universal Credit
Sefton.                                             (UC) claimants in the area. This is a staggering
                                                    increase compared to Jan’20 (1,408) primarily as a
                                                    result of the current Covid Pandemic and
                                                    increased redundancies. Cambridge has a much
                                                    higher rate of UC claimants 299.2 per 1,000
                                                    population in comparison to Sefton 92.2, more
                                                    than three times higher.
                                                    In Nov’20, 16% of households in the area were
                                                    claiming Housing Benefit, a rate of 158.2 per
                                                    1,000 population again much higher in
                                                    comparison to Sefton with 85.6.
Economically Active
                                                    At Aug’19, 21% of families were in receipt of Child
Just over 40% of the total population of the area   Benefits, a rate of 211.3 per 1,000 population,
are in employment, which is two thirds of the       higher than Sefton with 182.3.
16-64-year-old population in the area.
6% are unemployed
4% are recorded as students.

The rate of employment in Cambridge is slightly
lower than in Sefton and England with the
exception of part-time employed which is
comparable with Sefton and 1% higher than
England.

                                                    Emergency Limited Assistance Scheme (ELAS)
                                                    Applications
                                                    Between January 2020 and December 2020 there
                                                    were 884 applications to Sefton’s Emergency
                                                    Limited Assistance Scheme (ELAS) by residents
                                                    within Cambridge, 12.2% of all ELAS applications
                                                    made. This makes up 9.1% of residents aged 18
Free School Meals
                                                    and over in the area which is nearly three times
There were 807 children at schools within the       higher than the 3.3% throughout the borough. Of
Cambridge area who were in receipt of Free          the applications in the area, 55% were approved
School Meals which equates to 36% of the            in full, with 9% being partially approved but 36%
population, considerably higher compared to         not being approved.
Sefton as a whole.
863 Cambridge pupils were eligible for Pupil
Premium Funding (39%), 18% higher than Sefton.

                                                                                                 10/22
Last Updated: 09/09/2021 – FINAL
Education
School locations in the Cambridge FWC Reach:
At their most recent OFSTED inspections 2 schools
were rated ‘Good’, with St Monica’s receiving an
‘Outstanding’ rating. However, this inspection was
completed in 2014.
Hillside was inspected in 2018 and received a
rating ‘Inadequate’. The most recent Ofsted
inspection was at The Hawthorne’s Free School in
January 2020 and ‘Requires Improvement’.
At the most recently available school census there
were 2,219 children registered at schools within
the Cambridge FWC area.
609 Secondary school
331 Free school
1,279 Primary school
The ratio of Male to Female in Cambridge schools
is the same.
11/22Last Updated: 09/09/2021 – FINAL
Early Years
Just over half (55%) of the children in Early Years
provision were at or exceeding the expected
developmental level.
In addition to the schools, there are 4 registered
Day Nurseries and 0 registered Child Minders
within the Cambridge reach.
Key Stage 2
Available data for Key Stage 2 indicates that all
the primary schools within the Cambridge area
made Average or Above Average progress in the
three key areas – Reading, Writing and Math. Cambridge scores at Key Stage 4 fell considerably
However, the rates across Cambridge are slightly lower than Sefton as a whole.
lower than Sefton as a whole.
Key Stage 4
At Key Stage 4 schools get a score based on how
well pupils have performed in up to 8
qualifications, which include English, Maths,
3 English Baccalaureate qualifications including
sciences, computer science, history, geography
and languages, and 3 other additional approved
qualifications. This is known as the Attainment 8
score - The average score across Sefton was 45%,
higher than Cambridge 38%.
12/22Last Updated: 09/09/2021 – FINAL
Special Education Needs (SEN) Not in Education, Employment or Training (NEET)
The Cambridge rate of SEN/EHCP students was The number of young people (16-18) in the
19.5%, with 18.4% receiving SEN Support and Cambridge reach who were registered as Not in
1.1% the subject of Education Health & Care (EHC) Education, Employment or Training (NEET) as at
plans. 31/12/20 was 65.
When comparing the rate per 1,000 population
(157.4), considerably higher than across Sefton
(85.5).
Cambridge accounted for 9% of all young people
who were registered NEET.
High Needs Funding (HNF)
High needs funding is intended to provide the
most appropriate support package for an
individual with special educational needs (SEN) in
a range of settings.
All five schools within the Cambridge reach
receive some element of High Needs Funding for
either EHC or SEN Support with Bedford Primary
receiving 47% of the funding.
13/22Last Updated: 09/09/2021 – FINAL
Community Safety Anti-social Behaviour (ASB)
There were 284 Anti-social Behaviour incidents
Associated with its higher levels of socio- reported to Merseyside Police between 2019 and
economic issues the Cambridge area has above 2020 occurring within the Cambridge FWC area: 6%
average levels of crime and disorder compared to of all Sefton incidents. The area has a rate of 22.6
the Borough as a whole. incidents per 1,000 population – higher than the
Crime rate seen across Sefton as a whole (17.2 per 1,000).
There were 1,633 crimes reported to Merseyside 42% of the incidents within the area were reports
Police between 2019 and 2020 in the Cambridge of Rowdy Inconsiderate Behaviour, with General
area, representing 8% of all crimes that occurred Nuisance being the next most commonly reported
within Sefton. This is a rate of 130.7 crimes per incident.
1,000 people – much higher than the rate seen Anti-Social Behaviour 2019/2020
across Sefton as a whole (76.8 per 1,000).
Just over two fifths (673) of all reports were
violent offences followed by Theft (285) being the
next most common offence recorded.
A rate of 14.3 crimes per 1,000 population were
Drug related, over double the rate across Sefton.
Crime 2019/2020
Deliberate Fires
There were 34 Deliberate Fire incidents reported
to Merseyside Police between 2019/2020 in the
Cambridge area representing 7.4% of all Sefton
fires reported. Deliberate Secondary Fires had the
highest number of incidents with 76.5%.
The area has a rate of 2.7 incidents per 1,000
population – higher than the rate seen across
Sefton as a whole (1.7 per 1,000)
Deliberate Fires 2019/2020
Cambridge Deliberate Fires Sefton Deliberate Fires
Fires 2019/20
Rate per Rate per
Count 1,000 Count 1,000
Deliberate
5 0.4 38 0.1
Property Fire
Deliberate
Secondary 26 2.1 371 1.3
Fire
Vehicle Fire 3 0.2 51 0.2
Total 34 2.7 460 1.7
14/22Last Updated: 09/09/2021 – FINAL
Health Hospital Admissions
During the period between 2013 and 2017 the
ONS Statistics 2013-2017 recorded, Cambridge rate of hospital admissions for ‘All Causes’ in the
reach has a poorer level of health compared to Cambridge reach was noticeably higher than
the borough with lower life expectancy. Sefton and England.
Chronic Obstructive Pulmonary Disease (COPD)
had the highest rate in Cambridge with 270.6,
more than double the rate in Sefton 115.6,
followed by Alcohol with 190.2, again higher than
Sefton (117.6).
Based on current age-specific mortality rates,
women’s life expectancy in Cambridge is three
years fewer (80) than the England average (83);
with men’s life expectancy to be up to 4 years
fewer.
Children Overweight (inc Obesity)
Pupils in the Cambridge reach taking part in the
annual National Child Measurement Programme
(NCMP) between 2018 and 2019
154 Reception pupils (age 4 to 5), just over a third
(54) were recorded as being overweight, higher
than both Sefton and England percentages.
122 Year 6 pupils (age 10 to 11), just over two
fifths (52) were recorded as being overweight,
The average levels of disease and mortality rates again higher than both Sefton and England
of residents in Cambridge are higher than Sefton percentages.
and England.
ONS Statistics 2019 recorded the fertility rate in
Cambridge is higher than both Sefton and England
rates.
15/22Last Updated: 09/09/2021 – FINAL
Service Demand & Delivery Children Centres
Due to Covid 19, activities at each of the Family
Children’s Social Care Wellbeing Centres have been suspended since
In the area covered by the Cambridge Family March 2020.
Wellbeing Centre, as at 31/12/20 there were 50 Between October 2017 and September 2018
children aged between 0 and 17 years with an there were 651 individuals from Cambridge
open Children’s Social Care plan; this equates to registered at Sefton Children Centres, 60% of
17.7 per 1,000 children residing in the area, lower which were under 18.
than the Sefton rate of 28.7 where there were
1,550 open CSC plans. There were 6734 attendances of under 18-year
olds at the Cambridge Family Wellbeing Centre
between October 2017 and September 2018. This
is a rate of 2363 per 1,000 population.
As should be expected, the overwhelming number
of attendances at the Family Centre in the year to
November 2018 were related to child wellbeing
and development, primarily ‘Stay and Play’, Early
Learning and Child Health Services. However,
some attendances were not directly related to
children, including Adult Learning Services and
Healthy Life Styles.
There are three plan types,
Children Looked After – CLA
Children in Need Plan – CIN
Child Protection – CP
Currently, in the Cambridge area:
• 16 children are subject to CLA (Sefton 704)
• 22 children are subject to CIN (Sefton 631)
• 12 children are subject to CP (Sefton 215)
Early Help
As at 31/12/20 Sefton had 1,850 open Early Help
Episodes of which Cambridge were supporting 86
children, a rate of 30.5 per 1,000 population of
0 – 17-year olds, slightly lower than Sefton 34.2.
16/22Last Updated: 09/09/2021 – FINAL
Youth Offending Team (YOT) Families identified for the Sefton Turnaround
Within the Cambridge reach there were 17 young Programme will have two or more of the following
people (aged between 10 and 17) on YOT six problems.
interventions between January 2020 and
1. Families involved in criminal and antisocial
December 2020.
behaviour
2. Families where children do not attend school
regularly
3. Families where children need help
4. Families with adults out of work and young
people at risk of worklessness
5. Families affected by domestic violence and
abuse
6. Families with a range of health problems
These issues often interact, causing further harm
and increasing the difficulty for families to resolve
these issues themselves. All interventions
delivered through the Sefton Turnaround
Sefton Turnaround Programme will make use of an evidence-led
model; one coordinated plan, one lead
The Sefton Turnaround Programme is an
practitioner and one family at the heart of the
important element of Sefton’s Early Help strategy.
intervention.
The aim is to align the outcomes for a range of
partners, including healthcare, criminal justice Since April 2020 when the Turnaround
Programme Phase 3 began, 35 families from
agencies, housing providers, schools and colleges,
within the Cambridge reach have been
Department for Work and Pensions and
successfully “Turned Around” as at December
organisations from the voluntary, community and 2020.
faith sector to:
• Reduce harm to families and individuals by
delivering interventions in a timely and
effective way
• Reduce costs by working in more innovative
and collaborative ways
• Increase the number of families receiving
support at an earlier stage, before problems
become established
17/22Last Updated: 09/09/2021 – FINAL
MOSAIC Profile ▪ L - Predominantly young, single, transient
renters without children. Predominantly lower
Experian’s Mosaic Public Sector product is incomes of £20-29k. Tend to be early adopters
designed to identify groupings of consumer of technology with a preference for mobile
behaviour for households and postcodes. The and web interaction.
methodology used is unique to Experian and has
been developed over many years to create ▪ K – Predominantly mature aged homeowners,
classifications using data from a wide variety of on a modest income living in affordable
different sources and different levels of suburban households, with grown up children.
geography.
It is designed to describe the UK population in
▪ M - Predominantly younger families with
young children with limited resources (lowest
terms of their typical demographics, social,
household incomes ofLast Updated: 09/09/2021 - Final
Family Wellbeing Centre Comparators
19/22Last Updated: 09/09/2021 - Final
Notes on Data & Methodology Children Living in Low Income Families (CLIF) is
defined as: Children living in families in receipt of
Output Area (OA) – are clusters of adjacent out of work benefits or tax credits whose reported
postcodes and are used as the basis of the Census income is less than 60 per cent of the median
data. They are made up of a minimum of 40 to income divided by the total number of children in
125 households. As of Census 2011 Sefton have the area (determined by Child Benefit data) and is
933 OAs, previous to this there were 937. a proxy measure for child poverty.
Lower Super Output Area (LSOA) – are built using
Occupancy Rating (bedrooms) provides a
adjoined OAs. They have between 400 and 1200
measure of whether a household's
households. Currently Sefton has 189 LSOAs,
accommodation is overcrowded or under
previous to 2011 there were 190.
occupied.
Middle Super Output Area (MSOA) – are built
Universal Credits (UC) is a monthly payment for
using LSOAs and have a minimum household
low income workers and those out of work. UC
number of 2000 up to 6000. There are 38 MSOAs
replaces six other benefit types (Job Seekers
in Sefton this has not changed.
Allowance, Employment and Support Allowance,
Ward – “administrative division of a city or Income Support, Child Tax Credits, Working Tax
borough that typically elects and is represented Credits and Housing Benefits). UC has been rolled
by a councillor or councillors” (Oxford Dictionary) out across England and was introduced in Sefton
in June 2014. Please note that claims are per
For further information relating to these
household meaning two people who resided
geographies please see: ONS Census 2011
together may claim the benefit, which will then be
Population Estimates 2019 – annual population paid into one account. Please note that UC data is
count estimates for wards in Sefton by single year provided LSOAs which have been merged into
of age and sex. best fit wards.
Index of Multiple Deprivation 2019 (IMD) Personal Independence Payment (PIP) can help
measures levels of deprivation, across seven you with some of the extra costs if you have a
domains, nationally at Lower Super Output Area long-term ill-health or disability.
(LSOA) level. This provides a mean score and
Child benefits (CB) is a social security payment
ranking allowing areas to be compared relatively
paid to parents or guardians of children under the
to other areas. The IMD data is created by the
age of 16 or those who continue into further
Department for Communities and local
education until aged 18.
Government. The higher the score the more
affected the area. Sefton has 189 LSOAs as of Housing Benefits (HB) is a means tested benefit
Census 2011. Please note that IMD data is for people on low-incomes to help pay their rent.
provided by LSOAs which have been merged into
“The Early Years Foundation Stage (EYFS) sets
best fit wards.
standards for the learning, development and care
Experian Mosaic is a classification tool used to of children from birth to 5 years old. All schools
categorise the population according to the type of and Ofsted-registered early years providers must
neighbourhood in which they live. It is follow the EYFS, including childminders,
constructed from a range of sources including the preschools, nurseries and school reception
Census, consumer behaviour, financial and classes.”
lifestyle factor data. It is a useful tool for gaining
For further information please see link:
more in-depth insight into lifestyles and behaviour
Foundation Years
of the population. Mosaic segments the
population into 15 Groups (A-O) and 66 Types.
20/22Last Updated: 09/09/2021 - Final
“Key Stage 1 is taught during Years 1 and 2 of
primary school. Targets defined in the National
Curriculum are assessed at the end of each Key
Stage.”
For further information please see link:
GOV.UK Key Stage 1 and 2
“Key Stage 2 is taught during Years 3 to 6 of
primary school. Targets defined in the National
Curriculum are assessed at the end of each Key
Stage.”
For further information please see link:
GOV.UK Key Stage 1 and 2
Progress 8 and Attainment 8
“Progress 8 aims to capture the progress a pupil
makes from the end of primary school to the end
of secondary school. It is a type of value-added
measure, which means that pupils’ results are
compared to the actual achievements of other
pupils with the same prior attainment.
The performance measures are designed to
encourage schools to offer a broad and balanced
curriculum with a focus on an academic core at
key stage 4, and reward schools for the teaching
of all their pupils, measuring performance across
8 qualifications. Every increase in every grade a
pupil achieves will attract additional points in the
performance tables.
Progress 8 is calculated for individual pupils solely
in order to calculate a school’s Progress 8 score,
and there is no need for schools to share
individual Progress 8 scores with their pupils.
Schools should continue to focus on which
qualifications are most suitable for individual
pupils, as the grades pupils achieve will help them
reach their goals for the next stage of their
education or training.
Attainment 8 measures the achievement of a
pupil across 8 qualifications including
mathematics (double weighted) and English
(double weighted), 3 further qualifications that
count in the English Baccalaureate (EBacc)
measure and 3 further qualifications that can be
GCSE qualifications (including EBacc subjects) or
technical awards from the DfE approved list.”
For further information please see link:
GOV.UK Attainment 8
21/22Last Updated: 09/09/2021 - Final
Source
22/22You can also read