Can augmented reality supplement traditional human-machine interfaces? - Gustav Lilja and Fredrik Siemund
←
→
Page content transcription
If your browser does not render page correctly, please read the page content below
Can augmented reality
supplement traditional
human-machine interfaces?
Gustav Lilja and Fredrik Siemund
DEPARTMENT OF DESIGN SCIENCES
FACULTY OF ENGINEERING LTH | LUND UNIVERSITY
2020

MASTER THESIS
Can augmented reality supplement
traditional human-machine interfaces?
Evaluating the role of augmented reality in an industrial
                     environment

                Gustav Lilja and Fredrik Siemund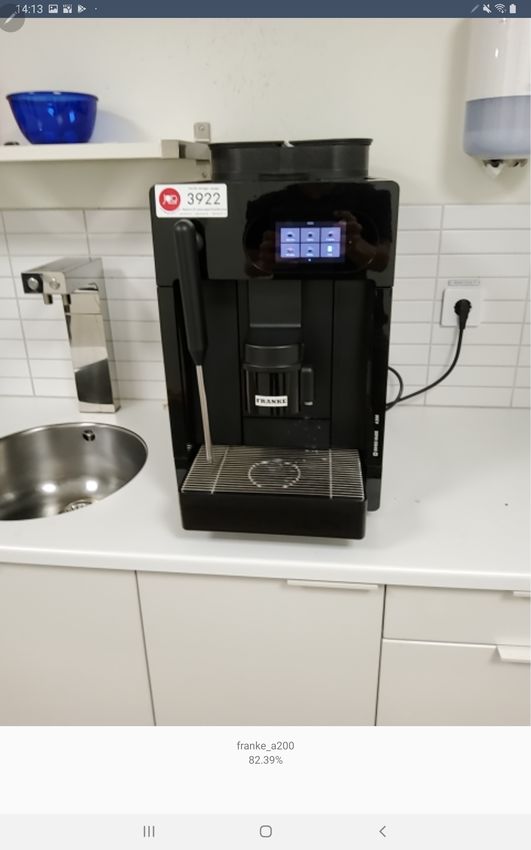
Can augmented reality supplement traditional human-
machine interfaces?

Evaluating the role of augmented reality in an industrial environment

Copyright © 2020 Gustav Lilja, Fredrik Siemund

Published by
Department of Design Sciences
Faculty of Engineering LTH, Lund University
P.O. Box 118, SE-221 00 Lund, Sweden

Subject: Interaction Design (MAMM01)
Division: Ergonomics and Aerosol Technology, Department of Design
Sciences, Faculty of Engineering LTH, Lund University
Supervisor: Günter Alce (gunter.alce@design.lth.se)
Examiner: Joakim Eriksson (joakim.eriksson@design.lth.se)
Abstract

 In this master thesis, the possibilities and limitations of using handheld aug-
mented reality (AR) as a complement to a regular human machine interface
(HMI) are explored. This was done by developing a mobile application for An-
droid and connecting it to a real machine, making it possible to perform actions
on the machine through the AR application. A user study with 20 test subjects
was conducted where the AR prototype was compared to a regular HMI.
    The majority of the test subjects preferred the AR interface over the regular
HMI. System usability tests showed that it was easier to perform the actions
through the AR application. The average time to perform each action was lower
with the AR application.
    The main advantage of using AR turned out to be the possibility to display
the data in a context, i.e. at the right machine component. A drawback with
(handheld) AR is that the development tools might not be suitable for large
scale applications at this stage.

Keywords: Augmented Reality, Human Machine Interface, Image Recognition, Industry
4.0
2
Acknowledgements

To our supervisor from LTH, Günter Alce, who guided us through the project and gave us
constant feedback.
    To our advisor at Beijer Electronics, Tommy Håkansson, who helped us coming in contact
with people at Beijer, gave us feedback and supplied us with equipment.
    To all the employees at Beijer Electronics who gave us feedback, and a special thanks to
the support engineers at Beijer for helping us with the Beijer displays.
    Lastly, we would like to thank all the people who participated in our tests and gave us
feedback about our work.

                                                                                          3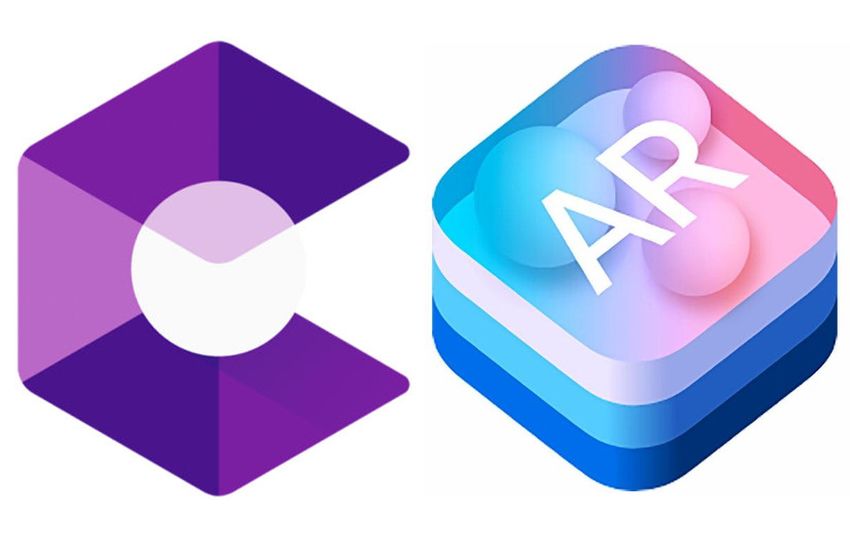
4
Contents

1   Introduction                                                                                                                                            7
    1.1 Purpose and goal . .    .   .   .   .   .   .   .   .   .   .   .   .   .   .   .   .   .   .   .   .   .   .   .   .   .   .   .   .   .   .   .   7
    1.2 Research questions      .   .   .   .   .   .   .   .   .   .   .   .   .   .   .   .   .   .   .   .   .   .   .   .   .   .   .   .   .   .   .   7
    1.3 Beijer Electronics .    .   .   .   .   .   .   .   .   .   .   .   .   .   .   .   .   .   .   .   .   .   .   .   .   .   .   .   .   .   .   .   8
    1.4 Limitations . . . . .   .   .   .   .   .   .   .   .   .   .   .   .   .   .   .   .   .   .   .   .   .   .   .   .   .   .   .   .   .   .   .   8
    1.5 Contributions . . .     .   .   .   .   .   .   .   .   .   .   .   .   .   .   .   .   .   .   .   .   .   .   .   .   .   .   .   .   .   .   .   8
    1.6 Related work . . . .    .   .   .   .   .   .   .   .   .   .   .   .   .   .   .   .   .   .   .   .   .   .   .   .   .   .   .   .   .   .   .   8

2   Theory                                                                                                                                                  11
    2.1 Augmented reality . . . . . . . . . . . . . . .                                 .   .   .   .   .   .   .   .   .   .   .   .   .   .   .   .   .   11
         2.1.1  Definition of augmented reality . . .                                    .   .   .   .   .   .   .   .   .   .   .   .   .   .   .   .   .   11
         2.1.2  A brief history of augmented reality                                    .   .   .   .   .   .   .   .   .   .   .   .   .   .   .   .   .   11
         2.1.3  Tracking technologies . . . . . . . .                                   .   .   .   .   .   .   .   .   .   .   .   .   .   .   .   .   .   12
         2.1.4 Form factors . . . . . . . . . . . . .                                   .   .   .   .   .   .   .   .   .   .   .   .   .   .   .   .   .   13
         2.1.5  Developing for handheld AR . . . .                                      .   .   .   .   .   .   .   .   .   .   .   .   .   .   .   .   .   14
    2.2 Artificial intelligence . . . . . . . . . . . . .                                .   .   .   .   .   .   .   .   .   .   .   .   .   .   .   .   .   15
         2.2.1  Definition of artificial intelligence .                                   .   .   .   .   .   .   .   .   .   .   .   .   .   .   .   .   .   15
         2.2.2 Machine learning . . . . . . . . . . .                                   .   .   .   .   .   .   .   .   .   .   .   .   .   .   .   .   .   16
         2.2.3 Deep learning and neural networks .                                      .   .   .   .   .   .   .   .   .   .   .   .   .   .   .   .   .   17
         2.2.4 Convolutional neural networks . . .                                      .   .   .   .   .   .   .   .   .   .   .   .   .   .   .   .   .   19
    2.3 Design methods . . . . . . . . . . . . . . . .                                  .   .   .   .   .   .   .   .   .   .   .   .   .   .   .   .   .   19
         2.3.1  User Centered Design . . . . . . . .                                    .   .   .   .   .   .   .   .   .   .   .   .   .   .   .   .   .   19
         2.3.2 Interviews . . . . . . . . . . . . . . .                                 .   .   .   .   .   .   .   .   .   .   .   .   .   .   .   .   .   19
         2.3.3 Prototyping . . . . . . . . . . . . . .                                  .   .   .   .   .   .   .   .   .   .   .   .   .   .   .   .   .   20
    2.4 NASA TLX and SUS . . . . . . . . . . . . .                                      .   .   .   .   .   .   .   .   .   .   .   .   .   .   .   .   .   20

3   Design and development                                                                                                                                  21
    3.1 Concept phase . . . . . . . . . . . . . . . . . . . . . . . . . . . . . . . . . .                                                                   21
         3.1.1   Initial meeting with stakeholders . . . . . . . . . . . . . . . . . . .                                                                    21
         3.1.2   Gathering information on augmented reality technologies . . . . .                                                                          22

                                                                                                                                                             5
CONTENTS
3.1.3 Gathering information on deep learning technologies . . . . . . . . 23
3.1.4 TensorFlow . . . . . . . . . . . . . . . . . . . . . . . . . . . . . . . 24
3.1.5 Lo-fi prototypes . . . . . . . . . . . . . . . . . . . . . . . . . . . . 24
3.1.6 Testing the ARCore and TensorFlow prototypes . . . . . . . . . . . 29
3.1.7 Phase summary . . . . . . . . . . . . . . . . . . . . . . . . . . . . . 31
3.2 Development phase . . . . . . . . . . . . . . . . . . . . . . . . . . . . . . . 31
3.2.1 Development of hi-fi prototype . . . . . . . . . . . . . . . . . . . . 32
3.2.2 Development of Beijer X2 Control interface . . . . . . . . . . . . . 34
3.2.3 Combining elevator with hi-fi prototype and Beijer X2 Control . . 36
3.2.4 Phase summary . . . . . . . . . . . . . . . . . . . . . . . . . . . . . 36
3.3 Testing phase . . . . . . . . . . . . . . . . . . . . . . . . . . . . . . . . . . 36
3.3.1 Participants . . . . . . . . . . . . . . . . . . . . . . . . . . . . . . . 37
3.3.2 Equipment . . . . . . . . . . . . . . . . . . . . . . . . . . . . . . . 37
3.3.3 Roles . . . . . . . . . . . . . . . . . . . . . . . . . . . . . . . . . . 37
3.3.4 Location and dates . . . . . . . . . . . . . . . . . . . . . . . . . . . 38
3.3.5 Procedure . . . . . . . . . . . . . . . . . . . . . . . . . . . . . . . . 38
3.3.6 Test objectives . . . . . . . . . . . . . . . . . . . . . . . . . . . . . 38
3.3.7 Phase summary . . . . . . . . . . . . . . . . . . . . . . . . . . . . . 40
4 User study results 41
4.1 Pre-test survey . . . . . . . . . . . . . . . . . . . . . . . . . . . . . . . . . . 41
4.2 SUS . . . . . . . . . . . . . . . . . . . . . . . . . . . . . . . . . . . . . . . . 44
4.3 NASA TLX . . . . . . . . . . . . . . . . . . . . . . . . . . . . . . . . . . . 46
4.4 Timekeeping of task completion . . . . . . . . . . . . . . . . . . . . . . . . 48
4.5 Post-test survey . . . . . . . . . . . . . . . . . . . . . . . . . . . . . . . . . 48
4.6 Error sources . . . . . . . . . . . . . . . . . . . . . . . . . . . . . . . . . . . 52
5 Discussion 53
5.1 Discussion of result in relation to research questions . . . . . . . . . . . . . 53
5.2 Discussion on flaws and improvements . . . . . . . . . . . . . . . . . . . . 55
5.3 The design process . . . . . . . . . . . . . . . . . . . . . . . . . . . . . . . . 56
5.4 Suggestions on future work . . . . . . . . . . . . . . . . . . . . . . . . . . . 57
6 Conclusions 59
References 61
6Chapter 1
Introduction
1.1 Purpose and goal
The fourth industrial revolution, or Industry 4.0 [23], represents the idea in which machines
are augmented with wireless connectivity and sensors, creating smart and connected facto-
ries. Thanks to recent advances in areas such as communication technologies, automation and
artificial intelligence, it has been possible to improve efficiency by, for example, predicting
machine maintenance autonomously or react to changes in production with self-organized
logistics [29]. One emerging technology, augmented reality (AR), enhances the experience of
the real world by adding digital elements to it. This makes it a useful tool in the industry, for
example in use cases like expert support through remote guidance or complex assembly.
The purpose of this work is to create an extended human-machine interface through an
mobile Android application using AR. By using the application, people working in a factory
should be able to easily see relevant and real-time data about a machine and control it when
the tablet’s camera is aimed towards it. Today, most machines are operated using a built-in
display. The goal is that this application should work as a complementary interface to the
built-in display interface, showing the user real-time data.
1.2 Research questions
These are the research questions which this thesis is based upon:
• Could an augmented reality interface work as a complementary interface to a tradi-
tional touch user interface?
• What are the benefits and drawbacks of using an augmented reality interface in this
context?
• What kind of data is suitable for an augmented reality interface?
71. Introduction
1.3 Beijer Electronics
Beijer Electronics is a Swedish technology company that develops and manufactures human
machine interface (HMI) displays, among others. The company’s customers are mainly ma-
chine manufacturers which in turn integrate the display into their machines. Beijer Elec-
tronics also develops the software iX Developer, which is used to create the interface in the
display [9].
1.4 Limitations
In this section the limitations which were set for this project will be presented. The first
technical limitation was that the AR application would only be able to control a small ma-
chine located inside the office building. This was decided because in order to do it on a large
machine in a factory the authors would need full access to the factory, which would not be
possible. The other technical limitation was that the application would only be developed for
android and not iOS. Because Beijer only uses Windows based computers it became the best
option if they would decide to develop the application further in the future, this of course
meant that the authors could not use ARKit from Apple.
1.5 Contributions
Fredrik focused more on developing a deep learning lo-fi prototype, capable of recognizing
the different coffee machines in the Beijer offices. At a later stage he focused on creating the
interface for the Beijer X2 Control and the communication between the AR prototype and
the electronic elevator.
At the start of the project, Gustav focused on developing lo-fi AR prototypes using dif-
ferent libraries such as ARCore and Vuforia. In the development phase he focused more on
further development of the ARCore prototype and implementing controls for the elevator
and a way of handling errors using the application.
Both authors created the two test plans, for the initial and the final test, and played active
roles during the test sessions. The authors developed the final prototype together but were
responsible for different aspects of the application. The report writing were also done by
both with an equal amount of work done.
1.6 Related work
Subakti et al. in [33] developed a mobile markerless augmented reality [32] app very similar
to the project in this thesis. They used transfer learning [14] on a MobileNet [17] model
and trained it with pictures of three different machines on their campus. They even went
a step further by training an object detection model for separate parts of a machine, such
as the power cabinet and emergency stop. With the help of the smartphone’s depth sensor,
they created a distance-aware application where information with various level of detail was
81.6 Related work
displayed depending on the user’s distance to the machine. When a machine was recognized,
the application fetched machine data from the back-end and displayed it in the application.
Tsai et al. in [34] created an Escape Room game combining indoor Bluetooth position-
ing, image recognition and augmented reality. Bluetooth positioning and image recognition
are used to find clues, the former by revealing a clue when the user is at a specific position
in the room and the latter by scanning real world objects. The mobile application was de-
veloped using Vuforia [20], an AR platform which makes it easier to add computer vision
functionality to mobile devices. With its help, the authors scanned objects that were sup-
posed to contain clues. When a user pointed the camera towards the clue, a clue would pop
up. One of the major challenge in this project was to create the coordinate system for the
indoor positioning.
Sabarinathan et al. in [31] developed an mobile AR-application for machine mainte-
nance. They used a tool called CraftAR developed by catchoom®for image recognition and
augmented reality. Once a machine is recognized, its features are fetched from a local server
and displayed in a menu together with other options such as name and manufacturer in-
formation, maintenance information and maintenance logs. The user can interact with the
different menu options and, for example, add a new entry to the maintenance log. If the user
has to perform maintenance on the machine, he or she can get help from the app through
its AR-feature, which superimposes AR-elements such as labels and instructions on the ma-
chineparts.
91. Introduction 10
Chapter 2
Theory

This chapter contains the theoretical background of the report, including information about
augmented reality, machine learning and design methods.

2.1        Augmented reality
In this section, the definition and history of augmented reality is explained. Additionally,
different tracking technologies and form factors are evaluated. It ends with a description of
how to develop for handheld augmented reality.

2.1.1       Definition of augmented reality
Augmented reality (AR) is a technology which allows the user to view a physical real-world
environment that has been enhanced (augmented) by adding virtual information to it. It
is meant to enhance the user’s interaction with the real world, as opposed to virtual reality
(VR), which encloses the user in a virtual world [10]. Augmented reality is also not limited
to the use of a particular type of display, such as the head-mounted display (HMD), virtual
objects can be displayed in the real world through the use of a camera on a phone or tablet
as well. In 1997, Ronald Azuma writes the first survey in AR, providing a widely recognized
definition of AR by identifying it as combining the real and virtual world, the real-world
being registered in 3D and interactive in real time [4].

2.1.2       A brief history of augmented reality
The first appearance of augmented reality dates back to the 1950s when Morton Heilig
thought of the cinema as an activity which could involve all of the viewers senses. Heilig
built his first prototype back in 1962 which was called Sensorama. It was able to stimulate

                                                                                          11
2. Theory
Figure 2.1: Ivan Sutherland’s Sensorama in 1966. Image from Pin-
terest.
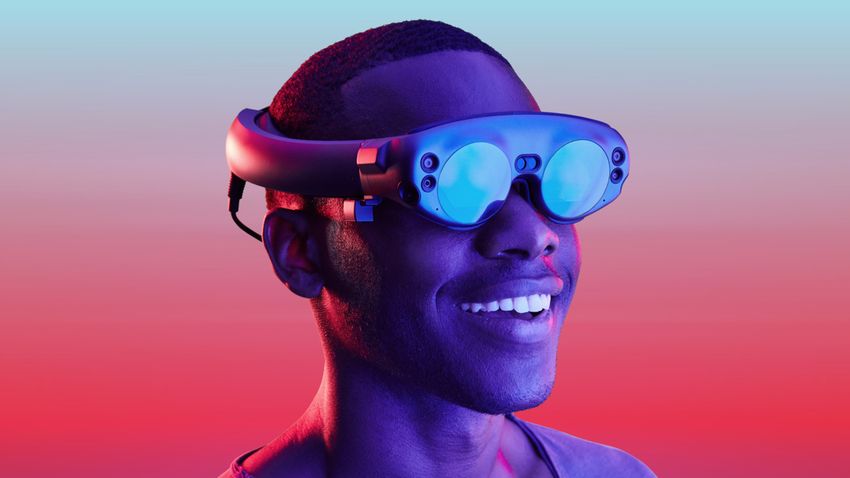
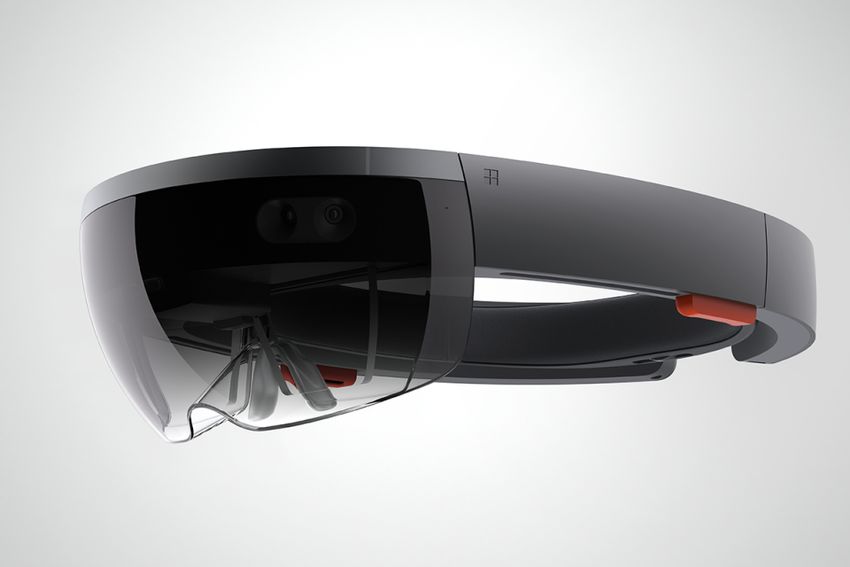
(a) Hololens (b) Magic
Leap One
Figure 2.2: In figure (a) the Hololens from Microsoft is displayed. In
figure (b) the Magic Leap One from Magic Leap is displayed. Both
of which are augmented reality headsets.
several of the users senses while watching a movie. Next up was Ivan Sutherland who in-
vented the first head-mounted display in 1966, which can be seen in figure 2.1. It was further
developed in 1968 by creating an AR system using an optical see-through HMD.
Myron Kreuger then invented the Videoplace in 1974 which allowed the user to actu-
ally interact with a digital object. The phrase ’augmented reality’ was coined in 1990 by a
Boeing researcher called Tom Caudell as a means to describe the merging of virtual graph-
ics into physical displays. In the early 2000s the world’s first open-source software library,
ARToolKit, is created by a man named Hirokazu Kato. With this library the first outdoor
AR game, ARQuake, is also released. As of late augmented reality is a widely used technol-
ogy in phones and tablets. In 2016, the augmented reality game Pokemon Go was launched,
it reached a peak of 45 million daily users. Both Apple and Google launched their own re-
spective augmented reality developer kits in 2017, ARKit and ARCore, making it possible for
developers to easily develop augmented reality applications. Development of new augmented
reality hardware is increasing in parallel with new software, some more notable products are
the HoloLens from Microsoft, as can be seen in figure 2.2a and the Magic Leap One from
Magic Leap, seen in figure 2.2b.
2.1.3 Tracking technologies
One of the challenges developing augmented reality applications is the accurate tracking and
registration between computer-generated object and real world objects [19]. When a user
locates to another position, the virtual objects must remain aligned with real world objects,
122.1 Augmented reality
this will depend on how accurate the tracking is. In this project, marker-based tracking
and marker-less tracking have been used, both of these are types of vision based tracking.
Vision based tracking uses computer vision technologies in order to calculate the camera
pose relative to real-world objects [19]. According to Zhou et al, this is the most active area
of research in AR [36].
Marker-based tracking
In Marker-based tracking, visual markers are placed in the scene for augmented reality ap-
plications [19]. These markers have specific properties that make them easy to track and to
identify their position in the real world. Google’s augmented reality development kit, AR-
Core, is able to use 2D images such as posters or product packaging as markers. By providing
a set of reference images ARCore can predict the markers position in the real world. How-
ever, marker-based tracking comes with a few drawbacks. One restriction is that it can be
quite time-consuming and requiring a large number of markers if several objects or locations
are to be augmented. Another drawback is that the markers often cannot be attached to the
objects which are supposed to be augmented [10].
Markerless tracking
In markerless tracking, natural features of the environment which are to be augmented are
used instead. These natural features are sometimes called interest points or key points and
must meet several requirements.
• Fast computational time. It must be possible to calculate a sufficient number of feature
points in order to allow for a pose estimation at an acceptable rate [10].
• Robustness with respect to changing lightning conditions and image blurring. The set of fea-
ture points must not vary significantly under various lightning conditions or upon
image blurring, this can easily happen in outdoor environments [10].
These feature points are then matched against corresponding feature points inside a database
to extract a respective six degrees of freedom (6DOF) pose. This task is called feature match-
ing and is one of the most critical tasks of tracking. The feature points inside the database
can be used as reference for the real object to be tracked, the real objects dimensions must be
known in advance [10]. The database holding these feature points is referred to as a feature
map. Often an image or a bitmap is sufficient enough to create a feature map of an object
and these are created before the start of the tracking. The tracking process is then initialized
by the gathering of visual data from the real world, creating feature maps. The size of the
feature maps increase with each new frame and the positions of already found feature points
are improved. During this phase the feature points are used to create a 3D plane which is
then used as the basis for the virtual objects in the AR application [10].
2.1.4 Form factors
Augmented reality is a diverse field where the technology is implemented on a wide vari-
ety of hardware. The main categories can be divided into handhelds and head-worn. The
132. Theory
Figure 2.3: Google’s ARCore logo to the left and Apple’s ARKit logo
to the right.
head-worn includes headsets and helmets while the handhelds include mobile devices (smart-
phones, tablets, laptops) [25]. Both Apple and Google have developed their own AR devel-
oper kits, ARKit and ARCore respectively. ARKit only works for iOS and ARCore works
for both Android and iOS. Both of these tool kits have made it possible to more easily de-
velop augmented reality applications for both categories. The market for handheld hardware
is however much larger since most smartphones produced today are AR-capable and the
head-worn hardware tend to be expensive. It might however be hard to create a truly im-
mersive experience on a smartphone. The reasons being that the user is forced to hold their
phone up in front of their face for a long time and that the screen is to small to capture the
3D environment in its entirety. The key capabilities of Google’s ARCore are motion track-
ing, environmental understanding and light estimation. Motion tracking allows the phone
to understand it’s position relative to the world, this process is, according to Google, called
concurrent odometry and mapping, or COM. It allows ARCore to detect visually distinct
feature points and use these points to compute its change in location [12]. Environmental
understanding refers to allowing the phone to detect the size and location of surfaces in the
real world. Lastly, light estimation allows the phone to estimate the environment’s current
lightning conditions. Apple’s ARKit has similar capabilities as ARCore.
2.1.5 Developing for handheld AR
There are a number of software development kits (SDKs) to choose from when developing
an augmented reality application. Some of these will be presented in this subsection along
with the development environments they can be used in.
• ARCore. ARCore is the AR SDK provided by Google. It can be used with multiple
developer environments, for example Android Studio and Unity. Unity is a game en-
gine with its own development environment and by using this in combination with
ARCore, applications for both iOS and Android can be developed. Google has several
tutorials and sample projects available on their website. Each sample makes use of the
different features available in the ARCore library and makes it possible to start with
some boilerplate code.
• ARKit. ARKit [2] is the augmented library provided by Apple and can only be used
in Apple’s own developer environment, Xcode. It is therefore not possible to develop
142.2 Artificial intelligence
Android application using ARKit. Apple has several samples created with ARKit avail-
able on their website alongside with design guidelines and session videos.
• Vuforia. Vuforia enables developers to add computer vision functionality to applica-
tion, allowing it to recognize pictures and objects, and augment them by adding virtual
elements. Vuforia has several tutorials and samples on their website representing the
different features available in the Vuforia library. These samples can be run in both
Unity and Android Studio, making it possible to use Vuforia to create both Android
and iOS applications. Some of the features available in the Vuforia library are:
– Model targets, which allows the application to recognize an object by it’s shape
and then place AR content on it.
– Object targets are created by scanning an object, this is mostly viable for smaller
items with rich detailing.
– Image target allows the user to place AR content on a flat recognizable surface
[35].
2.2 Artificial intelligence
During the last decade, Artificial intelligence (AI) has gained an increasing amount of media
attention. Advancements in areas such as self-driving cars and virtual assistants has brought
AI closer to the consumer. Despite that, AI has been around since the 1950s, when Christo-
pher Strachey at the University of Oxford developed a program that could play a full game
of checkers [7]. As can be seen in figure 2.4, AI encompasses other areas such as machine
learning and deep learning. This section will explain what AI, machine learning and deep
learning are and how neural networks are used to create a deep learning application.
Figure 2.4: Deep learning is a subset of machine learning, which is a
subset of artificial intelligence [6].
2.2.1 Definition of artificial intelligence
AI can be defined as ”the ability of a digital computer or computer-controlled robot to per-
form tasks commonly associated with intelligent beings” [7]. This means that AI is a general
152. Theory
field, not only including machine learning and deep learning, but also approaches that do
not involve any learning. For example, early chess programs included hard coded rules for
how the program should react. For a period between the 1950s and late 1980s, this approach,
called symbolic AI, was the dominant way of developing AI programs. Experts believed that
human-like artificial intelligence could be attained by creating a sufficiently large set of ex-
plicit rules for manipulating knowledge. This approach worked well for well-defined, logical
problems, but turned out to be unmanageable for problems such as image recognition and
speech recognition. Machine learning happened to work much better for these types of prob-
lems and arose to take symbolic AI’s place.
2.2.2 Machine learning
In machine learning, a program is trained rather than explicitly programmed. As displayed
in figure 2.5, a machine learning program is fed with a rather big amount of data and answers
(expected output). In this so called training phase, the program ”learns” to associate a specific
piece of data with an answer. If the program is supposed to classify an image, for example,
the data could be an image of a banana and its answer would be the tag ”banana”.
Figure 2.5: Difference between classical programming and machine
learning [6].
In machine learning, the most common types of learning are supervised learning, unsu-
pervised learning and reinforced learning [30]:
• In supervised learning, the machine learning algorithm is trained with a set of input-
output pairs (x j , y j ), where y j was generated by an unknown function y = f (x). The
task of supervised learning is to find a function h that approximates the true function
f . Common supervised learning algorithms are classification and regression. Classifi-
cation is used when the output y is restricted to a limited set of values. If the output is
a number in a range (such as tomorrow’s temperature), the learning problem is called
regression. Figure 2.5 displays supervised learning.
• Unsupervised learning algorithms try to find structures and patterns in input data, even
though no expected output is given. Using commonalities found in the input data, the
algorithm can react on new data based on the presence or absence of these. The most
common task is clustering: dividing a set of data points into groups so that members
of a group are similar to each other and dissimilar to data points in other groups.
• In reinforced learning, the algorithm learns through ”experience”. Every time the algo-
rithm does something right, it will be rewarded (positive reinforcement), and when
it does something wrong, it will be punished (negative reinforcement). For example,
a machine learning program could learn to play chess by using reinforced learning,
iterating over and over again until it understands the mechanisms of the game.
162.2 Artificial intelligence
In this project, supervised learning was used. When creating a machine learning model
using supervised learning, three things are needed:
• Input data. This could, for example, be images, sound files or text files.
• Expected output for each piece of input data. For image recognition, this would be a
tag such as ”banana”, ”apple” etc. For speech recognition, this would be a transcript of
the sound file.
• A way to measure if the algorithm is doing a good job. In this part (the actual learning),
the algorithm’s current output is compared to the expected output and the result is used
to adjust how the algorithm works.
The machine learning model is supposed to transform the input data into meaningful
output. This is done by using known examples of input and output data and learn from them.
Therefore, a major challenge in machine learning is to find meaningful representations of the
input data and to transform it into a representation which makes it easy for an algorithm to
make a decision.
2.2.3 Deep learning and neural networks
Deep learning is a sub-field of machine learning in which the model being trained has more
than one layer between its input and output. The number of layers is called the depth of the
model. This number often ranges between tens up to hundreds of successive layers. In most
cases, neural networks are used to create a deep learning model [16]. The basic structure of
how a deep learning model might look like can be seen in figure 2.6. What happens with
the input’s representation between the different layers is specified in the layer’s weight. The
weights are basically numbers telling the model how the representation should be modified
when going from one layer to the next. To be able to know how far of the model’s prediction
is from the correct output, a loss function is needed. The loss function computes a distance
score which shows how well the model did on this example. This score is in turn used by
the optimizer, which uses it to adjust the weights a little. This is called backpropagation, a
central algorithm in deep learning [6]. The initial values of the weights are random numbers,
thus the distance score will be high in the beginning. For every new input-output pair, the
weights will be adjusted and the distance score will decrease. Once a minimal loss has been
found, the network is trained.
The basic building blocks of a neural network are:
• A layer is the fundamental data structures of a neural network. Many layers are com-
bined into a network. A layer is in turn made up of nodes, each holding a single number.
Depending on how the network is designed, the different layers can contain varying
numbers of nodes. As can be seen in figure 2.7, each node (also called artificial neu-
ron) receives one or more inputs from other nodes. These are multiplied with the
corresponding weight and the products are summed with a bias. Finally, an activation
function (also called transfer function) is applied on the result. The activation func-
tion is used to limit the minimum and maximum of the output, since it theoretically
could range from negative infinity to infinity. Often a sigmoid function is used [28].
The role of the bias is to enable the algorithm to shift the activation function to the
172. Theory
Figure 2.6: The anatomy of a neural network, often used in deep
learning [6].
left or right to, for example, output zero for a certain input. The output for the nth
neuron can be expressed as:
X
yn = φ( (wn xn ) + b)
• The loss function (objective function) computes the loss of the network by comparing
the networks prediction to the actual value. This function is what will be minimized
during training.
• An optimizer, which updates the network weights in response to the output of the loss
function.
Figure 2.7: How the input of a single node is mapped to its output
[28].
182.3 Design methods
2.2.4 Convolutional neural networks
In this project, a special type of deep learning-model, called convolutional neural network
(CNN), was used. CNNs are very common in computer vision applications [6]. A convolution
is a special type of linear operation and a CNN is a network that uses convolution instead of
general matrix multiplication in at least one of its layer [11]. The key advantages of a CNN
compared to a regular neural network when used for computer vision are:
• Translation invariant. If CNN learns a pattern in one part of an image, it will be able to
recognize it in other parts of the image. A regular (densely connected) network would
have to learn the pattern again if it appeared in an other location.
• Spatial hierarchies of patterns. A first convolution layer learns local patterns such as edges
and other shapes, the next convolution layer learns patterns made up of the features
from the previous layer, for example an eye or ear, and so on, using the features from
one layer as building blocks in the next.
2.3 Design methods
In this section the different design techniques and processes are presented. The user centered
design process was used as a basis when structuring how the project would be done. The two
techniques interviewing and prototyping were used extensively throughout the process.
2.3.1 User Centered Design
User-centered design (UCD) is a term used to describe design processes in which the end-user
influences how the design takes shape [1]. The key principles of UCD are that the designers
must first understand who the users will be, the measurements of the designs should be done
empirically by letting users use prototypes to carry out real life work and the design pro-
cess must be iterative and based on feedback from the user testing [15]. UCD have several
advantages, one being that the products require less redesign and that they integrate into
the environment more quickly since the users motivations and goals have been taken into
consideration [1]. The design process can be divided in three phases, The concept phase, the
development phase and lastly the testing phase. The purpose of the concept phase is explor-
ing what the users and stakeholders would find desirable in a product of this kind. It consists
of evaluations, information gathering, observations and analysis which will result in different
concept ideas and lo-fi prototypes. These prototypes are then evaluated by stakeholders and
end users. The concept phase ends when one single lo-fi prototypes is chosen. The next phase
is the development phase where the lo-fi prototype is further developed into hi-fi prototypes.
The hi-fi prototype is then tested in the testing phase with both stakeholder and end-users
[3].
2.3.2 Interviews
A user interview is a UX research method during which the researcher asks one user ques-
tions about a specific topic, this could include behaviours, goals or the use of a system. User
192. Theory interviews are one-on-one sessions and tend to be an effective method to collect user data. User interviews can be done during multiple times during the life cycle of a project with dif- ferent purposes. For example, conducting a user interview before the design is ready is done in order to get a better understanding about the user and what their needs are [26]. There are four main types of interviews, unstructured, structured, semi-structured and group in- terviews. The first three types names corresponds to the level of control the interviewer has on the conversation. If the objective is to evaluate how users react to a new design idea, a more unstructured interview is appropriate. However, if the goal is to evaluate a particular design feature, then a more structured interview might be a better approach [27]. 2.3.3 Prototyping A prototype is an early draft of how a future product might look and feel. It can involve the whole product or just a part of its functionality and it allows designers, stakeholders and users to consider, think about, evaluate and develop an idea [3]. The reason for working with prototypes is that the requirements are almost impossible to determine before the product actually consists in any form. Prototypes can be created using different fidelity’s, a low fidelity (lo-fi) prototype could be created with some paper and a pen. Performing usability tests on a lo-fi early in the design process allows the designer to discover what kind of need and requirements different stakeholders have. Furthermore they are easy and cheap to change, already developed products are not [3]. Another form of prototype is a high fidelity (hi-fi) one, these are often interactive and computer generated with a high level of detail. 2.4 NASA TLX and SUS In this subsection the NASA Task Load Index (TLX) and the System usability scale (SUS) will be briefly explained. NASA TLX The NASA Task Load Index is a tool developer by the Human Performance Group at NASA and is used regularly in healthcare and aviation. It is used to assess the perceived physical, mental and temporal demand of performing a specific task or while using a system. It is also a measurement of the perceived performance, effort and frustration [24]. SUS The system usability scale consists of a 10 item questionnaire with five responses ranging from Strongly agree to Strongly disagree and is used for measuring the usability of a products, systems or services. The participant’s scores for each question are converted to a number, added together and multiplied by 2.5 in order to get a point from 0-100. A SUS score above 68 is considered to be above average and anything below is considered to be below average [5]. 20
Chapter 3
Design and development

In this chapter, each design and development phase of this project is presented in detail. An
idea is brought to the concept phase and during this phase it evolves into several concepts
and lo-fi prototypes. In the development phase these prototypes are further developed and
turned into one or more hi-fi prototypes. The testing phase involves testing and evaluating
the hi-fi prototype with end-users and stakeholders.

3.1        Concept phase
In the concept phase discussions were held with both stakeholders in order to outline what
had to be developed. Relevant information gathering about augmented reality and machine
learning was also done in order to determine how these technologies could be utilized to
fulfill the visions of the stakeholders and target-users.

3.1.1       Initial meeting with stakeholders
An initial meeting with Beijer Electronics was held in order to figure out what goals they
had for this application. Why did they want to develop it and what value could AR give
the target-user and Beijer’s other customers. Apart from discussing the specific application

                           Figure 3.1: Phases through the project.

                                                                                          21
3. Design and development
Figure 3.2: Goals after initial meeting with Beijer Electronics.
and the goals for it, this was also a chance to gather information about how Beijer Electronics
business worked, who their customers were and how their own software iX Developer worked
with their HMI:s. The outcome of these discussions were that Beijer is currently exploring
its role in this new dimension of technology and were value can be added for their customers.
The goal for this project is to create a proof of concept and a complementary interface for
Beijers’ HMI:s. The specific features of this interface were not specified at this point since
more domain knowledge had to be gathered and interviews with the target-users had to be
held in order to pinpoint what would create value for them. One feature was however clari-
fied and that was that the application would have to be able to recognize a certain machine
and visualize real-time data about it. This feature poses several questions since machines on
an industrial scale tend to be rather large and if this would be possible with the augmented
reality developer kits available today or if this had to be done with deep learning, or a combi-
nation of the two. The goals which were outlined after the meeting are represented in figure
3.2.
3.1.2 Gathering information on augmented reality tech-
nologies
In order to get a better understanding of what the current state of AR were at and how to
develop AR applications several experimental prototypes were created. These prototypes
were created because there was a need to examine which environment and which developer
kit would suit this project the most and to find out what was possible to achieve with them in
a practical way. The different developer environments used were Unity or Android Studio,
and the AR SDKs explored were ARCore from Google and Vuforia. In order to get a sense of
what features would align most with the project, both ARCore and Vuforia were evaluated in
Unity and Android Studio, resulting in several prototypes. ARCore and Vuforia both have
a set of varying features. Some of these features which have been tried in this project are
presented in the following list.
• Vuforia
– Image Target: Attach content onto flat images
223.1 Concept phase
Figure 3.3: Simple scanning stage.
Figure 3.4: The Vuforia Object Scanner application used to scan
physical 3D objects.
– Object Target: Created by scanning an object, good option for small objects with
rich surface detail.
• ARCore
– Augmented Images: Allows ARCore to track and respond to 2D images fixed in
a place. By the use of the integrated arcoreimg tool the user can create a database
with images which ARCore can track.
Unlike Vuforia, ARCore does not have the ability to track 3D objects, only planes and
2D images. However the object target feature of Vuforia is only applicable on smaller objects
such as toys and gadgets. In order to properly scan an object it needs to fit into a Object
Scanning Target printout, as presented in figures 3.3 and 3.4.
3.1.3 Gathering information on deep learning tech-
nologies
Because of the projects time limits, development of the deep learning prototype had to go
fast. Therefore, some type of framework or library had to be used. After some research, the
Python library Keras with TensorFlow was chosen.
233. Design and development
3.1.4 TensorFlow
TensorFlow is an open source library used for high performance numerical computation
which makes creating machine learning applications a lot easier. The library is developed
by Google and used for both research and in production [8]. TensorFlow is cross-platform
which means that it runs on nearly everything, for example GPUs, CPUs (including mobile
and embedded platforms), and so called Tensor Processing Units (TPU) [21]. In this project,
the deep learning model ran on a mobile Android device.
TensorFlow can be used with many different programming languages, front-end APIs
exists for Python, C, and C++, among others. On top of the Python API, higher-level APIs
sit, which makes the training and evaluation of distributed models even easier. One of those is
Keras [22], an open-source library built specifically for fast experimentation with deep neural
networks.
On mobile devices, special constraints such as lower CPU capacity and a limited amount
of power and memory exists. For these type of devices, TensorFlow Lite (TF Lite) [13] was
created. TensorFlow Lite deep learning models are smaller in size and stored using a special
format. The more optimized and smaller the model is, the faster the model will be, but with
a trade-off in accuracy [13].
Transfer learning
Instead of building a new neural network from scratch, it is possible to reuse other models.
In this project, a model that was trained to recognize 1000s of different objects was used as a
base. The original weights where not adjusted, instead the last layer was replaced with a very
small model which uses the base models output as its input. This process is called transfer
learning [14] and makes experimenting with neural networks a lot faster. The base model
used in this project was Google’s MobileNet V2 [18].
3.1.5 Lo-fi prototypes
In this subsection, the different lo-fi prototypes developed in this phase will be presented
and why the ARCore and Deep Learning prototypes were chosen to be continued with.
ARCore - Augmented Image
This prototype was developed in Java using Android Studio and was based on the Augmented
Images sample provided by Google. The sample allowed the user to scan a picture of the earth
and augment a frame around the edges. The reason for starting from this sample was that
it allowed the user to scan a picture which could be placed on a machine and augment this
machine with controllers and menus to get information about it. The sample could easily be
modified to show something else than a frame and by using a tool called the arcoreimg tool
pictures of an object could be used to create a database with pictures which the application
could then recognize and augment. Each picture in the database was evaluated using the
arcoreimg tool and was given a value between 0-100, where a value of over 70 was considered
to be a good picture for this application. In order to properly recognize a certain picture
it had to include many unique feature points and avoid repetitive features. An idea for this
243.1 Concept phase
Figure 3.5: Lo-fi prototype based on ARCore Augmented Images,
capable of recognizing 2D images of the coffee machine on the right.
prototype was to take pictures of a coffee machine in the office building from many different
angles, and by doing so allowing the application to recognize a 3D object by searching through
this database of 20 pictures of the coffee machine, the maximum number of images allowed
in a arcoreimg database was 20. This did not work well, but the application did recognize
a 2D picture of the coffee machine very quickly, the next step was to show menus to the
user once the image had been recognized. The menus were placed above the picture so that
the user would be able to visualize that the controls in the menu were meant to be used to
operate the coffee machine. In order to show how this could be applied to a larger machine
in an industrial environment two menus were placed to the left of the original menu with
the headers "Machine Part 1" and "Machine Part 2", seen in figure 3.5.
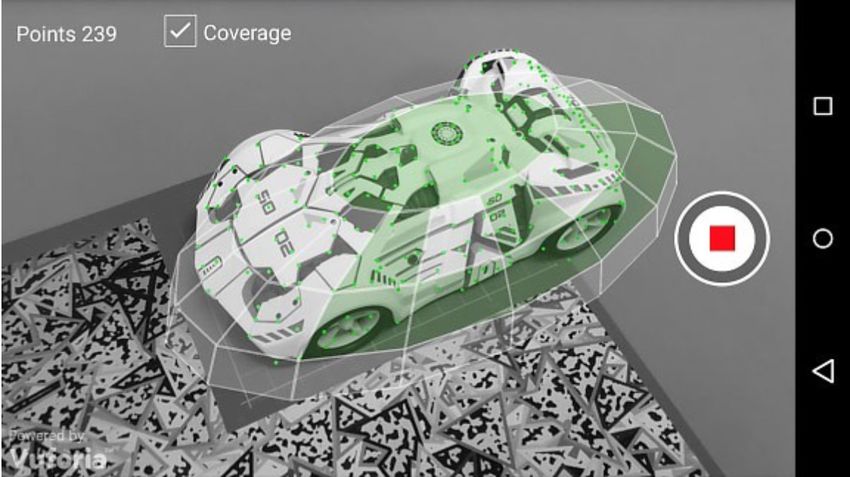
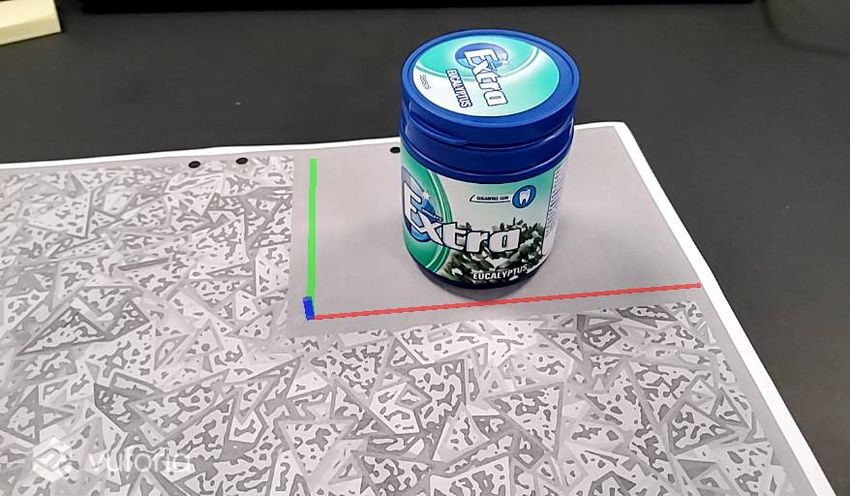
Vuforia - Object Target
As mentioned in 2.1.5, the object target feature allows the user to recognize objects based
on a 3D model of it. The 3D model had to be scanned using Vuforia’s own tools and is
mostly suitable for smaller objects. In order to evaluate this feature a simple prototype was
developed using Unity and the Vuforia object recognition sample. The sample included a
pre-configured object-recognition scene as a starting point. In order to use this, a physical
object had to be scanned with the Vuforia Object Scanner in order to create an Object Data
file, a sample of this can be seen in figure 3.4. The file is then uploaded to the Vuforia Target
Manager where a Device Database is generated based on those uploaded files. The database
is then downloaded and can be used in the sample project provided by Vuforia. In order to
try this out a small object was scanned, which can be seen in figure 3.6. The main goal of
the project at this point was to find an easy way to recognize a machine or a machine part,
therefore the Vuforia Object Target turned out to be a dead end since it is currently designed
253. Design and development
Figure 3.6: Vuforia Object Scanner used on a box of gums.
to work with smaller toys and consumer products and not bigger machinery. There would
also be a problem in differentiating between two identical machines in a factory using this
method.
Vuforia - Image target
Similar to the ARCore prototype using Augmented Images, Image targets from Vuforia rep-
resents images that the Vuforia engine can detect, track and augment 2D printed images.
The images had to have many unique feature points and not contain repetitive patterns. The
image targets are created using the Vuforia Target Manager and a generated database is then
downloaded to be used in a project. In order to evaluate this method and compare it to the
ARCore prototype a simple prototype was developed using the Vuforia samples available on
their website. The prototype was developed in Unity since it was more difficult getting Vu-
foria to work as intended in Android Studio. It was capable of recognizing a picture of a
book and display a menu to the user with features that could be interesting for an operator
or a service technician in a factory. The idea was to have a unique picture for each machine,
therefore overcoming the problem with having two identical machines. However when the
camera faced away from the picture the augmented menu disappeared, this would make it
hard to augment a larger machine since complementary interfaces would not be able to be
placed on different parts of the machine, as is done in the ARCore prototype.
TensorFlow - Image classification with deep learning
Beijer Electronic’s vision of this project was an app that would be able to recognize a machine
solely on how it looks. Therefore, one of the first prototypes experimented with was an An-
droid application based on a TF Lite example by Google. The example app used a MobileNet
deep learning model that was able to recognize 1000s of different objects.
263.1 Concept phase
Figure 3.7: Vuforia Image Target prototype used on the picture of
the book.
273. Design and development
(a) (b)
Figure 3.8: In figure (a) the TensorFlow app uses a model trained
with 5 epochs and the probability score is 56%, in figure (b) the
model is trained with 2000 epochs and the probability score is 82%.
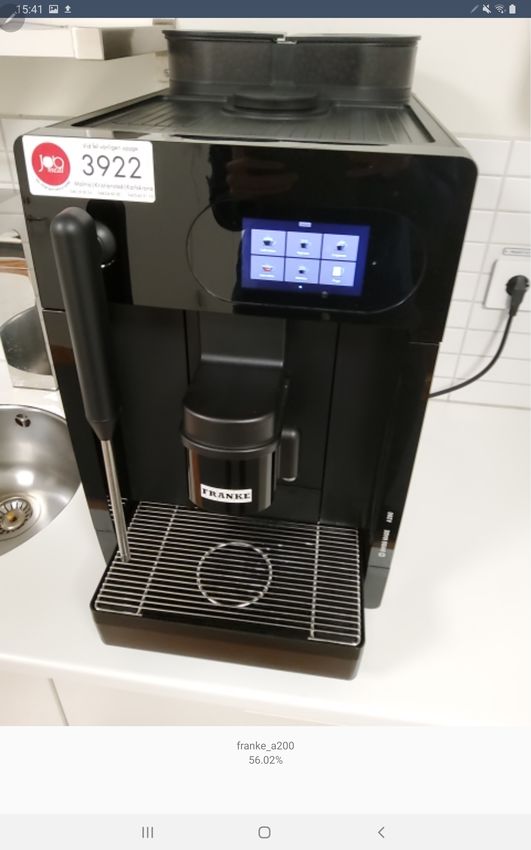
The first step was to retrain the model so it would recognize a machine. Since no machines
where close at hand at Beijer Electronic’s HQ in Malmö, three different coffee machines
where used instead. Using a smart phone camera, the coffee machines were filmed from
many different angles. These video clips were split into around 600 images each using a tool
called ffmpeg. A Python script written by Google was then used to retrain a MobileNet on
the coffee machine images. After some initial testing, the number of images of each coffee
machine was reduced to 100. In hindsight, this number could probably have been even lower,
since these images where only used to retrain the last layer of the model.
The first prototype was unstable and the detected object’s probability score fluctuated
between 40% and 90%. The probability score indicates how sure the model is that the current
image represents one of the coffee machines it was trained on. After some more experiment-
ing, the number of epochs was increased from 5 to 2000 which resulted in a much more stable
probability score, as can be seen in figure 3.8.
The app was configured so that a pop up would be shown if the probability score was
above 80% for more than 1 second. The popup contained specific information about the
machine such as if the power was on or off and and for how long the machine had been
283.1 Concept phase
online. At this stage, this data was hard-coded into the app, but the goal was that the data
would be fetched from a machine in the future. From the menu, the user was able to close
the pop up or get more possible actions by going to an other view. From there it was possible
to contact maintenance or order spare parts.
Combination of ARCore and TensorFlow
After testing the possibilities of developing an AR application using both Vuforia and AR-
Core and in both Unity and Android Studio, the most viable option seemed to be the ARCore
and Android Studio combination. This was mainly because the rendered content would hold
a fix position in the world space even if the camera wasn’t pointed at the tracked image, and it
was easier to implement buttons, menus and other interface components natively in Android
when using Android Studio.
To be able to recognize a real world object and not just a printed 2D image, the deep
learning prototype had to be combined with the ARCore prototype. The idea was to use
deep learning for recognizing the machine and ARCore to augment the recognized machine.
Combining these two proved to be hard since both ARCore and TensorFlow each requires to
run a camera session on Android in order to augment and recognize the machine respectively.
This resulted in a prototype where the screen was divided into two camera sessions where
one was blacked out, while the other one was working. The application was capable of either
recognizing a machine or augment an image, but not augment that which had been recognized
by the TensorFlow model. There was also little to no information to be found regarding
combining ARCore and a TensorFlow model. Because of this project’s time limits, the process
of combining TensorFlow with ARCore was not further pursued.
3.1.6 Testing the ARCore and TensorFlow prototypes
The two most promising prototypes were the ARCore prototype and the TensorFlow one.
Because these could not be combined both of them would be tested in a small comparative
user study. This was done in order to get feedback from Beijer employees about what they
considered to be important. The TensorFlow prototype was able to recognize machines ef-
fectively and display static information about the machine, just like a regular application.
The ARCore prototype was able to present data and controls in a context-based way, which
hopefully would allow the users to more intuitively understand what information was related
to which machine or machine part. The purpose of this test was to get information about
who the actual end-users were, what features might suit better in a AR application than in
a Beijer display and how important did the test subjects think it was to be able to actually
scan a real machine versus scanning a 2D image of it.
Participants
The test subjects from this user study was employees from Beijer Electronics in Malmö and
the number of participants were six. The age range was between 34-58, the gender distribu-
tion can be seen in the figure 3.9. The test subjects roles varied from Business developer to
support engineer, so their technical competence was varied. The majority of the test subjects
had used a Beijer display before in different contexts.
293. Design and development
Figure 3.9: Gender distribution from first comparative test.
Test setup
The test subjects were first asked to fill out a survey about their age, gender, role at the
company and their past experiences with a Beijer display. Even though they would not be
testing a Beijer display it was important to know how the applications they were about to
test could function as a complementary interface to the Beijer display and how. After that
they got to try out both the ARCore prototype and the deep learning prototype, the order in
which the different test persons tried the prototypes varied. When testing the deep learning
prototype the test subjects were asked to scan the coffee machine just outside the room and
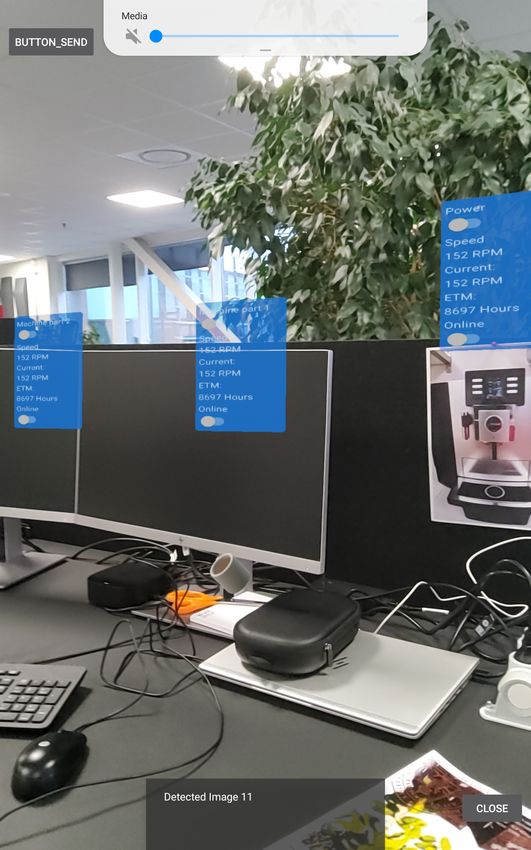
then send an email to maintenance using the application. When testing the AR prototype, the
test subjects were asked to scan a picture of the same coffee machine, interact with the menus
for the different machine parts and then use the application to send an email to maintenance,
as seen in figure 3.10.
After the tests were done the test subjects were asked to fill out a post-test survey about
their initial thoughts on the prototypes, if they could be useful and if not why, how easy were
they to use, is there any special feature they would like to see in the application and which
one they preferred. The scheduled time for one test session was 40 minutes, but the time to
finish a session varied between approximately 20-40 minutes, depending on the test subject.
Test results
The test subjects initial thoughts on the prototypes were that they were rudimentary at this
stage but that they could see the potential in both of them. Some test participants could not
find the menus which were hovering over machine part 1 and 2 while using the ARCore pro-
totype since there were no indicators to show the user that they were actually there. However
a majority of the test subjects agreed that the ARCore prototype was both easy to use and
that it would be useful to have context-based information instead of having to look through
the entire system which you would have to do in a Beijer display. Several test subjects men-
tioned that it would be valuable to get information and indications if an error had occurred
with a machine with the help of an arrow or a sign placed in the area of the error. A majority
of the test subjects also thought the deep learning application was useful and that they saw
the potential in it. The advantage being that no identifiers such as QR codes or images would
be required in order to recognize a machine and this saves the user time.
When asked which prototype the test subjects preferred, the majority answered that the
ARCore prototype was more interesting and that there was more to explore with context-
303.2 Development phase
Figure 3.10: Testing the AR prototype.
based information. A clear majority of the test subjects also agreed that the end-users who
could benefit from such an application would be service technicians who tend to a machine
maybe once a month or when a problem has occurred with it or operators who tend to the
machine on a daily basis. Then the context-based information provided by an AR application
could guide them towards the error very quickly or in an easy way provide the operators with
relevant reading of a machine without having to navigate through the Beijer display.
3.1.7 Phase summary
After examining the results from the user study in this phase it was decided to only move for-
ward with one prototype and that was the ARCore prototype. According to the test subjects
the most important and relevant thing was to examine how AR could provide value to the
end-user and how the application could function as a complementary interface to the Beijer
display.
3.2 Development phase
The goal of this phase is to improve the simple ARCore prototype into a more sophisticated
hi-fi prototype which works as a complementary interface to a Beijer HMI called X2 Control.
It should be able to control certain parts of a real world machine.
The machine used in the final test is the small electronic elevator shown in figure 3.11.
313. Design and development
Figure 3.11: Picture of the electronic elevator used in the final test
The elevator is controlled by a programmable logic controller (PLC) which handles the four
orange lamps, four red/green lamps and the motor moving a black square (the so called ”ele-
vator”) up and down. By changing certain bits in the PLC, external devices such as a Beijer
display can control the elevator. In this section, the development process of the ARCore pro-
totype will be explained and how the communication with the Beijer display and the elevator
works.
3.2.1 Development of hi-fi prototype
In order to create a hifi prototype which would satisfy the needs for this project there were
several things that had to be implemented, these are presented in this list.
• Remove the old menus and create controls to operate the lights and the elevator.
• Simulate an error with the elevator and provide the user with enough information and
guidance to solve the problem
• Allowing the application to communicate with the elevator and get updates about its
current state.
To start with the image of the coffee machine was replaced with an image of a qr-code,
this was done because the previous image might confuse users. It made no sense to scan a
picture of a coffee machine when the user should operate an elevator. Then the old menus
were replaced with button switches for each light and each switch was named after the floor
it represented. In order to control the elevator two buttons were placed hovering above the
elevator with the texts "Up" and "Down", this can be seen in figure 3.12 b.
After the controllers for the elevator had been implemented the focus shifted towards
the error handling part of the application. The first screen the user sees when the application
is opened up can be seen in figure 3.12 a.
32You can also read