CAN #TWITTER_TRENDS PREDICT ELECTION RESULTS? EVIDENCE FROM 2014 INDIAN GENERAL ELECTION
←
→
Page content transcription
If your browser does not render page correctly, please read the page content below
2015 48th Hawaii International Conference on System Sciences

        Can #Twitter_Trends Predict Election Results? Evidence from 2014 Indian
                                   General Election

          Aparup Khatua                  Apalak Khatua                      Kuntal Ghosh                  Nabendu Chaki
      Dept. of Comp. Sc. & Eng.        XLRI Xavier School of           Indian Statistical Institute,   Dept. of Comp. Sc. & Eng.
       Univ. of Calcutta, India         Management, India                    Kolkata, India             Univ. of Calcutta, India
      aparupkhatua@gmail.com             apalak@xlri.ac.in                kuntal@isical.ac.in             nabendu@ieee.org

                             Abstract                                 campaigning phase [1], [11]. Twitter is rapidly gaining
        Extant literature finds that twitter trends can               popularity in developing countries. There are roughly
    capture electoral sentiment. However, empirical                   33 million registered users in India [11].
    evidences are ambiguous in nature. Thus, this study                   This paper uses a new dataset from Indian context
    uses the context of 2014 Indian General Election to test          to explore the explanatory power of twitter for
    the predictive power of Twitter in a large and                    predicting 2014 Indian general election. We perform
    politically diversified country. We have analyzed                 both twitter volume as well as sentiment analysis.
    roughly 0.4 million tweets during the period March 15,            Broadly our analysis confirms previous findings but it
    2014 to May 12, 2014. We observe that tweet volume                also highlights that a nuanced understanding of
    as well as sentiment analysis can predict election                research context is extremely important for collecting
    results. We also find that sentiment scores can predict           data. Thus, predicting election results is challenging in
    changes in vote share. We note that in a multi-party              a large and politically heterogeneous country like India
    system the nationality of a party can be an important             where both national as well as regional parties (with
    factor. However, these results should be interpreted              limited political presence) participate in general
    with caution. We emphasize the relevance of contextual            election and election is a month long process.
    understanding for efficient data collection and
    analysis.                                                         2. Election Prediction & Twitter

                                                                          Election result prediction is a well-researched area.
    1. Introduction                                                   Studies from disciplines, like sociology or economics,
                                                                      attempt to predict election results through econometric
        Nowadays social media platforms, like Twitter, are            modeling of aggregate level economic or demographic
    generating enormous amount of user content data.                  data like GDP growth or unemployment. These studies
    Analysis of this user content data helps to identify              assume low GDP growth or high unemployment would
    small discrete events, like sentiment of an individual            enhance anti-incumbency effects. However, this
    user (which might be of less significance), but                   approach has limitations in capturing sentiments of
    aggregate level analysis of these discrete individual             individual electorate. Analysis of micro-blogging data
    sentiments can be an efficient indicator of collective            like tweet feeds addresses these shortcomings. Twitter
    trends [2]. Researchers are exploring these voluminous            allows its users to post/share and read short 140
    data for studying different socio-economic phenomena.             characters text messages known as tweets [15].
        Explanatory power of tweet feeds for predicting               Researchers are analyzing tweet texts for efficient
    election results is ambiguous in nature [4], [9]. For             forecasting of election results [3], [4], [10], and [15].
    example, mere volume analysis of political tweets                     Extant literature explores twitter trends for
    accurately predicted the election result in Germany               predicting election results in countries like Dutch [13],
    [15] whereas sentiment analysis failed to predict the             USA [3], [9], [10], Singapore [14], Germany [15] and
    2008 US Presidential election [3], [10]. In spite of              Pakistan [1]. However, these countries are mostly
    these mixed empirical evidences, use of social media              characterized either by a two-party system or a multi-
    data as a predictor of election results is becoming               party system with relatively low fragmentation. Indian
    popular among practitioners and researchers. Political            context is characterized by a multi-party system with
    parties, even in developing countries, make conscious             relatively high fragmentation (regional parties have
    efforts to manage social media properly during their              strong presence only in certain parts of the country)

1530-1605/15 $31.00 © 2015 IEEE                                1676
DOI 10.1109/HICSS.2015.202
[16]. A fragmented party system like India offers a               Election. There were few prominent regional parties
complex context for predicting election results through           like AITMC, CPI(M), BJD etc. in Eastern India;
twitter trends.                                                   AIDMK, DMK (Dravida Munnetra Kazhagam) etc. in
    In India administrative responsibilities are divided          Sothern India; BSP, Samajwadi Party, SAD
between central government and state governments. In              (Shiromani Akali Dal) in Northern India; and MNS
some states the ruling party is same both at the center           (Maharashtra Navnirman Sena), Shiv Sena in Western
and the state, whereas for others it might be different.          India (refer Table 1 for details).
Many a time state governments accuse central
government (if it is an opposing party) for skewed                       Table 1: Leading Parties in Indian Context
resource allocation when the state suffers due to low                       Party       Full Name              Remarks
economic development. There is a significant amount                                                       Newly formed party
of variations across states in terms of economic                    1     AAP       Aam Aadmi Party
                                                                                                          in 2012
development. Some states are industrially more                                      All India Anna        Regional ruling
developed than others, whereas some states are still                2     AIADMK    Dravida Munnetra      party in a Southern
agrarian in nature. Thus, using generic indicators of                               Kazhagam              state
                                                                                                          Regional ruling
economic progress in a regression model, to capture                 3     AITMC
                                                                                    All India Trinamool
                                                                                                          party in an Eastern
anti-incumbency effects, might be problematic for                                   Congress
                                                                                                          state
Indian general election. In a bipolar system the                                                          Regional ruling
opposition party will always enjoy the benefits of anti-            4     BJD       Biju Janata Dal       party in an Eastern
                                                                                                          state
incumbency effects. So, US presidential election boils                              Bharatiya Janata      National opposition
down to a sentiment analysis between Obama and                      5     BJP
                                                                                    Party                 party
Romney. This might not be the case in India. A                                      Bahujan Samaj
                                                                                                          Regional opposition
regional party can also take hold of anti-incumbency                6     BSP                             party in a Northern
                                                                                    Party
                                                                                                          State
sentiments instead of the opposition party at the
                                                                                    Indian National       Leading party of the
national level. In contrast, a national party can                   7     INC
                                                                                    Congress              ruling alliance
capitalize on anti-incumbency sentiments towards                                                          Left alliance (CPI:
regional state government. Conceptually anti-                       8     LEFT      CPI (Marxist) + CPI   Communist Party of
incumbency sentiments towards a state government                                                          India)
should get reflected only in state assembly election but                                                  Regional ruling
                                                                    9     SP        Samajwadi Party       party in a Northern
in reality it might influence the general election also.                                                  State
    The challenge becomes more intriguing, if we                                                          Newly formed party
further consider that Indian election is a month long               10    YSRCP     YSR Congress Party
                                                                                                          in 2009
process and political parties take up regional issues in                            Telangana Rashtra     Regional ruling
their campaigning considering these election phases.                11    TRS                             party in a Southern
                                                                                    Samithi
Hence, we argue that this paper not only uses a new                                                       state
dataset from Indian context but also it explores the
predictive power of twitter in a relatively complex and               In addition to these major parties, many smaller
diverse political setting with respect to prior studies.          registered unrecognized parties also participated in this
                                                                  election. 464 political parties contested in 2014
                                                                  parliamentary election. Interestingly 300-odd parties
3. Indian General Election 2014
                                                                  participated in less than five parliamentary
                                                                  constituencies out of a total of 543 constituencies.
     General Elections in India are normally held at an           However, leading parties like INC or BJP contested
interval of five years for 543 parliamentary                      from 464 and 428 seats respectively. Another
constituencies. Election Commission of India, an                  interesting aspect of Indian general election was the
independent body, conducted the 2014 General                      presence of independent candidates. There were 3235
Election in nine phases from 7th April to 12th May                independent candidates in 2014 general elections (i.e.
2014. This was the longest election in India’s history            roughly 6 independent candidates from each
and also one of the largest-ever elections in the world           constituency). In addition to this, Election Commission
in terms of eligible voters. The cumulative election              has started one additional option called NOTA (None
turnout was 66.4% which is the highest turnout in India           Of The Above). It allows an electorate to express his
till date.                                                        disapproval of all candidates. NOTA option has
     There were two major alliances: BJP led NDA                  secured 1.1% of total votes which is a significant
(National Democratic Alliance) and INC led UPA                    number in a multi-party system like India. On average
(United Progressive Alliance) in the 2014 General                 there were roughly 15 candidates in each parliamentary

                                                           1677
constituency. It is interesting to note that 40 odd parties, key political personalities, important
candidates contested from the Varanasi constituency. constituency etc. However, we realize that this static
Incidentally this was one of the constituencies from set of keywords fails to capture trending topics during
where prime ministerial candidate of NDA contested. this significantly long period of our data collection.
Some of the regional parties have strong presence Moreover, in a diverse country like India, trending
in their respective regions. For example, parties like topics are not same all over the country. So, we
AIADMK or BJD contested from 40 and 21 seats identified around 15 politically sensitive cities in India.
respectively. And AIADMK and BJD won 37 (out of Furthermore, we developed a program to identify top
40) and 20 (out of 21) seats respectively. In 2014 10 daily trending topics in twitter against particular
general election the third (AIADMK) and fourth WOIED (as previously identified). After removing
(AITMC) largest party, in terms of seat share, were duplicate trending topics (across 15 cities), we add
regional parties. There are many parties, like YSRCP, these trending topics (in addition to our core set of
RJD, TRS etc., which might look miniscule from keywords) in our search crawler for that particular day.
national perspective but they have a very strong Thus, our set of keywords for crawling tweet feeds was
regional presence. dynamic in nature. This helped us to capture temporal
A newly formed party called AAP participated in events/sentiments which might not get captured by a
this 2014 election. AAP came into existence in static set of keywords. Furthermore, to overcome the
November 2012 as a consequence of social rate limit of twitter API we used to run our search
movements. AAP created huge buzz in social media algorithm all throughout the day.
and that also got reflected in our analysis. Immediately
before this general election AAP won 28 out of 70
seats in 2013 Delhi Legislative Assembly Election and
formed a coalition government. In 2014 general
election AAP participated in 432 seats out of 543 total
seats. However, they could secure only four seats in
one Northern State. We are considering a party as a
regional party if their political influence is restricted to
limited geographic regions [16]. For brevity, we
restrict our discussion mostly to two major alliances
(i.e. NDA and UPA). The list of parties which we have
considered in this study is summarized in Table 3.
4. Data Collection & Data Cleaning
Data Collection: A prior study collected data by
using domain experts to identify core users through
manual interventions and identified another set of users
who were present in the network of these core users
[14]. Is this database a reliable sample to capture the
overall electorate sentiment of the country? Or it is a Figure 1: Heat Map of our Tweet Data
set of people with their own political biases. If this is
not a representative sample then it would be “like
going to a political rally and sampling the people Data Cleaning: We have used an exhaustive set of
gathered there, expecting that it will provide an keywords (as described earlier) for crawling purpose.
accurate representation of likely voters” [9]. As a consequence some tweets, especially if it contains
We have collected tweets posted by common more than one keyword, got extracted for multiple
people, political candidates, electronic media as well as times. Thus, we apply remove duplicate function on
political parties to overcome the above mentioned bias. tweet text filed. Moreover, we observe that many
We have collected our tweet data by using ‘twitteR’ [8] tweets are same in terms of text content except a small
and Application Program Interface (API) offered by URL portion. First, we remove these URLs from tweet
twitter. We have considered data three weeks prior to text then once again we apply the remove duplicate
phase 1 election to the end of phase 9 election i.e. function. Similar to prior study [1], we consider only
March 15, 2014 to May 12, 2014. We have identified a English tweets for our analysis and discard regional
set of keywords like names/abbreviation of political languages tweets. We find that locational data of
tweets are available for a small set of tweets. A heat
1678map of those tweets (refer Figure 1) indicates that our Step 2: If Count (for KS1) = 1 & Count (for KS2)
sample has no locational bias and it uniformly =0 & Count (for KS3) =1 then SELECT
represents the Indian electorate. However, the map of Step 3: If Count (for KS1) = 1 & Count (for KS2)
Kashmir portion (as generated by ggplot2 package of =0 & Count (for KS3) = 0 then REJECT
R) is debatable. Step 4: If Count (for KS1) = 0 & Count (for KS2)
>= 0 then REJECT
Table 2: Data Selection Methodology
KS KS KS Table 2 reports some illustrative examples to
Sample Tweets 1 2 3
AC OC
elucidate how we have identified relevant (RL) and
@** BJP n @Namo junk (J) tweets for our analysis. Our manual inspection
2 1 - S-1 RL
should do well in India of a small sub-sample confirms the effectiveness of
@**_** TRS Neither this algorithm. For example, our algorithm was
Merged With Congress efficient in identifying junk tweets related to US TRS
2 1 - S-1 RL with respect to actual TRS (refer table 2; R-3). We
Nor did any alliance with
them in Telengana observe that our algorithm was efficient and stringent
@** BJD in Odisha will
in rejecting junk tweets but in the process of removing
junk tweets it also rejected relevant tweets. So, there is
ensure 20 seats at 1 1 - S-1 RL
a trade-off. We feel that selecting relevant tweets is
minimum
more important for efficient prediction.
@*** Eagerly waiting for
1 0 1 S-2 RL
NaMo government
@**_** We pay into 5. Hypotheses
TRS(teacher retirement
1 0 0 R-3 J Prior studies claim that “the mere number of tweets
system) but teachers don’t
get social security mentioning a political party can be considered a
@**_** I love the Asian
plausible reflection of the vote share” and can have a
high predictive power [15]. Prior studies find that
Ball Jointed Dolls, but
1 0 0 R-3 J average deviation between tweet share and vote share
they are not easily
is insignificant [14], [15]. However, another study
available in UK #BJD
finds unacceptably high level of deviation or mean
@** Having a great time 0 1 0 R-4 J absolute error (MAE) and cautioned about the
at Varanasi
predictive power of social media data [9]. Broadly
KS – Keyword Set; AC – Algorithm Classification; OC – Our
Classification; S-2 - Select in Step 2; R-4 – Reject in Step 4; prior studies find that “co-concurrence of political
RL-Relevant; J- Junk. party mentions accurately reflected close political
positions between political parties and plausible
We generate a word frequency list for the entire coalitions” [9]. In other words, mere tweet volumes
dataset. Manually we have selected most relevant can be an effective indicator of election results. Thus,
(KS1) and contextual (KS2) keywords from this word we propose,
frequency list. We develop two mutually exclusive set H1A: Higher tweet share would lead to higher vote
of keywords KS1 (like AAP, AIADMK, BJD, BJP, share.
NaMo, RaGa etc.) and KS2 (like Amethi, Gujrat, India, H1B: Higher tweet share would lead to higher seat
Varanasi etc.). KS1 (roughly 430 keywords) mostly share.
comprises of key personalities, party names etc. Twitter sentiment analysis is gaining credibility
directly related to 2014 General Election and KS2 among researchers for capturing public opinions.
(roughly 200 keywords) is broadly contextual in nature However, researchers also highlight potential
like locations, states, politically sensitive constituency shortcomings of using simplistic bipolar sentiment
etc. Furthermore, we generate another word frequency analysis [5], [9]. A tweet might be in favor of a
list from tweets where count of KS1=1 and count of political party or it might be against a political party.
KS2=0. We have manually selected a set of keywords Thus, if we propose that tweet volume analysis is an
(i.e. KS3, roughly 220 keywords) which have efficient predictor of vote share then we are implicitly
absolutely no ambiguity in terms of relevance (like assuming that either all tweets are in favor of the party
abkibaarmodisarkar, aapwaveinkashi, NaMo, or the mix of tweets (in terms of favorable and
rahulgandhi etc.). Our algorithm for relevant tweet unfavorable tweets) is uniform across parties. These
selection and junk tweets rejection is as follows: are very strong and not so realistic assumptions. Thus,
Step 1: If Count (for KS1) >= 1 & Count (for KS2) researchers classify tweets into positive, negative and
>=1 then SELECT neutral sentiment. Broadly this stream of research
1679considers a standard lexicon, used by prior studies [6], 6. Data Analysis and Findings
[7] for sentiment analysis. A tweet might have a
positive or negative score (depending on the number of Prior studies find that “tweets containing the names
positive or negative words, as defined by the lexicon, of both candidates” can be misleading for forecasting
within the tweet). Even a tweet might be classified as analysis. So, they focus “only on tweets mentioning
neutral if it doesn’t has any positive or negative words, one candidate at a time” [9]. A tweet which has joint
or has equal number(s) of positive and negative words mention of two candidates/parties can be problematic
(then they cancel each other). This way the individual especially for sentiment analysis. For example, a tweet
score of each tweet can be calculated and a summation as follows:
of the same would give a cumulative sentiment score. #ABC said ‘Yes We Can’. Now XYZ would say to
Conceptually favorable sentiments regarding a political his party workers ‘No We Can’t’-
party would be a better indicator of their electoral Simplistic sentiment analysis would fail to
performance. Thus, we propose, categorize it properly and might consider it as a neutral
H2A: Higher sentiment score would lead to higher statement (due to presence of both Can and Can’t in
vote share. the same sentence) for both ABC and XYZ. However,
H2B: Higher sentiment score would lead to higher this tweet is positive for ABC and sarcastically
seat share. negative for XYZ. Thus, we discard tweets which have
We carefully observe the trend of prior state joint mention of two parties. For example, if a tweet
assembly or general elections in India. We focus on has any NDA related keyword like NaMo as well as
cases where a significant change occurs in terms of mention of any other keywords (related to other
wining seats with respect to previous election. parties) from the list of keywords provided in Table 3
Anecdotal evidences reveal that in India most parties then we consider it as a problematic tweet. Thus, we
have loyal voters and these voters maintain their define a tweet for NDA as: tweets which will have
loyalty even during not-so-favorable situation. Thus, a only NDA related keywords and there should not be
minor vote swing (i.e. change in percentage of votes) any keywords (which are related to other political
can lead to a significant change in terms of seat share. parties) from Table 3.
For example, in 2009 parliamentary election Congress
did significantly well with respect to their performance Table 3: Parties/Alliances & Analysis Keywords
in 2004 election. Congress won 61 more seats (with List of Keywords
respect to 2004 parliamentary election) but their vote NDA,BJP,LJP,advani,modi,#modi, narendra,
share went up by marginal 2% [12]. In the same #narendra, namo, ShivSena, TDP, navnirman,
1 NDA*
Thackeray, MNS, paswan, Shiromani, &
parliamentary election Communists faced one of their Akali.
worst defeats. They won just 24 seats in 2009 election UPA, NCP, Gandhi, Rahul, pappu, Sonia,
(with respect to 59 seats in 2004 election). Interestingly 2 UPA** Robert, Vadra, manmohan, Cong, RJD, lalu,
AITMC, a relatively newer party then, had displaced JMM, IUML, INC, raga, & congress.
Communists in West Bengal which was a Communist AAP, #AAP, AamAadmi, #AamAadmi,
3 AAP
Arvind, Kejriwal, AAAP, & yogendra.
bastion for many years. AITMC won 17 seats more 4 AIADMK AIADMK, Jayalalithaa, & amma.
than 2004 election though the vote share went up by 5 AITMC TMC, didi, Mamata, AITC, & trinamool.
marginal 1.4% [12]. Two years later Communist 6 BJD BJD,Naveen, & Patnaik.
(which was the ruling state government) had a 7 BSP BSP,Bahujan,& Mayawati.
landslide defeat during 2011 State Assembly Election 8 LEFT CPI(M), CPI, CPM, & Buddhadeb.
9 SP Samajwadi, mulayam, & akhilesh.
to AITMC. Communists managed to retain just 60 10 YSRCP YSRCP, Jagan & YSR.
seats (whereas they had 227 seats in the previous state 11 TRS TRS, Chandrasekhar, & telengana.
assembly election) out of 294 seats. Interestingly the JD(U), Nitish, Anna Hazare, Yeddyurappa, &
12 Others
drop in their vote share (48% in 2006 to 40% in 2011) karunanidhi.
* This was alliance between BJP (main opposition party), SS(ShivSena),
was not so drastic. These anecdotal evidences indicate TDP (Telugu Desam Party), LJP (Lok Janshakti Party) and SAD (Shiromani
that mostly voters are loyal in Indian context. We Akali Dal) and few other smaller parties.
argue that minor vote swing by not-so-happy electorate ** This was the alliance between INC (the ruling party), NCP (Nationalist
Congress Party), RJD (Rashtriya Janata Dal), JMM (Jharkhand Mukti
can play a crucial role for replacing the incumbent Morcha) and IUML (Indian Union Muslim League) and few others.
government. Sentiment scores can effectively capture
the mood of this not-so-happy electorate. Thus, we We observe that removing these kinds of tweets
propose, from our original dataset, following prior studies [9],
H3: Sentiment score would be proportional to [13], has improved the predictive power of our
change in vote share. analysis. Following extant literature [1], [14], [15] we
select a set of keywords like prime ministerial
1680candidate’s name, prominent leaders from ruling and multi-party scenario number of seats won has more
opposition parties, key political personalities. Details relevance in forming the government than vote share.
of these keywords are listed in Table 3. For example, a regional party (like BSP) from a larger
state might have decent vote share (4 %) but that might
Table 4: Percentages of Votes, Seats and Tweets not get reflected in number of seats won by them.
Raw However, a regional party (like BJD) from a relatively
Vote Seat Tweet Error Error
(%) (%)
Tweet
(%) 1 2 smaller state might not have significant vote share
(%)
(2%) in national context but they did fairly well in
(1) (2) (3) (4) (4-1) (4-2)
terms of seats won (20 seats i.e. 3.7% of all seats) in
NDA 0.36 0.60 0.51 0.47 0.11 -0.13 their respective region.
UPA 0.22 0.11 0.32 0.25 0.03 0.14 It is worth to note that the cumulative Raw Tweet
BSP 0.04 0.00 0.02 0.02 -0.03 0.02 percentage is 115% (Table 4, Column 3). We have
LEFT 0.04 0.02 0.01 0.00 -0.04 -0.01 collected roughly 0.6 million of raw tweets from 0.13
AITMC 0.04 0.06 0.02 0.01 -0.03 -0.05 million of unique users. As we discussed earlier, many
SP 0.03 0.01 0.01 0.01 -0.02 0.00
tweets mention two competing political parties. For
AIADMK 0.03 0.07 0.01 0.01 -0.02 -0.06
example, a tweet can be: ‘Party A is better than Party
YSRCP 0.03 0.02 0.01 0.01 -0.02 -0.01
B’. So, in Raw Tweet calculation this is getting
counted for both Party A and Party B. That is why the
AAP 0.02 0.01 0.22 0.20 0.18 0.20
cumulative figure of tweet share is more than 100% in
BJD 0.02 0.04 0.01 0.00 -0.01 -0.03
Column 3. Column 4 (of Table 3) reports the tweet
TRS 0.01 0.02 0.01 0.00 -0.01 -0.02
share of these leading parties after removing tweets
Total 0.85 0.95 1.15 1.00
(roughly 0.2 million tweets got discarded here) which
MAE 4.50% 5.99% have joint mention of two parties. Two leading
Source for Vote (%) and Seat (%): http://eci.nic.in/eci/eci.html
alliances NDA and UPA cumulatively account for
58%, 71% and 72% of vote, seat and tweet share
Table 4 reports party-wise overall outcome of the respectively in our sample. This indicates a duopoly
2014 general election, in terms of vote share (% of like situation in the competitive landscape of Indian
total votes), seat share (% of total wining seats out of politics.
543 seats) and tweet volumes (during the period March A simplistic mean average of error reveals that
15, 2014 to May 12, 2014). We have complied Table 4 tweet volume analysis has an error of 1.37% for vote
from Election Commission website as well as from our share and 0.42% for seat share. However, a careful
primary tweet data. Figures are approximated to two analysis of few parties like NDA, UPA and AAP
decimal places. Our final sample of 11 parties/alliances shows significant aberrations. Thus, we refrain from
(sorted in terms of vote share) considers vote share, making a conclusive statement. It is interesting to note
seat share as well as their shares in overall tweet feeds. that Error 2 (Tweet Share - Seat Share) for NDA and
Our final sample accounts for roughly 85% of total UPA are respectively -0.13 and 0.14 respectively.
votes and 95% of parliamentary seats. Because of their opposite signs they cancel each other
We observe that AAP (22%) had created enough and bring the error to a respectable 0.42%. This
buzz in social media. Similar to PTI (Pakistan average might not be the correct indicator for testing
Tehreek-i-Insaf) of Pakistan [1], prominent leaders of the predictive power of twitter. Refer [4] for a detailed
AAP had significant number of followers in social sites discussion. Thus, considering an absolute of error for
like Twitter. APP had hired digital marketing agency to calculating MAE (Mean Absolute Error) would be a
evaluate their social media performance [11] and better indicator if we want to test the predictive power
ensured greater interaction with the public. However, of tweet volume analysis [14], [15].
this did not get reflected in their overall election
performance in terms of vote share (2%) or seat share MAE = ∑ |Error of NDA| + |Error of UPA| + …
(1%). So, AAP is a significant outlier in terms of tweet
share and vote/seat share relationship in our study. This would not allow errors like -0.13 and 0.14 to
In contrary, there is a party like BSP which has nullify each other. We observe a MAE of 4.50% for
decent vote share (4%) but that did not get reflected in vote share and 5.99% for seat share. These are
tweet feeds (2%) as well as seat share (interestingly not unacceptably high. Thus, we argue that it is important
even a single seat won by them). Thus, to have a to have a cautious approach before considering MAE
holistic representation of Indian political statistics for justifying predictive power of twitter for
parties/alliances we consider all three relevant forecasting election results [4].
parameters: vote share, seat share and tweet share. In a
1681Next we employ Ordinary Least Square (OLS) supporting Party A. If we assume that these tweet feeds
regression technique following extant work. However, as a representative sample then the hypothetical vote
our sample size (11 data points) is a serious limitation share for Party A would be 0.0%. If another Party B,
for OLS analysis. It is difficult to have a bigger sample which has national presence, gets 900 positive tweets
in a single country study. Thus, prior studies [14] also as well as 1000 negative tweets. The sentiment score
use smaller sample size for national-level analysis. We for Party B would be also -100 but in reality 47% of
consider both tweet volume as well as sentiment score tweets are in favor of Party B.
in our OLS analysis for predicting vote and seat share. Parties which accounts for higher tweet share
We consider two Dependent Variables for H1 and would normally enjoy higher sentiment score. For
H2 as follows: Vote Share i.e. percentage of votes example, Party A, which has regional presence, getting
received by a political party/alliance (for H1A and 20 positive tweets and 10 negative tweets. Thus,
H2A) and Seat Share i.e. percentage of seats won by a cumulative sentiment score would be 10. If another
political party/alliance (for H1B and H2B). For Party B, which has national presence, might get 200
hypothesis 3 we consider the Changes in Vote Share as positive tweets and 100 negative tweets. Here
the difference between 2009 General Election and sentiment score for Party B is 100, which is higher than
2014 General Election. However, some of the alliance the score of Party A. However, 2/3rd tweets were
members of NDA and UPA were different in 2009 positive for both the parties. Hence, sentiment scores in
General Election. We have considered the same in our a fragmented political system should be interpreted
calculation. We have extracted data from ECI website with caution. Moreover, Tweet (%) is a normalized
for these variables. data whereas sentiment scores are not normalized in
We have two Explanatory Variables as follows: nature. To tackle this problem first we calculate the
Tweet (%) and Sentiment. We consider tweets which bipolar sentiment score (Sent_Score) using our
have mention of only one party. We have roughly 0.4 combined lexicon database. Next, we compute our
million tweets like this. Thus, Tweet (%) is calculated Sentiment variable as individual sentiment score of
as party related tweets divided by total 0.4 million each party/alliance divided by the cumulative
tweets. For example, if Party A receives 0.1 million sentiment score of all 11 parties/alliances. The standard
tweets, Tweet (%) for party A would be 0.25 (refer deviation came down to an acceptable range for
Table 4). Sentiment.
For sentiment analysis we have combined two Control Variable: Our study incorporates both
lexicons: Hu & Liu's opinion lexicon [7] and list of national as well as regional parties in terms of their
AFINN-111 [6]. Both these lists comprise of positive political presence. Thus, to capture this aspect we
and negative words. Lexicon [7] just classifies words develop a variable called Nationality. We computed
into positive and negative categories whereas the [6] Nationality of a party by dividing the number of seats
lexicon classifies words from strongly negative (a in which a party contested by 543 (i.e. the total number
score of -5) to strongly positive (a score of +5) of parliamentary seats). Thus, a national party/alliance
categories. We add all words, in the range +1 to +5 (-1 like UPA which is contesting all over India would have
to -5), from the lexicon [6] as positive (negative) words a score of 1.0 whereas a regional party like AIDMK
in Hu & Liu's opinion lexicon [7]. In other words, we (which contested only in 40 seats) would have a score
enhanced Hu & Liu's opinion lexicon [7] by of 0.07. However, we didn’t find any significant results
considering very positive (negative) of [6] as only for our Nationality variable in our OLS regression
positive (negative) words and added the same to [7]. analysis (for brevity we have not reported these results
We find that combining these two lexicons has in the paper). We carefully explore this issue and
improved the predictability power of our analysis. observe that parties like BSP or AAP contested from
However, we would like to caution that considering 503 and 432 seats respectively but these parties have
bipolar sentiment score for predicting election results limited political presence. For example, AAP won only
might be problematic in our context. In a two-party four seats in one north Indian state whereas BSP failed
system bipolar score can be a good proxy for electoral to secure a single seat in this election. Thus, the
sentiments but in a multi-party system with high variable Nationality lost its relevance because of few
fragmentation it might not be same. Volume of tweets aberrations like this. So we computed a new variable
would be higher for a national party (contesting in all called Nationality Dummy (Nat_Dum). Here we assign
seats) with respect to a regional party (contesting in a value of 1 for parties/alliances like NDA and UPA
limited number of seats). For example, 100 negative which have national presence and assigned a value
tweets for a Party A, which has regional presence, zero for all other parties with limited geographical
would lead to a sentiment score of -100. Here all tweet presence. This conceptualization is similar to prior
feeds are negative which indicates none of them are studies in Indian context [16].
1682Table 5: OLS Regression for predicting Vote Share and Seat Share
DV: Vote Share (M1 to M6) DV: Seat Share (M7 to M12)
M1 M2 M3 M4 M5 M6 M7 M8 M9 M10 M11 M12
Tweet (%) 0.66*** 0.24* 1.12*** 0.96*** 0.85* 1.07**
(0.10) (0.13) (0.14) (0.19) (0.42) (0.45)
Sentiment 0.40** 0.12 -0.42*** 0.68*** 0.41* -0.11
(0.15) (0.06) (0.12) (0.21) (0.21) (0.37)
Nat_Dum 0.27*** 0.18*** 0.24*** 0.33*** 0.05 0.22**
(0.03) (0.05) (0.03) (0.09) (0.16) (0.10)
Constant 0.03** 0.02 0.02* 0.04 0.02* 0.01 0.03 -0.00 0.00 0.02 0.01 -0.00
(0.01) (0.02) (0.01) (0.03) (0.01) (0.01) (0.04) (0.03) (0.04) (0.04) (0.03) (0.04)
R2 0.91 0.83 0.94 0.44 0.94 0.94 0.59 0.73 0.73 0.54 0.73 0.73
Adj. R2 0.90 0.82 0.93 0.38 0.92 0.92 0.55 0.70 0.67 0.49 0.66 0.66
F-Stat 94.2*** 45.4*** 63.1*** 7.2** 61.0*** 60.3*** 13.1*** 24.2*** 10.9*** 10.7*** 10.7*** 10.9***
VIF 1.0 1.0 4.13 1.0 1.45 4.83 1.0 1.0 4.13 1.0 1.45 4.83
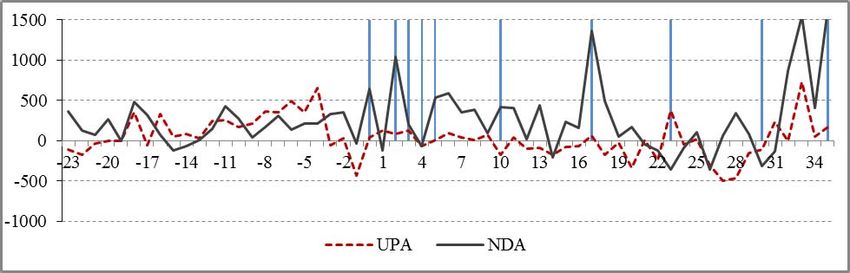
N=11; Two-tailed tests; Standard error in parenthesis ;*< 0.10 ** psignificant for most models. This indicates higher 49 seats out of 64. This confirms the negative spike in
sentiment score leads to higher vote and higher seat UPA sentiment score around day 26/27 in Figure 3.
share. But interestingly the coefficient of Sentiment for Next we explore the relationship between sentiment
predicting vote share becomes insignificant when we score and vote swing. We use two measures: non-
are incorporating the control variable Nat_Dum (Table normalized Sent_Score and normalized Sentiment.
5, Model 5). Thus, our OLS analysis weakly supports Coefficients for both variables are positive and
our Hypotheses H2A and H2B. statistically significant (Models 1 and 2 of Table 6).
However, findings are ambiguous when we are This result remains consistent even after controlling the
incorporating both Tweet (%) and Sentiment in our nationality of a party. Coefficients of Nat_Dummy are
forecasting model (Table 5, Models 6 and 12). Results negative and statistically significant (Models 3 and 4 of
for Tweet (%) remain consistent but coefficient of Table 6). This indicates that chances of vote swings are
Sentiment becomes negative and significant for vote lower for national parties (i.e. their vote share is stable)
share analysis (Model 6 of Table 5) and statistically and higher for a regional party in Indian context.
insignificant for seat share analysis (Model 12 of Table Overall our findings strongly support Hypothesis 3.
5). Problems related to sentiment score in a fragmented The sample size, for this analysis, is smaller because
political system, as we discussed earlier, might be a parties like YSRCP and AAP were not formed during
reason. However, this requires further exploration. We 2009 general election.
find significant multicollinearity issues when we
incorporate Tweet (%), Sentiment and Nat_Dum in the 8. Conclusions
same regression model (for brevity we have not
reported it). This study has made an attempt to answer whether
twitter trends can predict election results. Our research
Table 6: OLS Regression for Vote Swing setting in Indian context offers a complex political
M1 M2 M3 M4 landscape. For example, in India vote share might not
Sent_Score 0.00** 0.00*** be a good proxy for number of seats own. We have
(0.00) (0.00) highlighted contrasting cases of BSP and BJD. Thus, it
Sentiment 0.22** 0.48*** is important to test the explanatory power of twitter
(0.09) (0.07) trends in predicting vote as well as seat share
Nat_Dummy -0.13*** -0.13***
separately like [13]. Our findings broadly confirm prior
studies. However, it also illuminates few potential
(0.03) (0.03)
pitfalls of using simplistic kind of analysis like average
Constant -0.01 -0.01 -0.00 -0.00
errors versus absolute errors. Our contributions are in
(0.02) (0.02) (0.01) (0.01) number of fronts.
R2 0.46 0.46 0.89 0.89 First, our study has made an attempt to develop a
Adj. R 2
0.39 0.39 0.85 0.85 kind of template for data collection and cleaning which
F-Stat 6.0** 6.0** 24.4*** 24.3*** can be used by researchers for similar kind of work.
VIF 1.0 1.0 2.4 2.4
Our domain driven data mining model has significantly
N=9; Two-tailed tests; Standard error in parenthesis ;*< 0.10 improved our data collection and relevant tweet
**pfurther exploration in other contexts. Probably our Survey on Election Prediction using Twitter Data. arXiv
study is fraught with the pitfall of small sample size. preprint arXiv:1204.6441.
Fourth, we find that significant portion of voters
are loyal to a political ideology, sentiment score can be [6] Hansen, L. K., Arvidsson, A., Nielsen, F. Å., Colleoni, E.,
& Etter, M. (2011). Good friends, bad news-affect and
an effective predictor of vote swing. Our empirical virality in twitter. In Future information technology (pp. 34-
evidences support this proposition. 43). Springer Berlin Heidelberg.
A better sentiment analysis might help us to do a
fine grained analysis between vote share and changes [7] Hu, M., & Liu, B. (2004). Mining and summarizing
in vote share, which is a limitation of this study. We customer reviews. In Proceedings of the tenth ACM SIGKDD
demonstrate with few hypothetical examples why international conference on Knowledge discovery and data
sentiment scores might be misleading in predicting mining (pp. 168-177). ACM.
elections results in countries like India. In a large
country like India where election is a month long [8] Gentry, J. (2013). twitterR: R based Twitter client. R
package version 1.17, URL http://CRAN.R-
process it might make sense to consider a shorter project.org/package=twitterR
timespan for data collection. Probably a phase-wise
approach of data collection might be a better predictor [9] Metaxas, P. T., Mustafaraj, E., &Gayo-Avello, D. (2011).
of election results for regional parties. Broadly our How (not) to predict elections. In Privacy, security, risk and
paper confirms the explanatory power of twitter trends trust (PASSAT), 2011 IEEE third international conference
for predicting election results. However, future studies on social computing (SocialCom) (pp. 165-171). IEEE.
should juxtapose twitter trend analysis with
professional pollsters to conclusively answer whether [10] O'Connor, B., Balasubramanyan, R., Routledge, B. R.,
twitter trends can predict election results more & Smith, N. A. (2010). From Tweets to Polls: Linking Text
Sentiment to Public Opinion Time Series. ICWSM, 11, 122-
efficiently than other methods [5], [9], [15]. 129.
Acknowledgements: This publication is an outcome of [11] Patel, A. (2014) India's social media election battle,
the R&D work undertaken in the ITRA project of URL http://www.bbc.com/news/world-asia-india-26762391,
Media Lab Asia in the areas of Mobile Computing,
Networking and Applications (ITRA-Mobile). [12] Sadanandan, A. (2009). The parliamentary election in
India, April–May 2009.Electoral Studies, 28(4), 658-662.
8. References [13] Sang, E. T. K., & Bos, J. (2012). Predicting the 2011
Dutch senate election results with twitter. In Proceedings of
[1] Ahmed, Saifuddin, and Marko M. Skoric. (2014). My the Workshop on Semantic Analysis in Social Media (pp. 53-
name is Khan: the use of Twitter in the campaign for 2013 60).Association for Computational Linguistics.
Pakistan General Election. System Sciences (HICSS), 2014
47th Hawaii International Conference on. IEEE, 2014. [14] Skoric, M., Poor, N., Achananuparp, P., Lim, E. P., &
Jiang, J. (2012). Tweets and votes: A study of the 2011
[2] Bollen, J., Mao, H., &Pepe, A. (2011). Modeling public Singapore general election. In System Science (HICSS), 2012
mood and emotion: Twitter sentiment and socio-economic 45th Hawaii International Conference on (pp. 2583-
phenomena. In ICWSM. 2591).IEEE.
[3] Gayo-Avello, D. (2011). Don't turn social media into [15] Tumasjan, A., Sprenger, T. O., Sandner, P. G., &Welpe,
another 'LiteraryDigest' poll. Communications of the ACM, I. M. (2010). Predicting Elections with Twitter: What 140
54(10), 121-128. Characters Reveal about Political Sentiment. ICWSM, 10,
178-185.
[4] Gayo-Avello, D. (2012a). A meta-analysis of state-of-the-
art electoral prediction from Twitter data. arXiv preprint [16] Yadav, Y. (1999). Electoral Politics in the Time of
arXiv:1206.5851. Change: India's Third Electoral System, 1989-99. Economic
and Political Weekly, 2393-2399.
[5] Gayo-Avello, D. (2012b). "I Wanted to Predict Elections
with Twitter and all I got was this Lousy Paper"--A Balanced
1685You can also read