Canada Investment Mid-Year | 2020 - Real Estate ...
←
→
Page content transcription
If your browser does not render page correctly, please read the page content below

Canada Investment

                    Mid-Year | 2020
                                  Page 1
Table of

Contents
Economic Overview   3

Key Trends          6

Toronto             12

Montréal            17

Montréal (french)   22

Vancouver           27

Calgary             32

Edmonton            37

Ottawa              42

Contact             47

                         Page 2
Canada Investment Outlook | Mid-Year 2020
Economy Canadian
The health, policy, economic and financial disruption stemming from the
COVID-19 pandemic continues to create a fluid and evolving environment
for the real estate market. Although data from Q2 is providing greater
clarity about conditions and the short-term real estate outlook, there
remains significant uncertainty surrounding market dynamics and long-
term trajectories and, as a result, we will continue to monitor
Macroeconomic Overview fundamentals closely as the situation unfolds.
2020 brought an end to the longest market expansion since World War II. The timing
was not a shock - there has been a growing uneasiness over the past few years that Unemployment and GDP Growth
the end of the business cycle was approaching. What was less expected was the root 15% 12.30%
cause of the recession: a health pandemic that almost no one predicted a year ago.
10%
Ironically, a recession that felt long overdue had very little to do with underlying
economy. 5%
0%
Government-mandated lockdowns began in late March. Though they were
necessary to slow the spread of the pathogen, their economic, social, and cultural -5%
consequences were far-reaching and could be with us for some time. Almost
-10%
overnight, office buildings were emptied, malls and restaurants were closed, and Unemployment Rate
density – a city’s biggest asset – became its biggest liability. As discretionary -15% Annual GDP Growth -16.80%
spending plummeted almost by design, unemployment nearly doubled from 6.3% in
-20%
Q1 to 12.3% in Q2, and the economy contracted by nearly 17% year-over-year.
2015 2016 2017 2018 2019 YTD 2020
Global travel came to a halt, driving oil prices to their lowest on record.
The Canadian federal government implemented an ambitious program to support
the downturn. The COVID-19 Economic Response Plan set aside more than $115 Western Canadian Select vs. West Texas Intermediate
billion in fiscal spending to sustain households and businesses. While this plan WTI premium to WCS WTI, USD/Barrel
includes several initiatives, the programs that are most relevant to the real estate
WCS, USD/Barrel CAD / USD
industry are the Canadian Emergency Wage Subsidy (CEWS), the Canadian $80 $1.5
Emergency Response Benefit (CERB), and the Canadian Emergency Commercial Rent
Oil Prices (USd/Barrel)
$1.3
Assistance (CECRA) program. The CEWS program pays affected businesses 75% of $60
their payroll, up to a monthly limit of $3,400 per employee. The CERB payments are $1.0
CAD/USD
direct taxable monthly transfers of $2,000 for individuals who lost their job during the $40 $0.8
pandemic. The CECRA plan aims to reduce gross rent by 75% with the provincial and
federal government paying 50% and landlords covering the remaining 25%. $0.5
$20
$0.3
The plan was even more aggressive on the monetary policy side. The Bank of
Canada committed to an additional $150 billion in insured mortgage pools, as well as $- $-
$300 billion in liquidity support to the banking system to facilitate lending 2015 2016 2017 2018 2019 YTD 2020
throughout the economy. Deferrals were granted to nearly 15% of residential
mortgage holders, and the overnight lending rate was cut from 1.75% to 0.25% from Real Estate Investment by Market, %
January to March. The BoC’s policy moving forward has evolved from “lower for
longer” to “lower for longer and longer.” 100%
80%
While the health effects of the pandemic are felt most acutely in Canada’s urban
areas (especially Toronto and Montréal), the economic effects have hit nearly every 60%
sector and region. According to employment data from Statistics Canada,
“Accommodation and Food Services” companies have been the hardest hit, 40%
shedding nearly 410,000 jobs, while “Wholesale and Retail Trade” companies have
lost about 254,000 positions, and “Construction and Manufacturing” companies have 20%
lost nearly 270,000 jobs. The pandemic is dealing yet another blow to Alberta’s oil
0%
patch. With higher extraction and delivery costs relative to global competitors,
Canadian oil could lose even more market share as prices are expected to remain 2015 2016 2017 2018 2019 YTD 2020
deflated for some time. As prices have collapsed, 90% of Alberta’s oil rigs are Other GCA GEA NCR GTA GVA GMA
Source: JLL Research, BoC, Oxford Economics, StatCan
© 2020 Jones Lang LaSalle IP, Inc. All rights reserved. All information contained herein is from sources deemed reliable; however, no representation or warranty is made to the accuracy thereof.
Canada Investment Outlook | Mid-Year 2020
                                                                                                    Economy                                                   Canadian

Macroeconomic Overview
currently inactive and many won’t be recertified. Grain exporters in the prairies and                                             Canadian REITs: Change in Valuations by Sector
seafood exporters in the Maritimes have struggled as well.
                                                                                                                               Industrial Multifamily      Retail       Office      Healthcare Diversified
The implications on the use of real estate have been momentous. The widespread                                          0%
shift to online shopping is increasingly moving retail footprint from the showroom to
the warehouse, leading to a downsizing or repurposing of traditional retail space and                                -10%
an increase in demand for fulfillment space to accommodate the burgeoning e-
commerce sector. Office tenants are re-assessing their occupancy strategy,                                           -20%
balancing the increase in space needed to satisfy social distancing guidelines with
the decrease created by a broader remote work policy. Multifamily has seen robust                                    -30%
rent collection, yet there is uncertainty as to how this asset class will fare when CERB
                                                                                                                     -40%              Change: YTD
payments expire and immigration flows ebb. Hotels have been perhaps the hardest
hit asset class, and it is a matter of guesswork as to when occupancy levels will return                                               Change: Since 2/20 Market Peak
                                                                                                                     -50%
to pre-COVID levels. Some hotel owners are repurposing their buildings into
affordable housing or student housing on university campuses. Is this a short-term
fix or a long term evolution? Finally, the seniors housing sector continues to benefit                                         Canadian REITs: Q2 Rent Collections by Sector
from a compelling demographic thesis, but with so many operators under heavy
scrutiny during the pandemic, there could be important structural changes affecting                                  100%
this sector as well.                                                                                                  90%

So far rent collection through the pandemic has been strongest for the industrial and                                 80%
multifamily sectors, with REITs in these spaces having averaged 93% and 88%,                                          70%
respectively through Q2. They have also taken less of a hit on the public markets.
Office rent collection has been fairly high; however office REITs have been sharply                                   60%
penalized on the TSX. Cap rates for Class “A” downtown assets, which were far lower                                   50%
than industrial only a few years ago, are now essentially equal to industrial cap rates
nationally. Retail cap rates, both for enclosed and open air properties, have risen                                   40%
steadily over the past few years and will likely continue this trajectory.                                                       Multifamily         Industrial            Retail             Office

So far this year, investment volumes in Canada have reached about $16 billion, down
by about 20% from their pace a year ago. Buyers and sellers have been far apart on                                                             Average Sector Cap Rates*
                                                                                                                     7.0%
pricing; most sellers are well capitalized and unwilling to sell in a downturn or to offer
a “COVID discount.” The very logistics of touring assets has been a challenge, and                                   6.5%                                                                  Office: Suburban
contributed to friction in the marketplace. The resulting lack of comparables makes                                                                                                        Retail: Open Air
it even more difficult for groups to assess and agree upon value.                                                    6.0%
                                                                                                                                                                                           Retail: Enclosed
                                                                                                                     5.5%                                                                  Office: CBD “A”
Some critical tests await. The federal government is already shifting to deficit
management mode, with the CERB payments expected to be phased out in October                                                                                                               Industrial
                                                                                                                     5.0%
and the wage subsidies in December. Meanwhile the U.S. election looms with
important ramifications for Canada. A second term for President Trump means four                                     4.5%
more years of unpredictable relations with the U.S., while a Biden presidency could                                                                                                        Multifamily
see a continuation of protectionist trade policies and the return of U.S. opposition to                              4.0%
the Keystone XL Pipeline. Finally, the risk of a second wave of transmissions risks                                          2015       2016       2017       2018        2019         YTD
thwarting Canada’s recovery, and it is unclear whether the government could                                                                                                            2020
mobilize the same fiscal firepower.
                                                                                                                              * Based on averages across subtypes for Toronto, Vancouver, Montréal,
                                                                                                                              Ottawa, Calgary, Edmonton, Quebec City, and Halifax.

© 2020 Jones Lang LaSalle IP, Inc. All rights reserved. All information contained herein is from sources deemed reliable; however, no representation or warranty is made to the accuracy thereof.
Canada Investment Outlook | Mid-Year 2020
Economy Canadian
Debt Capital Markets Overview
On a per-capita basis, Canada’s caseload is lower than almost any other nation, and Canadian REIT: Equity and Debt Issuances
Canadian companies and households have relatively high cash reserves to get through
a downturn. Most economists are expecting a rebound beginning in Q3, and if $12 Equity Debentures Secured Mortgage Bonds
caseloads remain at a manageable level, we fully expect that buyers and sellers will be
eager to return to the market in the third quarter. $10
$8
This sentiment is echoed on the lending side as well. Moving into Q3, lenders are
CAD, Billions
increasingly open for business after largely halting new commitments in Q2. $6
Allocations continue to view multifamily, industrial, and essential retail (grocery- and
pharmacy-anchored) favourable, while lenders are reluctant to finance hotel and non- $4
core retail. Underwriting has been a challenge and therefore lending has been
$2
conservative; loan sizes and loan-to-value ratios have largely been reduced since
March. Acquisition lending activity has slowed commensurate with a slowdown in $0
overall investment activity. However, this has been offset by an increase in refinancing
activity by borrowers looking to take advantage of lower mortgage loan rates.
Requests for loan deferrals and forbearance have been commonplace since March,
though these requests have tapered going into Q3. Some lenders provided deferrals 10-Yr GoC Bond vs. Commercial Mortgage Spread
across the board while others were more bespoke, however, a disproportionate
amount of requests were made for retail and hotel assets. Deferrals are generally 5% 10-Year GoC Yield
being granted on the condition that they be repaid over the remaining term of the 10-Yr Commercial Mortgage Spread
loan. 4%
Yields have moved around quite a bit since the beginning of the year. Using the 10- 3%
year GoC bond as a reference, the rate decreased ~70 bps or 40% through the first 8
months of 2019 but have since bounced back a bit since September. 10-year 2%
commercial mortgage spreads for class A properties jumped from 170-180 basis points
end of 2019 to 250 – 275 basis points at the end of June 2020, offsetting some of the 1%
drop in the GoCs during this period. Conversely, banks pushed cost of funds higher in
Q2 due to fear of liquidity insufficiency but kept spreads stable. Debt funds remained 0%
steady in overall interest rates.
1Q16
2Q16
3Q16
4Q16
1Q17
2Q17
3Q17
4Q17
1Q18
2Q18
3Q18
4Q18
1Q19
2Q19
3Q19
4Q19
1Q20
2Q20
Leading up to the pandemic, Canadian REITs were flush with cash and had fortified
their balance sheets, allowing them borrow on much more favourable Bank of Canada Yield Curve: Quarterly Average
terms. Consequently, REIT fundraising reached record levels in 2019, with over $7 4%
billion in equity issuances and over $4 billion in debentures. Given strong property
Q4 2018 Q4 2019
fundamentals and the likelihood of an accommodative interest rate context, we expect
REITs to continue their strong performance in 2020, albeit with the potential for less 3% Q1 2020 Q2 2020
lofty returns. After the yield curve was inverted for much of 2019, the downturn and
corresponding monetary policy action have pushed short term yields down in the 2%
order of 25% - 35%, while 10-year notes have fallen by around 100 basis points since
the end of 2019 and are now trading around 50-60%. Five-year CMBS are trading at a 1%
spread of around 80-90 basis points while 10-year CMBS are in the range of 105-120
bps. While lenders remain concerned about the actual economic impact of COVID-19,
the length of the recovery, and tax effects on individuals and company, in general the 0%
market is recovering from the lending freeze we were seeing at the end of March. 6M 1YR 2YR 3YR 5YR 7YR 10YR 20 YR
Source: JLL Research, Bloomberg, BMO
© 2020 Jones Lang LaSalle IP, Inc. All rights reserved. All information contained herein is from sources deemed reliable; however, no representation or warranty is made to the accuracy thereof.
Key Trends                                                                                       Canada Investment Outlook | Mid-Year 2020

    Office                                                                                                           Historical Office Investment
                                                                                             $25
•   Vacancy Expected to Rise: We will likely see vacancy tick up across
    the board due to a mix of factors: uncommitted new deliveries,                                       Qtr1
    backfilling space from relocations, and an increase in sublease                                      Qtr2
    availability of over 1.3m s.f. since shutdowns began.                                    $20         Qtr3
•   First Cap Rate Increase in Ten Years: Cap rates are up across the                                    Qtr4
    board, even in core markets like downtown Toronto and Vancouver,
    as investors attempt to quantify cash flow degradation from certain                      $15

                                                                             CAD, Billions
    tenants. However, given the low deal volume since the pandemic,
    this apparent cap rate hike is based on a small sample size and Q3
    will provide more clarity.
                                                                                             $10
•   Investment Volumes Down: With buyers and sellers unable to agree
    upon value, office has seen investment volumes fall by 50% from a
    year ago, and by 60% from its five-year H1 trend.
                                                                                             $5
•   The Great Work-From-Home Experiment: Widespread remote work
    policies mostly exceeded expectations in the first few months of the
    pandemic. However, after several months we are seeing fatigue set
    in as companies and individuals are starting to see the costs – most                     $0
    notably deterioration in knowledge spillover, collaboration, training,                           2011 2012 2013 2014 2015 2016 2017 2018 2019 YTD
    onboarding, and client interaction. Nevertheless, employers are                                                                               2020
    likely to allow more flexible remote working policies moving forward.
•   De-densification: Counteracting the downsizing effect of remote
    work has been the upsizing effect of office de-densification, as
                                                                                                   Source: RCA, RealNet , Gettel Network, Commercial Edge, CoStar.
    tenants are looking to provide more space per employee to comply                               All transactions > $5m, Direct and Entity Level
    with social distancing guidelines. The office environment was seeing                           Excludes residential lots and residential occupier purchases
    a move towards de-densification before COVID; the pandemic                                     Market data as of latest available
    accelerated this trend.
Key Trends                                                                                        Canada Investment Outlook | Mid-Year 2020

    Multifamily                                                                                                    Historical Multifamily Investment

•   Multifamily Remains Real Estate Darling: Liquidity has remained                           $10
    strong for the multifamily sector across Canada, reaching $3.4b in                                      Qtr1
                                                                                              $9            Qtr2
    the first half of 2020 and outpacing all other asset classes.
    Investment volumes were just shy of their 2019 totals at this point in                                  Qtr3
                                                                                              $8
    the year, but they were above the sector’s five-year average.                                           Qtr4
•   Multifamily Cap Rates the Lowest of Any Asset: Cap rates for                              $7
    multifamily assets are significantly lower than any other asset class
                                                                                              $6

                                                                              CAD, Billions
    in Canada. In all major markets average multifamily cap rates are
    around 100 basis points lower than office or industrial. With rent                        $5
    collection generally in the range of 92% - 99% depending on the
    owner, multifamily is proving its resilience in a downturn.                               $4
    Consequently, vendors are offering no “COVID discount” on pricing.
                                                                                              $3
•   Distributed Urbanization: Suburban home sales are up across
    Canada’s major cities while condo sales and prices are lagging. It is                     $2
    too early to call this a trend, but an early reading would suggest that
                                                                                              $1
    the suburbs will benefit from COVID-related shifts in housing
    preferences. This combined with more remote work policies and the                         $0
    growth of suburban transit nodes will only intensify a model of                                   2011 2012 2013 2014 2015 2016 2017 2018 2019 YTD
    urbanization that is more distributed throughout the metropolitan                                                                              2020
    area, rather than concentrated in the central CBD.
•   Critical Q3 and Q4 Await: The multifamily sector has benefitted
    greatly from the various COVID response stimulus payments over the
    past few months. With many of these benefits expected to be                                     Source: RCA, RealNet , Gettel Network, Commercial Edge, CoStar.
    phased out in the fall, we could see a slight lift in vacancies and                             All transactions > $5m, Direct and Entity Level
                                                                                                    Excludes residential lots and residential occupier purchases
    flattening rental growth across geographies.
                                                                                                    Market data as of latest available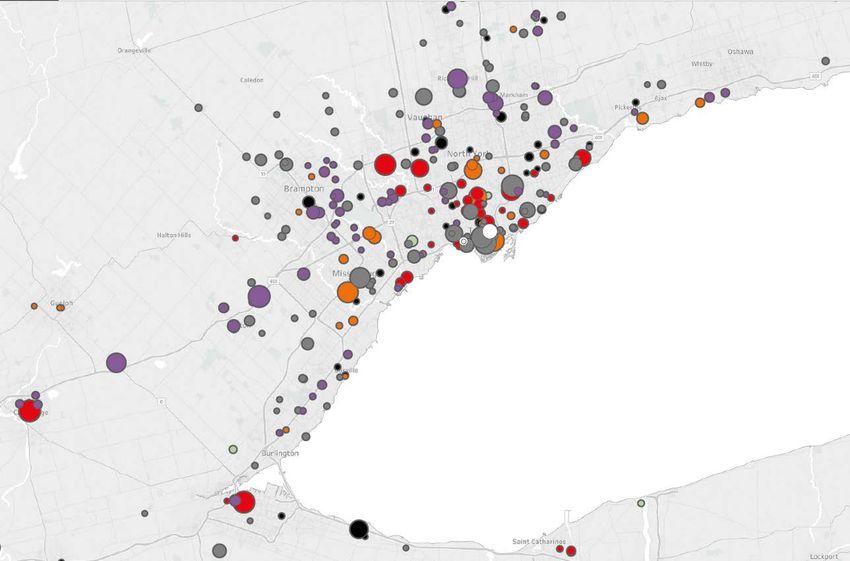
Key Trends                                                                                        Canada Investment Outlook | Mid-Year 2020

    Retail                                                                                                          Historical Retail Investment

•   Retail Investment Volumes Fall Sharply in 2020: Retail investment                         $18         Qtr1
    sales reached only $1.5b in the first half of the year, the lowest two-                               Qtr2
                                                                                              $16
    quarter performance in almost a decade. Most retail landlords have                                    Qtr3
    turned their attention to managing their assets and working out rent
                                                                                              $14         Qtr4
    deferral agreements with tenants, and they are postponing any new
    acquisitions or developments to preserve capital.                                         $12

                                                                              CAD, Billions
•   Mixed Reviews on CECRA: Retail landlords have leveraged the
    Emergency Commercial Rent Assistance Program more than any                                $10
    other asset class, mostly using the program for smaller, independent
    retailers. However, participation has varied widely depending on the                      $8
    owner and there remains concern about a lack of clarity on key
    details in the program. Many retail landlords have instead opted for                      $6
    a case-by-case approach to rent deferrals in lieu of CECRA.
                                                                                              $4
•   E-commerce and Grocery an Emerging Force: E-commerce sales in
    Canada are up 120% over 2019, even though national retail sales are                       $2
    down by over 30%. The profound shift to online buying is prompting
    even small retailers to develop omnichannel distribution systems.                         $0
    Where possible, retailers are converting brick-and-mortar locations                               2011 2012 2013 2014 2015 2016 2017 2018 2019 YTD
    to last-mile fulfillment centres, also known as “dark stores.”                                                                                 2020
•   COVID Further Segments Retail Industry: Retail that is anchored by
    grocery, pharmacy, and home improvement has performed
    markedly better than enclosed retail during the pandemic. This is
    reflected in cap rates and pricing, which have been stronger for these                          Source: RCA, RealNet , Gettel Network, Commercial Edge, CoStar.
    centres relative to enclosed assets.                                                            All transactions > $5m, Direct and Entity Level
                                                                                                    Excludes residential lots and residential occupier purchases
                                                                                                    Market data as of latest available
Key Trends                                                                                   Canada Investment Outlook | Mid-Year 2020

    Industrial                                                                                              Historical Industrial Investment
                                                                                           $12
•   Investment Volumes: Canada has seen $2.9b in industrial investment                               Qtr1
    sales halfway through the year, which is actually ahead of the H1                                Qtr2
    totals from a year ago. While vacancy across Canada has ticked up                      $10       Qtr3
    modestly in the second quarter, the pandemic has in many ways
                                                                                                     Qtr4
    validated the industrial investment thesis.

                                                                           CAD, Billions
•   Strong Rent Collection: Industrial REITs (including industrial                         $8
    portfolios of diversified REITs) reported rent collection of
    approximately 88% in the second quarter. The remainder was split
    between CECRA subsidized rents and other deferral arrangements                         $6
    agreed upon privately between the tenant and landlord. There was
    minimal falloff in collections from large bay tenants; much of the
    degradation has been attributed to small- and mid-bay tenants.                         $4

•   Just in Time Case Supply Chains: Distributors are reporting carrying
    higher inventories in their warehouses to avoid getting buried with                    $2
    order backlogs. In many cases – especially for medical and personal
    protective equipment – there is a shift in focus away from cost
    efficiency and towards redundancy.                                                     $0
•   Supply Chain Re-Shoring : While much has been made of a potential                             2011 2012 2013 2014 2015 2016 2017 2018 2019 YTD
    re-shoring of manufacturing jobs back to the domestic front, the                                                                           2020
    actual economics of this – including record high rents and record
    low vacancy in Canada – would make this a challenge.

                                                                                             Source: RCA, RealNet , Gettel Network, Commercial Edge, CoStar.
                                                                                             All transactions > $5m, Direct and Entity Level
                                                                                             Excludes residential lots and residential occupier purchases
                                                                                             Market data as of latest available
Key Trends                                                                                         Canada Investment Outlook | Mid-Year 2020

    Alternative Assets                                                                                    Historical Alternative Assets Investment
                                                                                                $4.5
•   Senior Housing under the Microscope during COVID: We want to                                            Qtr1
    recognize the efforts of front-line staff at independent living, assisted                               Qtr2
                                                                                                $4.0
    living, long term care, and other seniors housing facilities - few                                      Qtr3
    people have a more challenging job during the pandemic.                                     $3.5        Qtr4
    Outbreaks in homes in Quebec, Ontario, and British Columbia have

                                                                                CAD, Billions
    led to government intervention. Despite these struggles, Canada’s                           $3.0
    seniors housing sector has a waitlist of over 38,000 people and is well
    positioned to deliver these critical services to a demographic cohort                       $2.5
    that will grow sharply over the next 10-20 years.
•   Surging Demand for Data Centres: Increased bandwidth demand                                 $2.0
    from households and companies is generating a surge in demand for
    data centre capacity. Of all REIT sectors listed on global exchanges,                       $1.5
    data centres are the only ones whose valuations exceed pre-COVID
                                                                                                $1.0
    levels.
•   Investors Eye Production Studios: Film companies were already                               $0.5
    accounting for a small but growing share of absorption in urban core
    industrial markets, particularly in Toronto and Vancouver. With so                          $0.0
    many people relying on home entertainment during COVID and                                          2011 2012 2013 2014 2015 2016 2017 2018 2019 YTD
    potentially beyond, we can expect even more demand for these                                                                                     2020
    spaces, both from a user as well as an investor perspective.

                                                                                                  Source: RCA, RealNet , Gettel Network, Commercial Edge, CoStar.
                                                                                                  All transactions > $5m, Direct and Entity Level
                                                                                                  Excludes residential lots and residential occupier purchases
                                                                                                  Market data as of latest available
YTD Foreign Buyer Pool by Origin
$16B
Total investment volume, YTD 2020 Canada
95% United
States
2.6%
Sweden
0.2%
Singapore
0.2%
Rest of World
0.3%
Undisclosed
2%
Edmonton
$ 1.0B
Vancouver
$ 2.3B Calgary
$ 890M Ottawa
$ 730M
Montréal
Toronto
$ 2.8B
$ 5.5B
Real Estate Investment Volumes by Asset Class
Multifamily Land
$60
Hotel Industrial
Office Retail
$50 Alternative Assets Buyer and Seller Profile, YTD 2020
CAD, Billions
$40 User
$30 Public
$20 Private
$10 Pension Fund
$- Fund Manager Seller
2011 2012 2013 2014 2015 2016 2017 2018 2019 YTD Buyer
2020 Foreign
Source: RCA, RealNet , Gettel Network, Commercial Edge, CoStar.
All transactions > $5m, Direct and Entity Level
$0 $1 $2 $3 $4 $5 $6 $7 $8 $9
Excludes residential lots and residential occupier purchases
Market data as of latest available CAD, BillionsToronto Canada Investment Outlook | Mid-Year 2020
Toronto
 Canada Investment Outlook | Mid-Year 2020
Historic Real Estate Investment by Sector Disclosed Buyer and Seller Pool, YTD 2020
Multifamily Land
$25 Hotel Industrial User
CAD, Billions
Office Retail
$20 Alternative Assets Public
$15 Private
Pension Fund
$10
Fund Manager
$5 Buyer
Foreign Seller
$0
2015 2016 2017 2018 2019 YTD 2020 $0.0 $0.5 $1.0 $1.5 $2.0 $2.5 $3.0 $3.5
CAD, Billions
Toronto Buyer Domicile: YTD 2020 Source: RCA, RealNet , Gettel Network, Commercial Edge, CoStar.
All transactions > $5m, Direct and Entity Level
Excludes residential lots and residential occupier purchases
Canada Rest of the world Market data as of latest available
99% 1%
Multifamily Office
Land Retail
Hotel Alternative Assets
Industrial
* Higher point size represents
larger deal sizeToronto Canada Investment Outlook | Mid-Year 2020
General Historical Office Investment and Price PSF
Total Investment
• Investment sales in the GTA reached $5.5b for the first half of 2020,
Avg. PSF: Downtown Class A
about half the pace of the previous three years. The most heavily $10 Avg. PSF: Suburban Class A $900
traded property type was development land, with $1.7b in liquidity. $9 $800
Avg. Sale Price PSF
We should point out that most 2020 sales are based on agreements
$8 $700
reached before COVID, so the full impact on the investment market is
CAD, Billions
only beginning to be reflected in the data. $7
$600
• There is ample appetite on the buyer side, especially from private $6
$500
groups who see the downturn as an opportunity to gain a foothold in $5
Toronto’s highly competitive investment market. However owners are $400
$4
reluctant to sell, as many are confident that pre-COVID values will be $300
$3
restored at some point. At any rate, many owners are focused less on $200
portfolio culling than on asset management, as they reconfigure their $2
spaces to comply with social distancing guidelines and work with $1 $100
tenants on rent collection agreements. $- $-
• According to Oxford Economics, unemployment in the GTA shot up 2015 2016 2017 2018 2019 YTD 2020
from 6% to 13.8% in the second quarter. The region shed nearly
500,000 jobs with the service and hospitality sector being the hardest Office Net Rents and Vacancy
hit. Most analysts are forecasting a rebound that will begin in the third
Average Net Rent, Downtown
quarter, however this ultimately depends on the continuation of
Average Net Rent, Suburbs
federal stimulus programs and the trajectory of the pandemic. $40 20.0%
Total Vacancy Rate, Downtown
• The Ontario PC government has introduced measures that would $35 Total Vacancy Rate, Suburbs 17.5%
expand the province's power to expropriate property and reduce Avg. Rent (SF/Year)
$30 15.0%
requirements for environmental approvals - a move intended to speed
Vacancy Rate
up the process of infrastructure building. $25 12.5%
Office $20 10.0%
$15 7.5%
• Office investment volumes reached just $790m through the first half of $10 5.0%
the year, down almost 70% from the same period in 2019. With so
much uncertainty surrounding tenant footprints, buyers and sellers $5 2.5%
have been too far apart in their underwriting to come to an agreement $- 0.0%
on pricing, and consequently few deals have gotten done. 2015 2016 2017 2018 2019 YTD 2020
• The market recorded substantial negative absorption in Q2,
overwhelmingly driven by smaller vacating tenants in the downtown
Office Cap Rates
submarket. Downtown vacancy jumped from 1.9% to 3.2%; while this
is the largest quarterly jump in vacancy in many years, Toronto's Avg. Cap Rate: Downtown Class A
downtown remains one of the tightest in the world. 8% Avg. Cap Rate: Suburban Class A
7% GoC 10-yr Yield
• Downtown cap rates rose on average by 20 basis points while
suburban cap rates held steady, perhaps reflecting improved 6%
sentiment for spacious suburban offices. Asset pricing on a per- 5%
square-foot basis reflected this, with downtown sales falling to under 4%
$800 psf and suburban office holding steady at around $360 psf.
3%
• Landlords are generally reluctant to lower rents, as they are confident
2%
that the downturn will not be as pronounced in Canada’s largest
market. As a result, average direct net rents were up both downtown 1%
as well as in the suburbs. 0%
• The largest sale transaction in Canada to happen during the pandemic 2015 2016 2017 2018 2019 YTD 2020
this year was BentallGreenOak’s acquisition of Toronto’s Waterfront Source: JLL Research, JLL REIS, Altus ITS, Altus Realnet, Real Capital Analytics
Innovation Centre from Menkes at a price of $250m, or $526 psf. All transactions > $5m, including entity-level
© 2019 Jones Lang LaSalle IP, Inc. All rights reserved. All information contained herein is from sources deemed reliable; however, no representation or warranty is made to the accuracy thereof.
Page 14Toronto Canada Investment Outlook | Mid-Year 2020
Multifamily Multifamily Investment Volumes and Cap Rates
• With nearly $670m in total sales in the first half of the year, Toronto’s Total Investment
Avg. Cap Rate: Downtown
multifamily sector has held up fairly well. Investment volumes will $4 6%
Avg. Cap Rate: Suburbs
likely fall short of the record-breaking levels seen in 2018 and 2019, but GoC 10-yr Yield 5%
they are on pace with the 5-year market average. Generally speaking,
$3
CAD, Billions
there has been minimal cap rate movement compared to pre-COVID. 4%
Avg. Cap Rate
• Rent collections for institutional landlords have hovered around 95%,
supported in no small part by the CERB payments and a highly $2 3%
inelastic demand. With rents soaring, tenants have a strong incentive 2%
to stay in their current units or they risk facing sharp rent hikes. $1
• The Ontario government issued a moratorium on apartment evictions 1%
beginning in March, which is set to expire on August 1st. This is setting $0 0%
up a clash between landlords and tenant advocacy groups that has 2015 2016 2017 2018 2019 YTD 2020
been brewing throughout the pandemic.
• The earliest readings from the Q2 data are showing some evidence of a Multifamily Sale Price Per Suite and Vacancy
shift in housing preferences away from the city and toward the
suburbs. Studies by Urbanation and Padmapper indicate that Toronto $400 4%
Avg. PPU, Downtown
multifamily vacancy continues to inch up from the 1.5% cited by CMHC
$350 Avg. PPU, Suburban
last fall, towards 1.8% as many renters leave the city to move back in
Vacancy 3%
CAD, Thousands
with parents or to move to a smaller town. June sales for single family
$300
Vacancy Rate
detached homes in the 905 suburbs were up 10% over a year ago,
while home sales in the city were down by 8%. Condominium sales $250 2%
were down by 13% across the GTA.
• Nearly 13,500 rental apartment units are under construction in the $200
GTA, the highest level of rental construction in nearly 40 years. 1%
However, new construction is being delayed during the pandemic, $150
which will benefit incumbent multifamily owners.
$100 0%
2015 2016 2017 2018 2019 YTD 2020
Retail
Retail Investment Volumes and Cap Rates
• Toronto’s retail market has seen just $438m in sales through the first
half of the year – the lowest two-quarter total since 2012. There have $4.0 8%
Total Investment Regional Malls
been no GTA transactions this year worth more than $30m. $3.5 Power Center Food Anchored Strip 7%
• Retail owners are mostly looking to sell product off-market, preferring GoC 10-yr Yield
to avoid reputation damage if pricing turns out to be underwhelming. $3.0 6%
However, we anticipate a busy second half of the year as institutional
$2.5 5%
CAD, Billions
Avg. Cap Rate
owners look to generate cash flow by liquidating retail assets.
• Grocery- and pharmacy-anchored retail are proving their worth $2.0 4%
throughout the pandemic, with sales at or even above normal levels in
some cases. Rent collection for this segment of the market is $1.5 3%
estimated at 85 - 90%, compared to sub-70% for retail in general.
$1.0 2%
Collections from smaller retailers have exceeded expectations in many
cases, with many shopowners paying their operating expenses out of $0.5 1%
pocket to avoid losing their location or taking on debt.
• Retail property owners and tenants are organizing against the city's $0.0 0%
rapidly rising property taxes, which are based on Highest and Best Use 2015 2016 2017 2018 2019 YTD 2020
and often penalize under-utilized properties. Some retail tenants
claim that taxes make up between 50-70% of their monthly costs. Source: JLL Research, Altus ITS, CMHC
© 2019 Jones Lang LaSalle IP, Inc. All rights reserved. All information contained herein is from sources deemed reliable; however, no representation or warranty is made to the accuracy thereof.
Page 15Toronto Canada Investment Outlook | Mid-Year 2020
Industrial Industrial Investment Volumes and Price PSF
$4.5 Total Investment $220
• Industrial investment sales totaled approximately $855m through the
first half of the year, putting the sector on track for its slowest year $4.0 Single Tenant
$200
since 2012. On a positive note, industrial has outperformed the other $3.5 Multi Tenant
CAD, Billions
major asset classes during the pandemic and continues to show its
resilience with strong fundamentals in a downturn. $3.0 $180
Avg. Price PSF
• Vacancy rose by 10 basis points to 1.3% while availability rose 40 basis $2.5
$160
points to 2.8% since Q1. Most of the spaces that were vacated are $2.0
small and medium bay warehouses occupied by tenants serving
smaller retailers. Nonetheless, these metrics remain only slightly $1.5 $140
higher than the historic lows the market was experiencing last quarter, $1.0
while average asking rents have continued to rise. $120
$0.5
• There continues to be a severe shortage of available space in the mid
and large bay segments as retailers scramble to shore up their $0.0 $100
distribution networks and demand by e-commerce and online grocery 2015 2016 2017 2018 2019 YTD 2020
users adds to an enormously competitive landscape. Developers have
completed over 4.8m square feet of product this year; however, over Average Industrial Net Rent and Vacancy
90% of this space is either pre-leased or owner occupied, perpetuating
$10 Avg. Rent 5%
the supply shortfall in this segment of the market.
$9 Avg. Vacancy Rate
• Summit REIT was the buyer on both of the GTA’s priciest industrial
assets this year. The REIT acquired Cochrane Business Park from PSP $8 4%
for $45m ($197 psf) and a cap rate of 3.43%, and subsequently Avg. Net Rent, sf/yr $7
completed a sale and leaseback with Kubota Canada for $40m.
Vacancy Rate
$6 3%
• To the dismay of industrial buyers, the market is not offering much of a $5
discount in the wake of the pandemic. While transaction volume has
$4 2%
been low, completed transactions have indicated very little cap rate
movement both for single-tenant and for multi-tenant product. $3
Pricing on a per-square-foot basis for quality product has been flat $2 1%
since Q4 2019 on average, and is expected to trend upwards as the $1
economy rebounds.
$- 0%
Alternative Assets 2015 2016 2017 2018 2019 YTD 2020
• Alternative assets have netted $960m in investment sales this year, Historical Industrial Cap Rates
driven by two large transactions. TC Energy sold its Halton Hills
7%
Generating Station to OPG for $750m, and Summit REIT completed a
share sale of Data Centre II in Richmond Hill to its development and 6%
operating partner Urbacon for $80m.
5%
• After COVID-19 outbreaks were discovered in some senior homes
around the GTA, the Ontario government has stepped in to oversee 4% Single Tenant
management of a few homes. Nevertheless, we are confident that Multi Tenant
3% GoC 10-yr Yield
these operators will overcome these challenges and this intervention
will be temporary. 2%
• SmartCentres REIT is partnering with Revera Living and Penguin Group
1%
to build, own, and operate four retirement living residences in and
around the GTA. They are also partnering with SmartStop Self Storage 0%
to build out a self-storage portfolio worth an estimated $200m. 2015 2016 2017 2018 2019 YTD 2020
• Revera Living completed a site assembly at Eglinton and Bayview
worth approximately $15m, to be developed into seniors housing. Source: JLL Research, JLL REIS, Altus ITS
© 2019 Jones Lang LaSalle IP, Inc. All rights reserved. All information contained herein is from sources deemed reliable; however, no representation or warranty is made to the accuracy thereof.
Page 16Montréal Canada Investment Outlook | Mid-Year 2020
Montréal
   Canada Investment Outlook | Mid-Year 2020
Historic Real Estate Investment by Sector Disclosed Buyer and Seller Pool, YTD 2020
$10 Multifamily Land User
$9 Hotel Industrial
Office Retail
$8 Public
Alternative Assets
$7
CAD, Billions
$6 Private
$5
Pension Fund
$4
$3
Fund Manager
$2 Buyer
$1 Foreign Seller
$0
2015 2016 2017 2018 2019 YTD 2020 $0.00 $0.25 $0.50 $0.75 $1.00 $1.25 $1.50
CAD, Billions
Montréal Buyer Domicile, YTD 2020
Source: RCA, RealNet , Gettel Network, Commercial Edge, CoStar.
All transactions > $5m, Direct and Entity Level
Canada Excludes residential lots and residential occupier purchases
U.S. Sweden Market data as of latest available
86% 13% 1%
Multifamily
Land
Hotel
Industrial
Office
Retail
Alternative Assets
* Higher point size represents
larger deal sizeMontréal Canada Investment Outlook | Mid-Year 2020
Office Investment Volumes and Price PSF
General
Total Investment
• Montréal was the hardest hit Canadian city in the pandemic, with an $2.5 $500
Avg. PSF, Downtown
early February school break and strong connections to European Avg. PSF, Suburban
countries that were highly infected. It was also the first city to emerge $450
Avg. Sale Price PSF
CAD, Billions
$2.0 Avg. PSF, Midtown
from lockdown, providing a blueprint to other Canadian cities for
managing the pandemic. We maintain that Montréal will continue to $400
be an appealing market for investors looking for an attractive blend of $1.5
fundamentals and high yield. Population growth is expected to be flat $350
for the next two years, but with a highly diversified economy and a $1.0
young and educated labour force, Montréal is in position to absorb the $300
shock better than most major North America cities.
$0.5
• Montréal is coming off a record year that saw its investment market hit $250
nearly $9 billion in liquidity, almost doubling the previous record. So
far this year, the market is showing its resilience with over $2.8 billion in $0.0 $200
investment volume halfway through the year. Office continues to be 2015 2016 2017 2018 2019 YTD 2020
the most coveted sector with over $1b in sales. Multifamily ($580m),
industrial ($540m), and retail ($425m) are following suit. Office Net Rents and Vacancy
• Despite falling revenues from public services like transit and rising Average Net Rent, Downtown
costs associated with the pandemic, Montréal’s many infrastructure Average Net Rent, Suburbs
initiatives are moving forward. While delays could arise, the Quebec Total Vacancy Rate, Downtown 20%
government is holding firm on these commitments, as they will create $24 Total Vacancy Rate, Suburbs
18%
significant employment and should drive long term productivity. $22
16%
Avg. Rent (SF/Year)
Vacancy Rate
Office $20
14%
$18
• Montréal’s office market was the toast of the town in 2019, as record 12%
fundamentals drove it to $2.2b in overall sales. Despite a slow second $16 10%
quarter, the market surpassed $1b in sales halfway through the year.
$14 8%
• In the largest deal so far of 2020, Allied Properties purchased Centre de
Commerce Mondial from CDPQ for $276m ($485 psf) in the first $12 6%
quarter, making them the largest office landlord in the city. The largest
$10 4%
transaction to close during COVID was Crestpoint and Redbourne’s
2015 2016 2017 2018 2019 YTD 2020
acquisition of Place du Canada at a price of $105m, or $275 psf.
• After a steady first quarter, leasing activity began to dry up as tenants Office Cap Rates
paused to re-evaluate their footprints. Downtown landlords have
been firm on rents, which have risen to $20.40 psf, while suburban 7%
rents fell from the first quarter to $16.90 psf. In general landlords are
only lowering rents as a last resort, instead opting for concession 6%
packages to entice tenants. 5%
• Downtown vacancy sits at 6.9%, down from Q4 2019 but up 10 bps
4% Avg. Cap Rate: Downtown Avg. Cap Rate: Midtown
from Q1 2020. Vacancy across the market fell on average from 10% in
Avg. Cap Rate: Suburban GoC 10-yr Yield
Q4 2019 to 9.3% today. Over 160,000 square feet of sublease space has 3%
come available since COVID, most of which is located downtown.
2%
• Amidst so much uncertainty about office use, average cap rates have
ticked up by 30 basis points for downtown Class “A” product to 5.1%, 1%
with midtown cap rates having moved up around 20 bps to 5.8%. 0%
Suburban cap rates have held steady at 6.1%. Pricing on a per-square- 2015 2016 2017 2018 2019 YTD 2020
foot basis has fallen over the past quarter, though comparables are
limited due to slowing deal volume.
Source: JLL Research, JLL REIS, Altus ITS
© 2019 Jones Lang LaSalle IP, Inc. All rights reserved. All information contained herein is from sources deemed reliable; however, no representation or warranty is made to the accuracy thereof.
Page 19Montréal Canada Investment Outlook | Mid-Year 2020
Multifamily Investment Volumes Cap Rates
Multifamily Total Investment Vacancy
• According to CMHC, Montréal’s nearly 600,000 purpose built rental $2.0 Downtown Midtown 6%
units contribute about one third of the nation’s rental apartment stock, Suburban
CAD, Billions
while its 55.7% homeownership rate is the lowest among all major 5%
Canadian cities. Rental vacancy has fallen to 1.5%, a 15-year low, $1.5
driven by strong immigration and job growth. 4%
Avg. Cap Rate
• Multifamily has been Canada’s best performing asset class throughout $1.0 3%
the pandemic. REITs have reported rent collection around 95%, and
payment has been supported by the Canada Emergency Benefit 2%
Response (CERB) program. Investment volumes have been strong this $0.5
year at $580m despite the pandemic. 1%
• Similar to Toronto and Vancouver, multifamily sellers are generally not
$0.0 0%
conceding much in the wake of the pandemic. Cap rates have stayed
2015 2016 2017 2018 2019 YTD 2020
flat over the past quarter and asset pricing has not diminished.
• The Quebec government issued a moratorium on rental evictions Multifamily Sale Price Per Suite and Vacancy
beginning in March. The moratorium is set to expire in July, setting up
a showdown between landlords and housing advocates in the city’s Avg. PPU, Downtown Avg. PPU, Suburban
rental tribunals. $300 5%
Avg. PPU, Midtown Vacancy
• Manulife acquired the 3rd and 4th phase of EQ8 from Armco for a price
CAD, Thousands
of $105m, or $350,000 per suite. CAPREIT also made a large 4%
$250
acquisition, buying 8300 St. Laurent for $43.5m, or $388,000 per suite.
Devimco has announced a major rental and condo project adjacent to
Vacancy Rate
3%
the Universitè-de-Sherbrooke metro station in Longeueuil, which will
$200
add over 1,200 units and will break ground in 2021.
2%
• The city of Montréal has declared Right of First Refusal on around 300
parcels located in strategic areas of the city that are under $150
transformation. Under this plan, the city will have 60 days to 1%
determine if they will purchase these plots if they come up for sale.
Retail $100
2015 2016 2017 2018 2019 YTD 2020
0%
• Retail investment sales in Montréal totaled $425m in the first half of the
year after reaching the $1b threshold last year for the first time since Retail Investment Volumes and Cap Rates
2014. Nearly 60% of this year’s volume is accounted for by the Cadillac $2.0 8%
Total Investment Regional Malls
Fairview sale of Carrefour Laval to TD Asset Management, which was Power Center Food Anchored Strip
agreed to in 2019 and closed in January. 7%
GoC 10-yr Yield
• The Quebec provincial government is adding an additional top-up of $1.5 6%
CECRA-subsidized rents, reimbursing landlords up to 50% of their
CAD, Billions
write-offs, and thereby reducing the landlord’s rent liability to 12.5%. 5%
Avg. Cap Rate
• The bureau of Plateau-Mont-Royal, one of Montréal’s most prominent $1.0 4%
streetfront retail district, has announced that it will ease zoning
regulations in an effort to spur leasing activity in the retail sector. The 3%
city of Montréal, meanwhile, is giving property tax concessions to retail
$0.5 2%
property owners, hoping that the savings are passed on to tenants.
• Looking to set a strong precedent for pricing and to avoid reputational 1%
damage from underselling, vendors are being careful to only take their
strongest assets to market during this time. Buyer pools have been $0.0 0%
thin for assets worth over $10m, with the exception of grocery- 2015 2016 2017 2018 2019 YTD 2020
anchored retail which has held up well during the pandemic. Source: JLL Research, Altus ITS, CMHC
© 2019 Jones Lang LaSalle IP, Inc. All rights reserved. All information contained herein is from sources deemed reliable; however, no representation or warranty is made to the accuracy thereof.
Page 20Montréal Canada Investment Outlook | Mid-Year 2020
Industrial Investment Volumes and Price PSF
Industrial
$1.4 Total Investment $160
• The pandemic has slowed the market a bit but fundamentals remain Multi Tenant
$1.2 $140
strong and market drivers are still in place. Halfway through the year Single Tenant
liquidity has reached $540 million, and the market is maintaining its $120
CAD, Billions
$1.0
pace from the previous two years, although about 60% of these flows
Avg. Price PSF
$100
were carryover deals closed in 2019. $0.8
• After a strong first quarter, occupancy growth has shifted into negative $80
territory in Q2 with approximately 464,000 square feet of negative net $0.6
$60
absorption. Most spaces coming available are small bay, as local $0.4
tenants are the most disproportionately impacted by the pandemic. $40
Vacancy, now at 2.2%, is down from the end of 2019, but is up 20 basis $0.2 $20
points from the first quarter – its first quarterly increase since 2016.
$0.0 $-
• Given the resilience of the industrial sector amidst the pandemic, asset
2015 2016 2017 2018 2019 YTD 2020
pricing has not moved much from the end of 2019. Rent collections
have exceeded 90%, and net rents continue to climb. Cap rates are up
around 10 basis points on average, which is less movement than what Average Industrial Net Rent and Vacancy
has been observed in other property types. The slowdown in Avg. Rent
construction which has resulted from social distancing guidelines is $8 Avg. Vacancy Rate 8%
playing to the landlords’ favour by slowing the development pipeline.
$7 7%
• E-commerce and online grocery continue to drive new development in
the market. Sobey’s new fulfillment centre in Pointe-Claire will $6 6%
Avg. Net Rent, sf/yr
dedicate nearly 300,000 square feet of space to its e-commerce brand,
Vacancy Rate
$5 5%
Voilà. Amazon has broken ground on its first Quebec fulfillment centre
in Lachine, and Metro Inc. has announced plans to invest $420 million $4 4%
in upgrading its Quebec facilities over the next five years to $3 3%
accommodate e-commerce and online grocery shopping.
$2 2%
• Canada’s largest industrial transaction to happen during COVID was
Rona’s purchase of 220 Chemin du Tremblay in Boucherville from H&R $1 1%
REIT at a price of $69.5m, or $95 per square foot. $- 0%
2015 2016 2017 2018 2019 YTD 2020
Alternative Assets
Industrial Cap Rates
• Montréal saw about $105m in trades involving alternative assets thus
far in the year, with almost all deal flow happening in the first quarter. 8%
• Chartwell and Welltower came to a share sale agreement with 7%
development partner Batimo to acquire a 42.5% interest each in the
6%
345-suite Le St.-Gabriel retirement residence in Saint-Hubert. The
overall price of $37.9m each implies a per-bed price of nearly $260,000. 5% Single Tenant
• Champlain SH Real Estate Fund acquired Groupe Chateau’s Bellevue 4% Multi Tenant
portfolio of eight retirement residences. Chateau Bellevue plans to GoC 10-yr Yield
build three to four new suburban retirement homes annually over the 3%
next decade. 2%
• COVID outbreaks in long term care homes across Canada, and
1%
especially in Montréal, have led to calls for an expanded role for the
government in the operations of seniors housing facilities. We expect 0%
to know more on this issue as the year progresses, as the pandemic’s 2015 2016 2017 2018 2019 YTD 2020
trajectory moving forward will weigh heavily on this issue.
Source: JLL Research, JLL REIS, Altus ITS
© 2019 Jones Lang LaSalle IP, Inc. All rights reserved. All information contained herein is from sources deemed reliable; however, no representation or warranty is made to the accuracy thereof.
Page 21Montréal Aperçu des marchés des capitaux | T2 2020
Montréal
   Aperçu des marchés des capitaux | T2 2020
Investissement immobilier par catégorie d'actif Profil des Investisseurs immobiliers du marché
$10 Multi-résidentiel Terrains Inconnue
CAD, Milliards
$9 Hôtels Industriel Acheteur
Bureaux Détail Utilisateur Vendeur
$8
Actifs Alternatifs
$7
Publique
$6
$5 Privé
$4
Fonds de pension
$3
Gestionnaires de
$2 Placement
$1 Étranger
$0
2015 2016 2017 2018 2019 YTD 2020 $0.00 $0.25 $0.50 $0.75 $1.00 $1.25 $1.50
CAD, Milliards
Domicile des acquéreurs, T2 2020
Source : JLL Valuations, RCA, RealNet
transactions > 5 millions $, directement et au niveau des entités
Canada États-Unis Suède Exclut les lots résidentiels et les achats des occupants résidentiels
86% 13% 1% Données de marché au plus tard disponibles
Multi-résidentiel
Terrains
Hôtels
Industriel
Bureaux
Détail
Résidences pour
personnes âgées
* La taille du cercle
correspond au montant de la
transactionMontréal Aperçu des marchés des capitaux | T2 2020
Général
• Montréal a été la ville canadienne la plus durement touchée par la pandémie, en Investissement Total et Prix par Pied Carré
raison de la semaine de relâche scolaire de février et des liens étroits avec les pays
européens alors fortement affectés. Montréal a également été la première ville à investissement total centre-ville, Cat. A
sortir de son confinement, servant ainsi d’exemple aux autres villes canadiennes centre-ville, Cat. B banlieue, Cat. A
quant à la gestion de la pandémie. Nous croyons fermement que Montréal $1.4 $500
CAD, Milliards
continuera d'être attrayant aux yeux des investisseurs qui cherchent un marché $1.2
Prix par pied carré
combinant de solides bases économiques et des rendements élevés. Bien que l’on $400
ne s’attende pas à ce qu’il y ait une croissance démographique au cours des deux $1.0
prochaines années, une économie diversifiée et une main-d'œuvre jeune et $0.8 $300
éduquée devraient permettre à Montréal de mieux absorber le choc que la plupart
$0.6 $200
des autres grandes villes d'Amérique du Nord.
$0.4
• Montréal a connu une année record, son marché de l’investissement atteignant près $100
de 9 milliards $, soit presque le double du record précédent. Depuis le début de $0.2
l'année, le marché a su démontrer sa résilience, le volume d'investissement ayant $0.0 $0
atteint plus de 2,8 milliards de dollars à la fin juin. Le secteur des immeubles de T4 2015 T4 2016 T4 2017 T4 2018 T4 2019 Cumul
bureaux demeure le plus convoité, ayant dépassé le milliard $ de ventes. Les actifs Annuel,
multi-résidentiels (580 millions $), industriels (540 millions $) et de commerce de 2020
détail (425 millions $) ont également bien performé.
• Malgré la baisse des revenus provenant des services publics, tel que le transport en
commun, et la hausse des coûts associés à la pandémie, plusieurs initiatives Loyers et taux d’inoccupation
d'infrastructure vont de l'avant à Montréal. Bien que des retards puissent toujours
30% loyers moyen net, centre-ville $25
survenir, le gouvernement du Québec n’entend pas renoncer à ces grands projets, loyers moyen net, banlieue
Taux d’inoccupation
car ils créeront des emplois appréciables et stimuleront la productivité à long terme.
Loyer net moyen (du pied carré)
25% taux d'inoccupation, centre-ville
taux d'inoccupation, banlieue $20
Bureaux 20%
$15
15%
• Le marché des bureaux de Montréal a été le marché le plus performant en 2019,
comme en fait foi un niveau de ventes record de 2,2 milliards $. Malgré un deuxième $10
trimestre plus ardu, ce marché a quand même dépassé le milliard $ de ventes pour 10%
les premiers six mois de l’année. $5
5%
• La plus importante transaction survenue depuis le début de l’année est l’achat, par
le FPI Allied, du Centre de commerce mondial de la CDPQ, pour 276 millions $ (485
$/p.c.). Compte tenu de cette acquisition, qui a eu lieu au cours du premier 0% $-
trimestre, le FPI Allied est désormais le plus important propriétaire de bureaux à T4 2015 T4 2016 T4 2017 T4 2018 T4 2019 Cumul
Montréal. La principale transaction depuis le début de la pandémie est l’acquisition, Annuel,
par Crestpoint et Redbourne, de la Place du Canada au prix de 105 millions $(275 2020
$/p.c.).
• Après un premier trimestre au rythme soutenu, l'activité de location a commencé à Taux de capitalisation
se tarir, les locataires faisant une pause pour réévaluer leurs besoins en termes de
10% centre-ville, Cat. A
superficie. Les propriétaires d’immeubles du centre-ville ont maintenu le niveau de
9% centre-ville, Cat. B
leurs loyers, qui sont passés à 20,40 $ du pied carré, tandis qu’en banlieue, les loyers
8% banlieue, Cat. A
ont chuté dès le premier trimestre à 16,90 $ du pied carré. En général, les
7%
propriétaires ne baissent les loyers qu'en dernier recours, et optent plutôt pour des
6%
formules à base d’incitatifs afin d'attirer les locataires.
5%
• Compte tenu de l’incertitude quant à l'utilisation des bureaux, le taux de 4%
capitalisation moyen des immeubles de catégorie A situés au centre-ville a 3%
augmenté de 30 points de base, passant à 5,1 %, tandis que les taux de 2%
capitalisation d’immeubles situés dans le sous-marché du Centre-de-l’île ont 1%
augmenté d'environ 20 points de base, pour atteindre 5,8 %. Pour leur part, les taux 0%
de capitalisation des immeubles de banlieue sont demeurés stables, à 6,1 %. Les T4 2015 T4 2016 T4 2017 T4 2018 T4 2019 Cumul
prix au pied carré ont baissé au cours du dernier trimestre, bien que les propriétés Annuel, 2020
utilisées comme base de référence soient assez limitées en raison du ralentissement
du volume transactionnel. Source : Recherche JLL, REIS JLL, Altus ITS
© 2019 Jones Lang LaSalle IP, Inc. All rights reserved. All information contained herein is from sources deemed reliable; however, no representation or warranty is made to the accuracy thereof.
Page 24Montréal Aperçu des marchés des capitaux | T2 2020
Investissement Total et taux d'capitalisation
Multi-résidentiel investissement total centre-ville
• Selon la SCHL, on retrouve à Montréal environ 600 000 appartements construits banlieue périphérie
expressément pour la location, ce qui représente environ un tiers du parc obligations: 10 ans
$2.0 6%
d'appartements locatifs au Canada. De plus, le taux d'accession à la propriété de
taux d'inoccupation
55,7 % à Montréal, soit le taux le plus faible de toutes les grandes villes canadiennes. 5%
CAD, Milliards
$1.5
Il est également à noter que le taux d'inoccupation des logements locatifs a chuté à 4%
1,5 %, son niveau le plus bas en 15 ans, grâce à une forte croissance de l’immigration
et de l'emploi. $1.0 3%
• Le marché multi-résidentiel a été la catégorie d'actifs la plus performante au cours 2%
$0.5
de la pandémie, au Canada. Les fonds de placement immobilier ont déclaré avoir 1%
perçu environ 95 % des loyers dus, principalement en raison de la Prestation $0.0 0%
canadienne d'urgence. De plus, les volumes d’investissement ont été importants T4 2015 T4 2016 T4 2017 T4 2018 T4 2019 Cumul
cette année dans ce secteur, soit de l’ordre de 580 millions $. Annuel,
• Comme c’est le cas à Toronto et à Vancouver, les vendeurs d’actifs multi-résidentiels 2020
ne baissent pas leur prix en raison de la pandémie. Les taux de capitalisation sont
restés stables au cours du dernier trimestre et le prix de ces actifs immobiliers n'a Prix par pi2 et taux d'inoccupation
pas diminué.
centre-ville périphérie
• Le gouvernement du Québec a décrété un moratoire sur les expulsions de locataires
résidentiels à partir du mois de mars. Il est fort possible que la levée de ce moratoire, $300,000 banlieue taux d'inoccupation 5%
à la fin juillet, mène à une confrontation judiciaire entre les propriétaires et les
défenseurs du droit au logement. $250,000 4%
Prix par suite
taux d'inoccupation
• Manuvie a acquis la troisième et la quatrième phases d’EQ8 auprès d'Armco, pour
105 millions $, soit 350 000 $ par appartement. CAPREIT a également fait une $200,000
3%
acquisition importante, en achetant le 8300, boulevard du Saint-Laurent, à Brossard,
pour 43,5 millions $, soit 388 000 $ par appartement. Pour sa part, Devimco a $150,000
annoncé un important projet de location et de condos à proximité de la station de 2%
métro Longueuil–Université-de-Sherbrooke, qui ajoutera plus de 1 200 logements $100,000
sur le marché, et dont la construction est censée débuter en 2021. 1%
$50,000
• La Ville de Montréal a inscrit un droit de préemption sur environ 300 lots situés dans
des secteurs de la ville ciblés pour le redéveloppement. La Ville disposera de $- 0%
soixante jours pour déterminer si elle achètera ces lots, si elles sont mises en vente.
T4 2015 T4 2016 T4 2017 T4 2018 T4 2019 Cumul
Annuel,
Commerce de détail 2020
• Les transactions concernant les propriétés du secteur de la vente au détail ont Taux de capitalisation (commerce de détail)
atteint 425 millions $, à Montréal, au cours de la première moitié de 2020, après
avoir atteint 1 milliard $ l'année dernière, pour la première fois depuis 2014. Près de Investissement Total Régional
$2.0 Grande surface Linéaire (alimentation) 8%
60 % du volume de cette année est dû à la vente du Carrefour Laval par Cadillac
Fairview à Gestion de Placements TD Inc., une transaction qui a été enclenchée en obligations: 10 ans 7%
2019 et dont la clôture a eu lieu à la fin de janvier.
$1.5 6%
L’arrondissement du Plateau-Mont-Royal, l’un des principaux quartiers
,
•
commerciaux de Montréal, a annoncé qu'il assouplira les règlements de zonage afin 5%
de stimuler l'activité de location dans le secteur du commerce de détail. La Ville de $1.0 4%
Montréal, quant à elle, accordera des réductions de taxes foncières aux propriétaires
d’immeubles abritant des commerces de détail, en espérant que ces économies 3%
soient transférées aux locataires. $0.5 2%
• Afin de maintenir le niveau des prix et d'éviter que des réputations ne soient
1%
entachées par des ventes à perte, les propriétaires d’actifs du secteur de la vente au
détail veillent à ne mettre sur le marché que leurs propriétés les plus rentables, en $0.0 0%
ce moment. Par ailleurs, il y a peu d’acheteurs, actuellement, pour des actifs d'une T4 2015 T4 2016 T4 2017 T4 2018 T4 2019 Cumul
valeur supérieure à 10 millions $, à l'exception des centres commerciaux ayant un Annuel,
magasin d'alimentation comme locataire principal, qui ont bien résisté à la 2020
pandémie.
Source : Recherche JLL, Altus ITS, CMHC
© 2019 Jones Lang LaSalle IP, Inc. All rights reserved. All information contained herein is from sources deemed reliable; however, no representation or warranty is made to the accuracy thereof.
Page 25You can also read