CANADA - NATIONAL REPORT STRATEGIC DIRECTION SESSION ST 4 INFRASTRUCTURE - national report strategic direction session st 4 infrastructure ...
←
→
Page content transcription
If your browser does not render page correctly, please read the page content below
XXVth WORLD ROAD CONGRESS
                              Seoul 2015

               CANADA - NATIONAL REPORT

        STRATEGIC DIRECTION SESSION ST 4

                INFRASTRUCTURE
        OPTIMIZING ROAD INFRASTRUCTURE
        INVESTMENTS AND ACCOUNTABILITY

                                    Prepared By:

Canadian National Committee of the World Road Association in Partnership with Ontario
Ministry of Transportation (MTO) and Applied Research Associates Incorporated (ARA)
1. INTRODUCTION
In Canada, many agencies including the Treasury Board of Canada Secretariat, Parks
Canada and Transport Canada, provincial highway agencies such as Alberta,
Saskatchewan, Ontario and New Brunswick, municipalities such as Vancouver, Calgary,
Toronto and Ottawa and public-private partnerships such as the Sea to Sky, Highway 407
ETR and Route 1 Gateway have established asset management business frameworks to
assist in the efficient and cost effective management of their transportation assets.
Transportation asset management is not mandated in Canada as it will soon be in the
United States. In the United States, The Moving Ahead for Progress in the 21st Century
Act (MAP-21) was enacted to integrate performance into many federal, state, and local
transportation decision making programs. Specifically, MAP-21 requires federal, state,
and local transportation agencies to establish risk-based asset management plans that
include all infrastructure assets within the right-of-way of highways.
In 2014, the Transportation Association of Canada (TAC) initiated a study to develop a
synthesis of best practices for transportation asset management in Canada. The study
included a survey of the asset management practices of 25 roadway agencies across the
country. A list of agencies that participated in the survey is shown in Table 1.
Table 1. Agencies Participating in 2014 TAC Asset Management Practices Survey
Provincial Regional City Transit/Other
British Columbia York Vancouver TransLink
Alberta Waterloo Edmonton Calgary Transit
Saskatchewan Calgary S2S Transportation Group
Manitoba Regina Asset Management BC
Ontario Toronto Federation of Canadian Municipalities
Québec Ottawa Ontario Good Roads Association
New Brunswick Hamilton 407ETR
Vaughan
Barrie
Montréal
The initial results of the survey have been used to prepare this national report on the
optimization and accountability of investments for roadway infrastructure.
2. GENERAL ACCOUNTABILITY FOR ROAD INFRASTRUCTURE IN CANADA
Canada is a very large country with a land area of 9.985 million km2. Canada ranks
seventh in the world in terms of road network size with a two-lane equivalent length of 1.04
million kilometres. Canada ranks 37th in the world by population, with 35 million people to
support this infrastructure. The Canadian road network is largely rural in nature and the
roadway infrastructure, as in many countries, is aging with associated demands for
maintenance and rehabilitation.
2In Canada, there is no central Federal authority responsible for road infrastructure.
Transportation assets (i.e. roads, rail, airports, traffic control, transit, pipelines, ports, etc.)
are generally the largest component of civil infrastructure. Provincial, territorial and
municipal governments are responsible for a significant amount of the assets in Canada.
Road infrastructure by jurisdiction is generally classified as follows:
Federal – Roads under federal jurisdiction or under the jurisdiction of federal
agencies;
Provincial – Roads under provincial or territorial jurisdiction;
Municipal – Roads under municipal jurisdiction;
Access roads – Roads that are located on public land and are typically
constructed and maintained by private industry to provide access to resources
(forest, mineral extraction, recreation areas, etc.); and
Private road infrastructure – Roads built and maintained by private interests.
Table 2 provides the approximate total centreline kilometres of roadways and bridge deck
area in Canada (Hajek and Hein).
Table 2. Total Kilometres of Roadway and Number of Bridges in Canada
Responsibility Centreline Kilometres Bridge Deck Area (m2)
Federal 12,500 Included in Provincial
Provincial 202,400 845,116
Municipal 806,800 1,597,435
Access Roads 201,000 226,547
Private Roads ~35,000 Included in Access Roads
While there are other components to the transportation infrastructure such as signs,
drainage features, etc., roadways and bridges typically represent about 80 to 85 percent of
the total value of the infrastructure. The provincial and territorial highway authorities in
Canada are responsible for the construction and maintenance of approximately 20 percent
of public roadway infrastructure. All of the provincial and territorial highway authorities
have an asset management policy related to the management of transportation
infrastructure. Some agencies a have strong desire and demonstrate leadership in the
area of asset management, while others are hesitant to change, continuing to manage
their assets in separate categories.
Some agencies such as the Saskatchewan Ministry of Highways and Infrastructure and
the Province of Ontario have widely distributed asset management functions with all
activities coordinated at a higher level. The Province of Ontario goes beyond a traditional
safety and overall network health policy to include polices related to increasing transit
ridership, promoting a multi-modal network and integrating sustainability. Each of the
provincial and territorial highway agencies has created their own policy and asset
management strategy for transportation assets.
As seen in Table 2, approximately 80 percent of the public roadways in Canada are
maintained by municipal governments. In 2008, the Canadian Public Sector Accounting
Board (PSAB) introduced Regulation 3150. The PSAB 3150 regulation was approved by
the Canadian provincial governments and requires all municipal governments in Canada to
record and include all tangible capital assets in financial statements under the care and
control of the municipality. The Province of Ontario follows requirements of PSAB 3150
3regulations. It requires that all assets be recorded at their historical cost and depreciated
to the current period. Since 2009, all public sector municipal agencies in Canada are
required to comply with PSAB 3150 regulations.
The Guide to Accounting for and Reporting Tangible Capital Assets was published by the
Public Sector Accounting Group of the Canadian Institute of Chartered Accountants
(CICA) to provide a handbook for municipal governments to comply with the PSAB 3150
standard. As a result of the logical development of asset management practices, the
enactment of the PSAB 3150 regulations, and the general global move to sustainable
infrastructure, a large number of public agencies are adopting an asset management
approach to managing their transportation assets.
The current readiness status of Canadian provincial, municipal and private sector agencies
as measured on a 0 – 5 scale (0 lowest and 5 highest) against the ISO 55000 standard
fundamental elements of an asset management system is shown in Figure 1.
Canadian Organization
Asset Mangement Status
5
4.5
ISO 55000 Readiness
4
3.5
3
2.5
2
1.5
1
0.5
0
ISO 55000 Fundamental Elements
Provincial Municipal Private
Figure 1. Canadian Organization Asset Management Status
From Figure 1, it can be seen that most Canadian transportation agencies are at a fairly
high level of readiness for each fundamental element of the ISO 55000 standard.
Leadership is strong in developing and implementing asset management systems. A
lower level of readiness is reported for the last element of continuous improvement. This
is due to the fact that most agencies are still in the development stages of their asset
management programs. The improvement ranking is expected to increase as asset
management systems become more mature.
3. PERFORMANCE INDICATORS
Performance measures are the backbone of asset management. The use of asset
condition performance measures in planning rehabilitation investments ensures that the
right investment is made at the right time in the right location over the long term. Asset
condition performance measures allow the agency to gauge how well it is doing in
providing a safe and effective road network.
4As indicated above, transportation asset management typically has a focus on the higher
cost infrastructure such as pavements and bridges. The agency bases its highway needs
calculations and funding requests on meeting specific performance measures for
pavement and bridge condition. It is also important to ensure that the agency can achieve
a steady state “good” condition and eliminate the existing infrastructure debt over the long
term. Infrastructure debt is defined as the cost of the backlog of rehabilitation needs when
the budget is fully spent. Targets are set for both the short term on a year-by-year basis
and to meet long term objectives. Targets are based on the life cycle of an asset, the
amount of work that is reasonable in a construction period, reasonable funding levels,
eliminating a backlog of deficiencies and maintaining any future infrastructure debt at a
reasonable level.
As an example, the Province of Ontario sets performance targets for pavements and
bridges in “good” condition to be 67% and 85% respectively. In general a pavement in
good condition does not require rehabilitation/reconstruction for six or more years, a
pavement in fair condition will require treatment in one to five years and a pavement in
poor condition is currently in need of rehabilitation or reconstruction (in other words it has
reached the end of its service life). This is based on a time interval of 15 years between
significant pavement treatments. The need for rehabilitation or reconstruction is dependent
on the age of the entire pavement structure (when was it originally built), the condition
level to which a pavement is allowed to deteriorate, changes in traffic and local conditions,
and the quality and timeliness of maintenance during the pavement life.
Setting a target of 67% of pavements in good condition is based on having two-thirds of
the pavements not requiring any work for six or more years and 33% of the pavements in
fair condition. Ideally there should be no pavements in poor condition.
The Ontario long-term target for the number of bridges in good condition is 85%. On
average, bridges in Ontario require major rehabilitation every 30 to 35 years and
replacement after 60-70 years. This represents an average annual deterioration rate of
3%. Based on a five-year planning cycle, it is desirable to have only 15% of bridges in
need of rehabilitation at any time. This 85% threshold implies that the bridge network is in
a steady state. Using this measure, a bridge with a Bridge Condition Index (BCI) greater
than 70 is considered to be in good condition.
A municipal example is provided by the City of Edmonton which evaluates the condition of
assets according to the following three criteria:
Physical condition – Condition of the physical infrastructure that allows it to meet
the intended level of service;
Demand/capacity – The capacity of the physical infrastructure and its ability to
meet the service needs; and
Functionality – The ability of the physical infrastructure to meet program delivery
needs.
Since 2002, the City of Edmonton has used a standardized rating system to determine the
state and condition of its infrastructure. This five point system (A - Very Good, B - Good,
C - Fair, D - Poor and F - Very Poor) is used to assess each aspect of municipal
infrastructure in terms of physical condition, functionality and demand/capacity. Physical
condition refers to the condition of physical infrastructure that allows it to meet an intended
service level. Pavement surface distress and other condition ratings such as smoothness
5are used to calculate a condition rating on a scale of 0 to 10. This scale is then divided to
five equal portions to determine the rating categories.
Functionality refers to the ability of physical infrastructure to meet program delivery needs.
Demand/capacity refers to the capacity of physical infrastructure and its ability to meet
service needs. The condition rating portions for functionality and demand/capacity follow
guidelines outlined in procedures published by the Transportation Association of Canada
(TAC).
All agencies have established procedures for asset condition assessment. In general, for
pavement they include surface distress, smoothness and rutting. For bridges, condition
ratings are completed on individual components with an overall bridge condition index
developed.
The most comprehensive performance measure requirements in Canada are in the
concession agreements for public-private-partnership (PPP) projects. For example, for the
Sea to Sky Highway Concession which was established to support the 2010 Winter
Olympics in Vancouver, British Columbia, highway sections are managed in 50 m per lane
intervals with smoothness, rutting and distress asset preservation performance measures
(APPMs) along with an overall distribution of condition required for the entire length of
roadway.
The assets to be evaluated in PPP projects are defined in the concession agreements.
Most agreements include all of the major elements within the right- of-way including:
Pavements (main lanes, shoulders, side roads, pullouts),
Structures (bridges, tunnels, retaining walls),
Electrical systems (lighting, cameras, digital signs),
Right of Way (landscaping, fencing, noise walls),
Safety Appurtenances (barrier walls, pavement markings, attenuators, signs),
and
Drainage.
The maintenance and rehabilitation treatments for each asset are not specified. The
Concessionaire is free to select the method of treatment as long as the result meets the
requirements of the pre-defined asset preservation performance measure. The Ontario
Ministry of Transportation has also established performance based measures /
specifications for projects that have been delivered through a public-private partnership
(also called Alternative Financing and Procurement projects) with performance
requirements at hand back of the concession period (typically 30 years).
The majority of PPP concession agreements include some measureable condition
indicators for the pavements. These typically include pavement surface condition as
measured by some form of distress manifestation or index, smoothness which is usually
measured in accordance with the International Roughness Index (IRI) and wheel path
rutting. Some agreements may also include pavement surface friction and structural
capacity. For the majority of PPP agreements in North America, the Concessionaire is
required to measure the condition of the asset and take action when the condition state
exceeds the maximum permitted in the concession agreement. Examples of simple,
moderate and complex asset preservation performance measures (APPMs) from several
PPP projects in North America are shown in Table 3.
6Table 3. Examples of PPP Concession Asset Preservation Performance Measures
Response
APPM Intervention Criteria Action Basis of Measure
Time
Simple
Roughness Where the distortion Rehabilitation “immediately” Determined based on
reaches a severity visual observation
level of “severe”
Distress Where the pavement The “immediately” Condition index
condition index is less concessionaire measured in
than 60 shall establish accordance with the
a schedule for owners established
Where the severity of immediate procedures
an individual distress rehabilitation
reaches “severe”
Moderate Complexity
Roughness For 80% of all sections Permanent Within 6 Measured in
measured, IRI, repair months accordance with the
throughout 98% of owner’s procedures
each section is less for inertial profilers (to
than or equal to 1.5 allow for
m/km (95 in/mile) measurement bias,
an adjustment of 0.15
IRI measured m/km (10 in/mile) is
throughout 98% of made for concrete
sections is less than or pavements before
equal to 1.9 m/km assessing
(120 in/mile) compliance
Distress Pavement condition Permanent Within 6 Measurements are
score for 80% of repair months completed using
sections exceeding 90 procedures,
for mainlanes and techniques and
ramps equipment consistent
with owner’s PMS
manual
Complex
Roughness Where roughness Undertake 12 months IRI collected for each
exceeds an IRI value physical works wheel-path per
of 2.5 m/km (160 to address specifications and
in/mile) non- averaged
compliance
Where roughness over
any traffic lane
exceeds the
cumulative distribution
curve for IRI (Figure 2)
Distress Where pavement Undertake 12 months Ratings performed in
surface deterioration physical works accordance with the
over any traffic lane to address owner’s procedures
exceeds the non- with PDI calculated
cumulative distribution compliance according to the
limits curve for owner’s pavement
pavement distress distress index model
index (Figure 3)
7Cumulative IRI Distribution
100%
Percent of Network Tested
90%
80%
ACCEPTABLE
70%
60%
50%
40% UNACCEPTALBE
30%
20%
10%
0%Figure 4. Asset Condition Distribution for Transportation Assets – City of Ottawa, Ontario.
The reporting shown in Figure 4 includes the distribution of current condition into five
general categories ranging from very poor to very good, the past condition, the target
condition (policy commitment by the agency), number of assets and the value of those
assets.
Most agencies in Canada provide some level of information on the condition of the
transportation infrastructure and the current and/or projected performance targets of the
assets to help justify funding requests from elected officials or central agencies. For
example, the Ontario Ministry of Transportation makes annual funding requests based on
various funding scenarios in which funding requests are linked to the ability of the asset to
meet performance targets (such as 85% and 67% good for bridges and pavements
respectively) or highlight current performance of the asset based on current approved
funding.
4. TOOLS TO ANALYZE INVESTMENT CHOICES
There is a large variation in the transportation asset management tools employed by
agencies in Canada. The majority of agencies have different databases and software
applications to manage their transportation infrastructure. The software systems used are
typically commercial off-the-shelf applications, frequently modified for individual agency
use. For most agencies, the most comprehensive system in use is for the pavement
inventory. Pavement management is the most mature in Canada. The legacy of national
coordinated efforts on pavement design and management date back to the 1950s and the
Canadian Good Roads Association (CGRA) committee on pavement design and
evaluation. This led to the Roads and Transportation Association of Canada (RTAC)
Pavement Management Committee and the publication of the first Pavement Management
Guide in 1977. Subsequently, the first two international conferences on managing
pavement assets took place in Toronto, Canada in 1985 and 1987 respectively. The
9current edition of the TAC Pavement Asset Design and Management Guide (2013) is one
of the most widely used references on the subject in the world.
The Province of Alberta has the most comprehensive and integrated transportation asset
management system, including an in-house asset management system (TIMS) that
includes asset inventory, condition monitoring, performance modelling, risk analysis and
costing all driven by a geographic information system (GIS) interface.
Over the last ten years, the Ontario Ministry of Transportation has implemented
comprehensive programs for highway infrastructure assets using well developed principles
and practices. The ministry has developed key asset management tools including a
pavement management system and a bridge management system. The use of asset
condition performance measures and targets in planning of rehabilitation investments
ensures that the right investment is made at the right time in the right location over the
long-term. The ministry is currently implementing an integrated asset management system
in order to automate data extractions and manage pavement and bridge inventory data in
one management system. In addition, the asset management system will integrate the
program planning functions that are distributed geographically through five regional offices,
and strategic level investment planning function under one system. This will provide the
ministry with a tool to manage its assets on a provincial basis as one enterprise.
The City of Edmonton has separate systems for asset management components (roads,
bridges, sidewalk, drains, traffic lights, etc.). The Sea to Sky Highway concessionaire has
a centralized asset inventory and condition database for annual reporting of asset
preservation performance measures to the Province. The City of Ottawa is in the process
of completing the implementation of a comprehensive asset management (CAM)
application. CAM is an integrated business approach involving planning, finance,
engineering and maintenance and operations. The City of Calgary has adopted an
approach that has integrated risk management and life cycle as the basis for their asset
management.
Resources for transportation asset management vary widely across Canada. Some
agencies have departments of asset management while others have identified a single
individual with responsibility for asset management. Some have completed asset
management gap analyses (e.g., Manitoba Infrastructure and Transportation and the City
of Regina), to determine the necessary resources in terms of personnel, skills and
software application to support their asset management objectives. The Region of
Waterloo, in Ontario, is undergoing a reorganization to better align their services with asset
management objectives. The majority of agencies in Canada use in-house developed
systems or a combination of commercially available software and in-house systems for
asset management. While most complete asset management activities in-house, others
such as the Sea to Sky Highway concession use a combination of in-house and consulting
engineering firms.
Most large Canadian transportation agencies have implemented GIS for pavement
management. One example is Alberta Transportation’s Transportation Infrastructure and
Management System (TIMS). TIMS is a sophisticated web-based system that allows
efficient user interaction with fully integrated data, information and expertise through
internet enabled computers or wireless devices. The system uses a central data repository
containing current and historical information. Data is accessed by both internal and, in
some cases external clients, using integrated web based input, query, and analysis
applications. This enterprise GIS, shown in Figure 5, provides a single consolidated data
10warehouse architecture and the ability for clients to dynamically segment the road network
based on attributes or performance criteria, query the database, and report the results.
Figure 5. Alberta Transportation TIMS interactive Web environment.
At the municipal level, the GIS is rapidly becoming the user interface for all infrastructure
related asset data. In some cases the infrastructure data and valuation is centralized. For
example, the Ontario Good Roads Association (OGRA) has sponsored the development of
Municipal Data Works (MDW). MDW is a web-based database and repository for asset
inventory and condition information for bridges (317 municipalities), roads (234), Water
Supply Systems (65) and Wastewater Systems (61).
While some agencies are working towards risk-based asset management and cross-asset
optimization (between assets such as pavements and bridges), most still assess risk and
optimization maintenance and rehabilitation programs within the individual asset classes,
establish general program needs and budgets and then “customize” the final program
based on local needs or other priorities. This is typically called “skilled intervention” looking
at each asset class and making trade-offs or combining individual assets (such as
pavements and bridges) when creating a work program or projects for delivery.
All of the agencies who took part in the TAC Synthesis of Asset Management Best
Practices Study use asset management tools to complete funding impact analyses to
determine the improvement or reduction in asset quality based on budget expenditures.
This type of analysis supports budget requests or highlights impacts of budget restrictions
on the condition performance of the assets.
5. USER SATISFACTION
A key factor in both the road authority’s business plan and in a road asset management
system itself is explicit recognition of stakeholder group interests through provision of
service.
11In terms of the understanding of the needs and expectations of stakeholders, most
agencies have some sort of stakeholder surveys or public meetings to assist in meeting
expectations. At the municipal level, stakeholders typically include the public, while at the
Provincial level, the first-line stakeholders are typically regional offices or other
government agencies with the public the end user and ultimate stakeholder.
For example, the Ontario Ministry of Transportation has immediate internal stakeholders
for the Investment Strategies Branch (ISB) and the ministry regional offices. Annual asset
management investment funding requests are developed by Central Head Office (ISB) and
rehabilitation funding provided to regional offices. The program is developed and
delivered by regional offices based on funding allocations provided. Ultimately the public
and other stakeholder rely on a safe and reliable transportation network to ensure efficient
movement of people and goods.
For the Sea to Sky Highway concession, the goals are set out by the Province of British
Columbia. There is no direct relationship to the stakeholders (other than the Province), but
the Province’s requirements are intended to satisfy the stakeholders.
The City of Ottawa Asset Management Branch (AMB) has developed a comprehensive
guide outlining the roles and responsibilities of the branch and to demonstrate the
corporate linkages since many departments have a role to play in the overall management
of the City’s infrastructure assets. The AMB has also developed Service Understanding
Agreements (SUA) with all client departments within the City. These define service
expectations for different client groups.
The Vancouver transit authority (Translink) objectives are to maximize ridership, incur
long-term ridership growth and provide access to transit services across the Vancouver
region.
The City of Regina publishes a Roadways Preservation Flyer to explain the current City
practices for pavement maintenance and rehabilitation. In addition, they complete a
regular citizen survey to determine the public perception of the condition of the
transportation assets within the City.
6. INVOLVEMENT OF CITIZENS IN DECISIONS
Other than providing annual state of the asset condition reports to citizens, few agencies
include citizens in the asset management process, including decisions related
infrastructure funding. Cities such as Regina, Saskatchewan have completed citizen
surveys since 1988 which are used to assist with strategic planning, policy and program
development and management of service (Regina 2009). Surveys of more than 500
households are completed by telephone. The condition of roads and sidewalks are
frequently identified as one of the most important public issues facing Regina as a
community.
There are a number of advocacy groups in Canada that are involved in infrastructure asset
management to ensure that both provincial and municipal governments are being held
accountable for the stewardship of Canadian transportation assets.
The Federation of Canadian Municipalities (FCM) has been the national voice of municipal
governments since 2001. With over 2,000 members, FCM represents the interests of
municipalities and program matters that fall within the federal jurisdiction. The FCM has
12sponsored numerous applied research efforts to advance the state of municipal asset
management in Canada.
The Ontario Good Roads Association was founded in 1894 and has substantially
contributed to the leadership, advocacy and training for asset management in Ontario.
The OGRA Academy was established to develop the skills and knowledge required to
manage the financial, capital, and operational needs of public infrastructure assets.
The Canadian Network of Asset Managers (CNAM) is a national leader for infrastructure
asset management. CNAM is a recognized source of knowledge, promotes innovation
and collaboration, and provides a common voice to facilitate action. CNAM is a non-profit
association, governed by a volunteer board of directors, established in 2009.
Asset Management British Columbia (BC) is comprised of local government
representatives in administrative, technical, operational, financial, planning, and political
disciplines as well as key industry associations. Currently, Asset Management BC is in the
process of developing a toolkit for local governments which includes an asset
management policy, self-assessment tool and roadmap. In the future, Asset Management
BC will continue to facilitate educational opportunities, provide asset management
resources and assist in knowledge transfer.
7. ACCOUNTABILITY
Many Canadian agencies are in the early stages of the development of their asset
management plans. While there are some who have risk evaluation components for
portions of their asset management plans, most plans are not advanced to the stage
where an objective risk analysis can be completed. Alberta Transportation has identified a
number of risks and opportunities that can be evaluated using rigorous engineering-
economic-environmental evaluation of the programs. Saskatchewan Ministry of Highways
and Infrastructure (MHI) staff meet annually as a part of their business process to discuss
the effectiveness of their pavement preservation treatments. The Region of Waterloo has
developed a corporate risk management framework.
Many agencies in Canada produce an annual state-of-the-infrastructure report (report
card). Alberta Transportation has developed a network performance evaluation and
decision application tool to support their TIMS in identifying and fine tuning performance
measures. The Ontario Ministry of Transportation uses Results-based-Planning to report
on asset performance. The Ministry also publishes annual reports noting past years
accomplishments plus the planned highway work projects for the upcoming five years
(Northern and Southern Highway Programs). The City of Edmonton developed an award-
winning risk-based asset management system. The Region of Waterloo has developed,
documented and reports on asset management objectives. While most agencies produce
a report on an annual basis, the City of Calgary publishes theirs on a three-year basis.
Few agencies reported the standard practice of “auditing” asset management practices.
The Saskatchewan MHI reported that they did audits of the compliance of strategic models
in accordance with the asset management procedures. The Sea to Sky Highway
concessionaire has a quality auditor on-staff to review work completed both internally and
for retained consultant and contractor work.
The City of Ottawa AMB Reference Guide outlines all of the practices, processes and
controls of the group to deliver the asset management program. In 2013/2014, the AMB
13has documented asset management branch business model with intermediate level
process models for all core asset management systems in the branch.
8. EXAMPLE - ASSET MANAGEMENT BUSINESS PROCESS, ONTARIO MINISTRY
OF TRANSPORTATION
The Ministry of Transportation (MTO) strives to be a world leader in moving people and
goods safely, efficiently and sustainably to support a globally-competitive economy and a
high quality of life.
MTO is charged with the stewardship of assets that have a replacement value of
approximately $80B. Pavements and bridges account for 88% of that replacement cost. It
is critical that these two asset types are maintained in good repair to ensure the safe and
efficient movement of people and goods, and to promote economic development. Sound
asset management principles dictate that to obtain a high level of value for money and to
maximize benefits over their lifespan, these assets must have regular rehabilitative
maintenance performed to avoid or delay the need for larger more costly reconstruction or
replacement.
The two major asset inventory and management systems are the Pavement Management
System (PMS2) and the Bridge Management System (BMS) / Bridge Priority Tool (BPT).
In the last five years the BMS and the PMS2 have undergone substantial upgrades. Most
recently, the ministry is including partial integration of bridge management features into
PMS2 to develop MTO’s new Asset Management System (AMS).
The PMS2 contains an inventory for all pavement sections – their associated condition
(Pavement Condition Index), history of construction and pavement design. It is a very
powerful tool; using various deterioration models, decision trees, cost models and lifecycle
models to perform various analyses.
The Bridge Management System contains the inventory of all structures including bridges
and culverts with spans over 3m and their condition. This includes the condition of various
elements of a structure and their associated replacement value. The information is used
to calculate the overall Bridge Condition Index (BCI). The condition data and inventory
information from BMS is downloaded for use in the Bridge Priority Tool (BPT) which
determines the long-term bridge rehabilitation needs.
Both PMS2 and BMS/BPT are state of the art tools and the information and analyses they
perform are used to develop the rehabilitation needs for pavements and bridges on annual
basis. Both contain an accurate inventory of bridges and pavements. Condition is
measured every year for pavements and every two years for bridges.
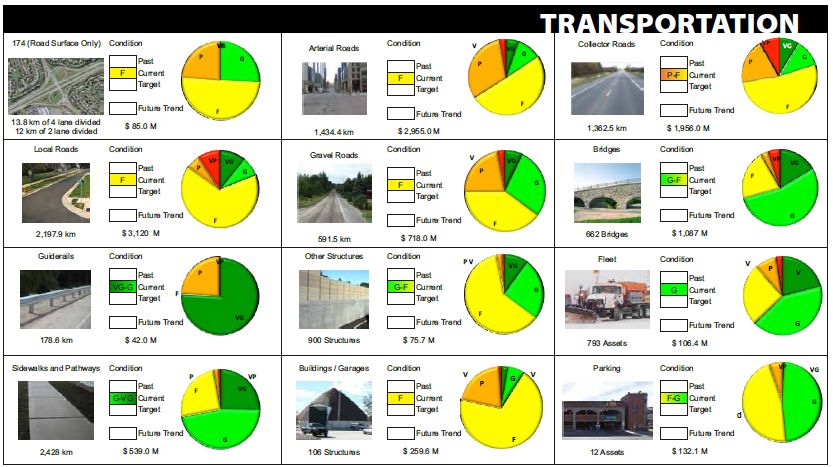
Asset management tools and principles are used by MTO to make annual funding
requests from Central Agencies. MTO bases its highway needs calculations and funding
requests on meeting specific performance measures for pavement and bridge condition.
The performance targets for pavements and bridges in Good condition are 67% and 85%
respectively (example of various funding scenario vs. performance is provided in Figure
6). Asset management tools are also used to quantify asset performance based on
funding scenarios, including current approved funding from Central agencies.
14Once funding approvals is received (10 year outlook), funding allocations are provided to
regional program delivery offices. Regional offices develop and deliver the multi-year
capital rehabilitation program. Accomplishments related to the amount of pavements and
bridges rehabilitated annually are reported to the Central Agencies.
MTO continues to explore opportunities to improve its asset management practices by
researching and evaluating other jurisdictions’ asset management practices, and reviewing
/ assessing current MTO asset management procedures and practices.
2000
Funding Options vs. Performance (% Good Pavement and Bridges)
100.00%
85% "Good"
1800 90.00%Condition
(Bridges)
1600 80.00%
67% "Good"
Condition
1400 70.00%
(Pavements)
1200 60.00%
Funding ($)
% Good
1000 50.00%
Funding Option 1
Funding Option 2
800 40.00%
Pavements (GOOD) ‐Option 1
600 30.00% Bridges (GOOD) ‐ Option 1
Pavements (GOOD) ‐ Option 2
400 20.00% Bridges (GOOD) ‐ Option 2
200 10.00%
0 0.00%
2014/15 2015/16 2016/17 2017/18 2018/19 2019/20 2020/21 2021/22 2022/23 2023/24
Funding Option 1 342 348 371 437 412 435 437 437 450 490
Funding Option 2 239 244 260 306 289 304 306 306 302 302
Pavements (GOOD) ‐Option 1 66.30% 68.00% 66.60% 62.60% 61.90% 62.90% 61.00% 63.00% 64.50% 67.50%
Bridges (GOOD) ‐ Option 1 73.70% 71.70% 72.30% 74.00% 76.50% 80.50% 84.80% 88.50% 91.60% 94.20%
Pavements (GOOD) ‐ Option 2 66.30% 65.90% 61.20% 58.90% 59.60% 60.00% 59.00% 58.00% 57.00% 56.00%
Bridges (GOOD) ‐ Option 2 73.70% 71.30% 70.90% 72.50% 73.70% 75.80% 76.00% 77.00% 78.00% 80.00%
Figure 6. Funding Options vs Performance
9. SUMMARY
Roadway agencies in Canada are at various levels of maturity in the implementation of
transportation asset management programs and systems. While in general, provincial
highway agencies and the larger cities are more advanced as they have more resources
than smaller municipalities, strong leadership and champions within the agencies are
moving forward to implement comprehensive systems to assist in the stewardship of our
aging infrastructure.
There is a strong movement in Canada for agencies to integrate investment planning and
programming and move away from traditional silo-based infrastructure management
systems into one comprehensive system. A move to systems that track asset
performance from construction to retirement and use life-cycle cost to make whole life
maintenance and rehabilitation investment decisions. These systems report on
achievements in maintaining and improving asset condition as measured by key
performance measures.
1510. REFERENCES
CCPPP (2014). Canadian Council for Public-Private Partnerships. Canadian PPP Project
Database. http://www.pppcouncil.ca/.
CICA (2007). Canadian Institute of Chartered Accountants. Guide to Accounting and
Reporting for Tangible Capital Assets.
CICA 2 (1989). Canadian Institute of Chartered Accountants. Accounting for
Infrastructure in the Public Sector. Research Report. Toronto.
Hajek, J. and Hein, D (2006). Estimation of the Representative Annualized Capital and
Maintenance Costs of Roads by Functional Class. Technical Report to Transport Canada.
Ottawa (2014). City of Ottawa. Comprehensive Asset Management Program 2012 State
of the Asset Report, Ottawa, Ontario.
Regina (2009). City of Regina. 2009 Summer Survey – Final Report, Regina,
Saskatchewan.
TAC (2013). Transportation Association of Canada. Pavement Asset Design and
Management Guide, Ottawa, Canada.
16You can also read