Canada's Energy Sector - Status, evolution, revenue, employment, production forecasts, emissions and implications for emissions reduction - | ...
←
→
Page content transcription
If your browser does not render page correctly, please read the page content below
Canada’s Energy Sector
Status, evolution, revenue, employment, production forecasts,
emissions and implications for emissions reduction
By J. David Hughes
JUNE 2021
Canada’s Energy Sector
Status, evolution, revenue, employment, production forecasts,
emissions and implications for emissions reduction
by J. David Hughes
June 2021
Co-published by:
This paper is part of the Corporate Mapping Project (CMP), a research and public engagement initiative
investigating the power of the fossil fuel industry. The CMP is jointly led by the University of Victoria,
Canadian Centre for Policy Alternatives and the Parkland Institute. This research was supported by
the Social Science and Humanities Research Council of Canada (SSHRC). For more information visit
corporatemapping.ca.
PUBLISHING TEAM
Shannon Daub, Joel French, Jean Kavanagh, Emira Mears, Terra Poirier
Copyedit: Lucy Kenward
Layout: Paula Grasdal
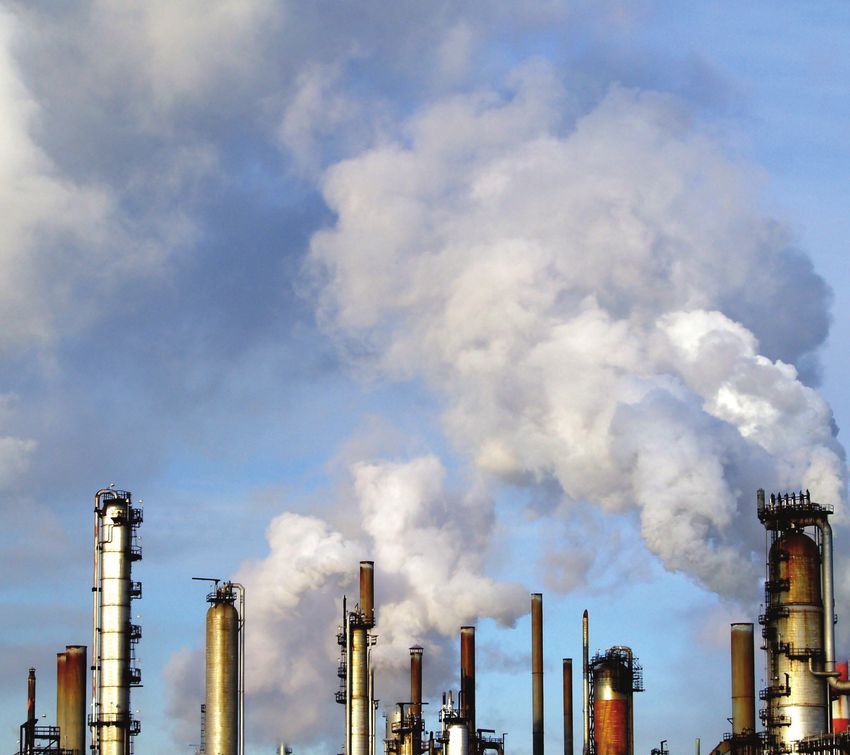
Cover photo: Bruce Raynor / Shutterstock
Figures © 2021 by J. David Hughes
ISBN 978-1-77125-553-0
This report is available under limited copyright protection. You may download, distribute, photocopy,
cite or excerpt this document provided it is properly and fully credited and not used for commercial
purposes.
The opinions and recommendations in this report, and any errors, are those of the author, and do not
necessarily reflect the views of the publishers and the funders of this report.
520 – 700 West Pender Street Vancouver, BC V6C 1G8
604.801.5121 | ccpabc@policyalternatives.ca
www.policyalternatives.ca
The CCPA–BC is located on unceded Coast Salish territory, specifically the lands belonging to the
xwməθwəýəm (Musqueam), Skwxwú7mesh (Squamish) and səÍílwətaʔɬ /Selilwitulh (Tsleil-Waututh) Nations.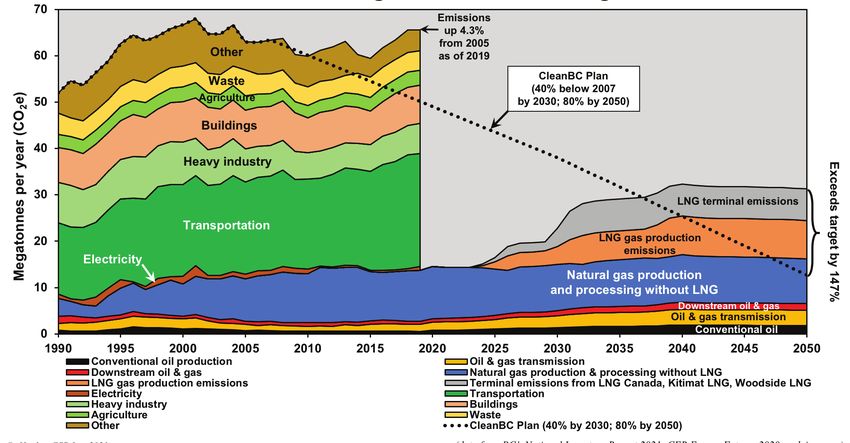
ABOUT THE AUTHOR
J. DAVID HUGHES is an earth scientist who has studied the energy resources of Canada for more than four decades,
including 32 years with the Geological Survey of Canada as a scientist and research manager. He developed the
National Coal Inventory to determine the availability and environmental constraints associated with Canada’s coal
resources. As Team Leader for Unconventional Gas on the Canadian Gas Potential Committee, he coordinated the
publication of a comprehensive assessment of Canada’s unconventional natural gas potential.

Over the past two decades, Hughes has researched, published and lectured widely on global energy and
sustainability issues in North America and internationally. In his work for the Canadian Centre for Policy
Alternatives, Hughes authored A Clear View of BC LNG in 2015, which examined the issues surrounding a proposed
massive scale-up of shale gas production in British Columbia for LNG export, Can Canada increase oil and gas
production, build pipelines and meet its climate commitments? in 2016, which examined the issues surrounding
climate change and the Trans Mountain pipeline expansion (now updated in this paper), Canada’s Energy Outlook:
Current realities and implications for a carbon-constrained future in 2018, and BC’s Carbon Conundrum: Why LNG exports
doom emissions-reduction targets and compromise Canada’s long-term energy security earlier in 2020. Later in 2020 he
authored Reassessment of Need for the Trans Mountain Pipeline Expansion: Project Production forecasts, economics and
environmental considerations. He has also authored multiple reports on unconventional oil and gas development in
the United States, consulted for the private sector on unconventional oil and gas, and served as an expert witness
on hearings for energy projects in the US and Canada.

Hughes is president of Global Sustainability Research, a consultancy dedicated to research on energy and
sustainability issues. He is also a board member of Physicians, Scientists & Engineers for Healthy Energy (PSE
Healthy Energy) and is a Fellow of the Post Carbon Institute. His work has been featured in Nature, Canadian
Business, Bloomberg and USA Today, as well as other popular press, radio and television.

ACKNOWLEDGEMENTS
Special thanks to Stand.earth and Tzeporah Berman for supporting this research and to the Corporate Mapping
Project for providing a platform for its publication, as well as the anonymous critical reviewers. Shannon Daub,
Emira Mears and Terra Poirier, of the CCPA, also provided extensive reviews and comments which improved the
manuscript, and Jean Kavanagh and Joel French, also of the CCPA, expedited other aspects of publication. Lucy
Kenward provided a careful copyedit of the manuscript and Paula Grasdal oversaw the layout.
Contents

List of figures and tables...................................................................................................5

Summary..........................................................................................................................8

Introduction...................................................................................................................15

Status and evolution of the energy sector.......................................................................16

Contributions of the energy sector to the Canadian economy........................................22

           Gross domestic product.....................................................................................22

           Revenue provided to provincial governments....................................................25

           Employment......................................................................................................27

           Taxes..................................................................................................................31

Energy production and consumption forecasts...............................................................32

           Energy and electricity demand...........................................................................32

           Oil production forecast...................................................................................... 35

           Implications for new export pipelines................................................................36

           Gas production forecast.....................................................................................38

Emissions trends and climate commitments...................................................................43

Implications for energy megaprojects and future production.........................................48

Conclusions....................................................................................................................54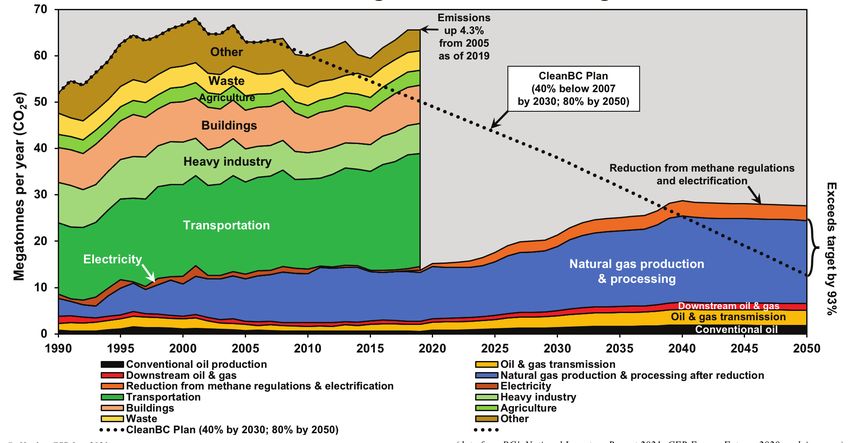
List of figures and tables

FIGURES

Figure S1: Employment in the oil and gas industry in Canada by sector component
from 2011 to 2019, based on PetroLMI data (LHS )...................................................................10

Figure S2: Royalty revenue from oil and gas production by province
from 2000 to 2019 (LHS)..........................................................................................................10

Figure S3: Royalty revenue from oil and gas production by province in dollars
per barrel of oil equivalent (BOE) from 2000 to 2019................................................................11

Figure S4: Tax contribution of the oil and gas sector as a percentage of total
industrial taxes paid by industry in Canada from 2000 to 2018 ................................................11

Figure 1a: Global primary energy consumption by fuel in 2019 with a
comparison to the growth of total non-hydro renewable energy
(excluding traditional biomass) from 1995 to 2019..................................................................17

Figure 1b: Canadian primary energy consumption by fuel in 2019 with a
comparison to the growth of non-hydro renewable energy
(excluding traditional biomass) from 1995 to 2019..................................................................17

Figure 2: End-use energy demand in Canada by fuel source and sector in 2019 .......................18

Figure 3: Energy consumption per capita by country in 2019...................................................18

Figure 4: Emissions per capita from fossil fuel combustion by country in 2019..........................19

Figure 5: Oil production in Canada by province from 1947 through 2019.................................20

Figure 6: Marketed natural gas production in Canada by province
from 1947 through 2019...........................................................................................................20

Figure 7: Oil and gas production in Canada by product type from 1947 through 2019.............21

Figure 8: Growth rate of Canada’s energy sector compared with the non-energy
sector and Canada’s overall GDP from 1997 to 2019.................................................................23

Figure 9: Contributions of Canada’s energy sector to GDP by component
from 2007 to 2019....................................................................................................................23

Figure 10: Energy sector share of Canada’s total GDP by province from 1997 to 2019...............24

A CORPORATE MAPPING PROJECT REPORT                                                                                                        5
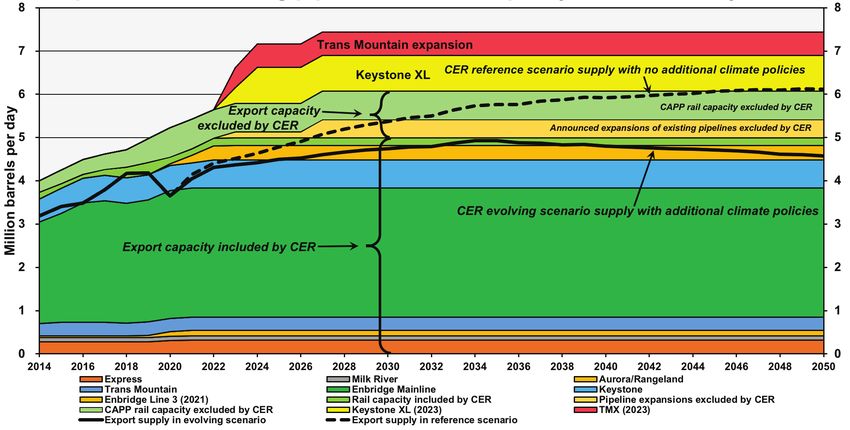
Figure 11: Energy sector share of total provincial GDP by province from 1997 to 2019..............24
Figure 12: Royalty revenue from oil and gas production by province
from 2000 to 2019 (LHS)..........................................................................................................25
Figure 13: Royalty revenue from oil and gas production by province in
dollars per barrel of oil equivalent (BOE) from 2000 to 2019....................................................26
Figure 14: Non-renewable resource revenue in Alberta by component
from 2000 to 2019 (LHS)..........................................................................................................26
Figure 15: Direct employment by component in the oil and gas sector
in Canada from 2001 to 2019....................................................................................................27
Figure 16: Employment in the oil and gas sector by province (excluding gasoline
stations) as a percentage of total industrial employment from 2001 to 2019............................28
Figure 17: Employment in the oil and gas industry by province from 2011 to 2019,
based on PetroLMI data (LHS)..................................................................................................29
Figure 18: Employment in the oil and gas industry in Canada by sector
component from 2011 to 2019, based on PetroLMI data (LHS) ................................................29
Figure 19: Productivity of employees in the oil and gas industry in Canada
from 2011 to 2019, based on PetroLMI data.............................................................................30
Figure 20: Tax contribution of the oil and gas sector as a percentage of total
industrial taxes paid by industry in Canada from 2000 to 2018.................................................31
Figure 21: Primary energy demand in Canada by fuel source in the
Canadian Energy Regulator’s evolving scenario .......................................................................33
Figure 22: End-use energy demand in Canada by fuel source in the
Canadian Energy Regulator’s evolving scenario .......................................................................33
Figure 23: Electricity generation in Canada by fuel source in the
Canadian Energy Regulator’s evolving scenario .......................................................................34
Figure 24: Oil production by province in the Canada Energy
Regulator’s evolving scenario...................................................................................................35
Figure 25: Oil production by type in the Canada Energy
Regulator’s evolving scenario...................................................................................................36
Figure 26: Existing and proposed pipeline and rail capacity for exporting oil
from Western Canada with overlay of oil available for export from the
Canada Energy Regulator’s evolving and reference scenarios...................................................37
Figure 27: Natural gas production by province in the Canada Energy
Regulator’s evolving scenario...................................................................................................39
Figure 28: Estimates of natural gas resources in Canada by type from 2007 to 2019..................41
Figure 29: Natural gas production by province in the Canada Energy
Regulator evolving scenario.....................................................................................................41
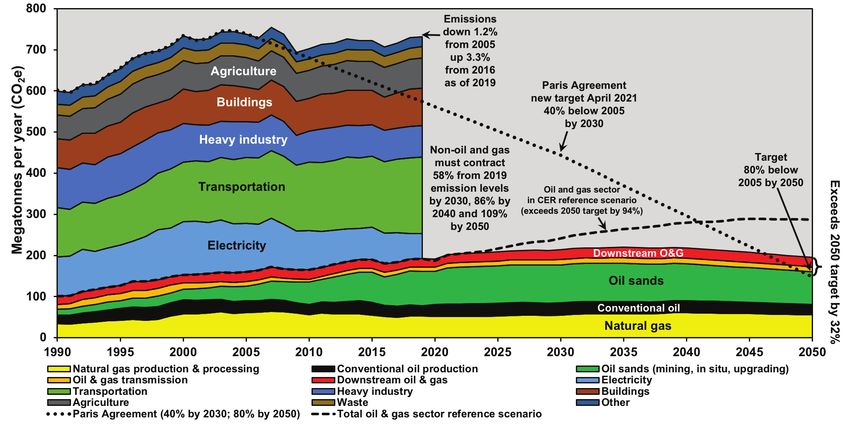
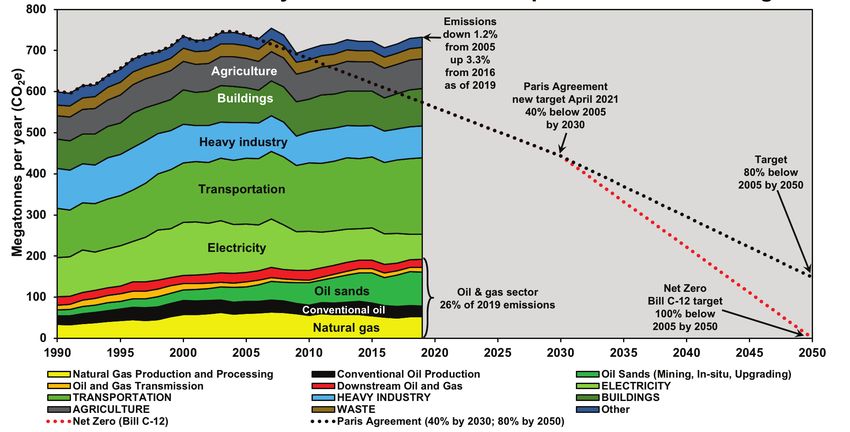
Figure 30: Emissions in Canada by economic sector from 1990 to 2019 and emissions targets
the Government of Canada has committed to for 2030 and 2050.............................................44
Figure 31: Emissions by province and economic sector in 2019................................................44
6 CANADA’S ENERGY SECTORFigure 32: Per capita emissions by province and economic sector in 2019................................45 Figure 33: Change in emissions in Canada by economic sector from 2005 to 2019 and from 2018 to 2019........................................................................................46 Figure 34: Change in emissons by province and economic sector from 2005 to 2019................47 Figure 35: Overall change in emissions by province from 2005 to 2019....................................47 Figure 36: Well-to-tank emissions from oil production from various sources around the world compared to the US refinery average ...........................................................49 Figure 37: Projected reduction in emissions from 2018 levels in oil sands production by method in the Canada Energy Regulator’s evolving scenario...............................................49 Figure 38: Canadian emissions to 2050 assuming the Canada Energy Regulator’s evolving scenario production projection and oil sands emissions reductions illustrated in Figure 37..............................................................................................................50 Figure 39: BC emissions projections for the oil and gas sector in the Canada Energy Regulator’s evolving scenario, excluding emissions from LNG terminals ..................................52 Figure 40: BC emissions projections for the oil and gas sector in the Canada Energy Regulator’s evolving scenario, including emissions from Canada LNG, Kitimate LNG and Woodfibre LNG..............................................................53 TABLES Table 1: Remaining established natural gas reserves by province, according to Canadian Association of Petroleum Producers’ estimates .........................................................40 A CORPORATE MAPPING PROJECT REPORT 7
Summary

   Production of oil   ALTHOUGH THE ENERGY SECTOR HAS BEEN A SIGNIFICANT CONTRIBUTOR to Canada’s economy,
    and gas creates    its contributions in terms of employment and revenue from royalties and taxes are declining,
        one-quarter    even though production is at an all-time high. Production of oil and gas creates one-quarter
         of Canada’s   of Canada’s greenhouse gas emissions at a time when Canada has committed to a 40 per cent
    greenhouse gas     reduction from 2005 levels by 2030 and “net-zero” emissions by 2050 (through Bill C-12, al-
                       though in 2016 Canada agreed to an 80 per cent reduction target by 2050).1,2,3 Despite these
emissions at a time
                       trends, governments and industry tout increasing oil and gas production and exports as critically
 when Canada has
                       important for Canada’s economic future.
 committed to a 40
per cent reduction     The energy sector’s contribution to Canada’s GDP, currently at 9 per cent, has declined over the
          from 2005    past two decades, and government revenues from royalties and taxes have dropped precipi-
      levels by 2030   tously. Despite record production levels, royalty revenue is down 45 per cent since 2000, and
     and “net-zero”    tax revenues from the oil and gas sector, which totalled over 14 per cent of all industry taxes as
emissions by 2050.     recently as 2009, declined to less than 4 per cent in 2018. Direct employment, which peaked
                       at over 226,000 workers in 2014, was down by 53,000 in 2019 although production was at an
                       all-time high due to efficiencies adopted by the industry. In Alberta, which produces a large
                       proportion of Canada’s oil and gas, total non-renewable resource revenue was down 61 per cent
                       from 2000 levels in 2019, and 72 per cent on a revenue per barrel of oil equivalent basis.

                       At the same time, emissions from oil and gas production have continued to climb due to rec-
                       ord production levels, which is largely driven by expansion of exports. Even with substantial
                       reductions in emissions per barrel from the oil sands, along with reductions in fugitive methane
                       emissions from natural gas, growth in oil and gas production will result in Canada failing to meet
                       its emissions-reduction targets unless production is reduced.

                       1		 John Paul Tasker and Aaron Wherry, “Trudeau Pledges to Slash Greenhouse Gas Emissions
                           by at Least 40% by 2030,” CBC News, April 22, 2021, https://www.cbc.ca/news/politics/
                           trudeau-climate-emissions-40-per-cent-1.5997613.
                       2		 “Net-zero” refers to reducing emissions to zero through domestic emissions reductions, purchased carbon
                           offsets, and sequestration through carbon capture and storage (CCS) and direct air capture (DAC) of
                           emissions. CCS and DAC are technologies that have been demonstrated but not proven to be viable at the
                           scale required.
                       3		 Bill C-12 has not yet become law. As of April 16, 2021, it had received second reading in the House of
                           Commons. See https://openparliament.ca/bills/43-2/C-12/ (accessed April 26, 2021) and on April 27
                           Minister Catherine McKenna announced there would be five more hours of second reading, then the
                           discussion would be closed to further questions.

                   8                                                                                     CANADA’S ENERGY SECTOR
The Canada Energy Regulator’s (CER) forecasts for oil and gas production through 2050 show
concerning trends.4 In its Evolving Energy System Scenario (evolving scenario), which assumes
governments will continue to introduce new policies over time to address climate change and
emissions reduction, the oil and gas sector alone will cause Canada to exceed its Paris Agreement
emissions target of an 80 per cent reduction from 2005 levels by 2050, let alone the “net-zero”
target by 2050 adopted in Bill C-12. Even if emissions from all other sectors of the economy were
reduced to zero, emissions from oil and gas production would cause the country to miss an 80
per cent by 2050 reduction target by 32 per cent (assuming emissions per barrel in the oil sands
could be reduced by 30 per cent). In the CER’s Reference Energy System Scenario (reference
scenario), which assumes no new policies are adopted to reduce emissions, oil and gas produc-
tion on its own would result in Canada missing this target by 94 per cent.
Current emissions from oil and gas production account for 26 per cent of Canada’s total. As of Jobs are often cited by
2019, the most recent year for which data are available, Canada had only reduced its emissions industry proponents
by 1.2 per cent from 2005 levels. This modest reduction is primarily due to the phase-out of coal- as a reason to support
fired power in Ontario and Alberta, which has largely been replaced by natural gas in Alberta expansion of oil and
and nuclear power from refurbished reactors in Ontario. This was the “low-hanging fruit” for gas production.
our emissions reductions — the next tranche of emissions reductions to meet the 40 per cent Yet despite record
required by 2030 will be much more difficult. production levels,
jobs in the oil and
Recent growth in Canada’s emissions is the highest of any G7 country. Of the two G7 countries
gas sector are down.
that have increased emissions since the Paris Agreement was signed in 2016, Canada, at 3.3 per
cent, was the worst, followed by the US at 0.6 per cent.5 The other five G7 countries decreased
emissions from between 4.4 per cent (Italy) and 10.8 per cent (Germany).
Jobs are often cited by industry proponents as a reason to support expansion of oil and gas
production. Yet despite record production levels, jobs in the oil and gas sector are down from
their peak in 2014 by 23 per cent (Figure S1). Thanks to technological advances, the sector has
become more efficient and is able to increase production using fewer workers, meaning employ-
ment levels are unlikely to reach previous highs even as production grows. This jobs scenario is
particularly true in the oil sands, where much of the production growth is expected. Oil sands
production per employee is 70 per cent higher than it was in 2011 (production per employee has
increased by 37 per cent in conventional oil and gas and by 50 per cent in the sector overall since
2011). In Canada’s overall employment picture, the oil and gas sector accounted for only 1 per
cent of direct employment in 2019 (5.5 per cent in Alberta). So, while production is projected
to increase, efficiency and automation in the sector mean previous levels of employment are
unlikely to return.
Governments receive revenues from oil and gas production through royalties and taxes, as well
as lease sales. As noted above, while production has continued to increase, revenues received
by governments have fallen dramatically. Royalty revenues have decreased by 45 per cent since
2000 and by 62 per cent on a per barrel basis (Figures S2 and S3). Non-renewable resource
revenue in Alberta, where oil and gas production is highest, has fallen even more sharply — by
61 per cent since 2000 and by 72 per cent on a per barrel basis as of 2019. Revenue paid to
governments from oil and gas through taxes has also fallen from a high of more than 14 per cent
as a share of total industry taxes as recently as 2009 to less than 4 per cent in 2018 (Figure S4).
4 Canada Energy Regulator, Canada’s Energy Future 2020: Energy Supply and Demand Projections to 2050,
https://www.cer-rec.gc.ca/en/data-analysis/canada-energy-future/2020/index.html.
5 United Nations, National Inventory Submissions 2021, https://unfccc.int/ghg-inventories-annex-i-parties/2021.
A CORPORATE MAPPING PROJECT REPORT 9Figure S1: Employment in the oil and gas industry in Canada by sector component from 2011 to 2019,
based on PetroLMI data (LHS)
Also shown is oil and gas production over the period (RHS).
Notes: 2019 is a forecast and 2018 is an estimate.
LHS = left-hand side; RHS = right-hand side.
Source: Employment data from Petroleum Labour Market Information, 2019 Oil and Gas Labour Market Update (Calgary: PetroLMI, 2019) and
earlier labour market updates, https://careersinoilandgas.com/wp-content/uploads/2019/06/2019_Labour_Market_Update_Public_
Spreadsheet_FINAL.xlsx (accessed June 10, 2020). Production data from Canadian Association of Petroleum Producers, Statistical
Handbook, https://www.capp.ca/resources/statistics/ (accessed October 21, 2020).
Figure S2: Royalty revenue from oil and gas production by province from 2000 to 2019 (LHS)
Total Canadian oil and gas production is also shown (RHS).
Notes: “Oil sands” is primarily Alberta oil sands and “offshore” is Newfoundland offshore.
Source: Canadian Association of Petroleum Producers, Statistical Handbook, https://www.capp.ca/resources/statistics/ (accessed October 21, 2020).
10 CANADA’S ENERGY SECTORFigure S3: Royalty revenue from oil and gas production by province in dollars per barrel of oil equivalent (BOE)
from 2000 to 2019
Note: “Oil sands” refers primarily to Alberta oil sands.
Source: Canadian Association of Petroleum Producers, Statistical Handbook, https://www.capp.ca/resources/statistics/ (accessed October 22, 2020).
Figure S4: Tax contribution of the oil and gas sector as a percentage of total industrial taxes paid by industry
in Canada from 2000 to 2018
Source: Statistics Canada, Table 33-10-0006-01, https://www150.statcan.gc.ca/t1/tbl1/en/tv.action?pid=3310000601 (accessed August 25, 2020).
A CORPORATE MAPPING PROJECT REPORT 11The CER projects electricity for end-use energy demand will increase from the 2019 level of
16.3 per cent to 26.5 per cent by 2050, primarily through growth in wind and solar genera-
tion. However, it also projects a continued heavy reliance on fossil fuels. In 2019, 77 per cent
of Canada’s end-use energy came from fossil fuels, and the CER projections show that level
dropping to just 64 per cent by 2050. The smaller share of energy use that belongs to electricity
is a significant challenge for reducing Canada’s emissions, and strengthening policies such as
building retrofits and more efficient transportation infrastructure that reduce energy consump-
tion must be a major part of the solution.
Although domestic consumption of fossil fuels is projected by CER to decrease over time, pro-
duction is projected to continue climbing due to a dramatic rise in oil and gas exports. From
2019 levels, the CER evolving scenario projects net exports of oil and gas to grow by 42 per cent
and 186 per cent, respectively, by 2050. It is clear that the only way Canada can meet its climate
change commitments is by decreasing production of oil and gas from these projected levels.
Canada’s existing plans to build pipelines and other export infrastructure to facilitate production
growth must change to meet its emissions-reduction targets:
• Using the CER estimates of existing pipeline export capacity and its evolving scenario
production, neither the Trans Mountain pipeline expansion (TMX) nor the recently
cancelled Keystone XL pipeline are needed. Cancelling the taxpayer-funded TMX pro-
Canada’s existing ject will save $12.6 billion6 (less funds spent to date) that could be spent on aggressive
plans to build emissions-reduction measures.
pipelines and • If 420 thousand barrels per day (kbpd) of announced expansions on existing export
other export pipelines, which were not included in the CER estimate of existing export capacity,
infrastructure are added, the 330 kbpd Enbridge Line 3 expansion project now under construction
to facilitate in Minnesota is not needed either. (Announced expansions include 190 kbpd on the
production growth existing Enbridge mainline, 140 kbpd through reversal of Enbridge’s Southern Lights
must change to pipeline, and 90 kbpd remaining on a permit for expansion of the capacity of the exist-
meet its emissions- ing TC Energy Keystone pipeline.)
reduction targets. • Developing a liquefied natural gas (LNG) export industry in BC will render BC’s CleanBC
plan impossible to achieve. The CER evolving scenario forecast for BC would mean that
its oil and gas sector alone would exceed the CleanBC 2050 target by 93 per cent, even
if every other sector of the BC economy reduced emissions to zero. If emissions from the
three LNG export terminals now either proposed or under construction are included, BC
would miss its 2050 target by 147 per cent. Despite the emissions implications, both the
BC and federal governments have provided subsidies for BC LNG exports.
The CER evolving scenario clearly shows oil and gas production growth will result in certain
failure to meet Canada’s emissions-reduction targets, so a stark change in direction is needed.
The good news is that production growth is not related to energy needs at home, as domestic
demand in Canada for oil and gas is projected to drop in the years and decades ahead. Rather, it
is oil and gas exports that are driving the projected production growth.
Although the Canadian government intends to rely on carbon capture and storage (CCS) to
achieve a significant part of its targets,7 as well as purchasing carbon offsets, there are serious
questions as to the efficacy of that approach. CCS has been demonstrated at small scales com-
6 Canadian dollars unless otherwise indicated.
7 Joel Dryden, “When asked about emission targets, Freeland says carbon capture plans will
‘turbocharge’ industry,” CBC, April 25, 2021, https://www.cbc.ca/news/canada/calgary/
chrystia-freeland-duane-bratt-alberta-carbon-capture-1.6001762.
12 CANADA’S ENERGY SECTORpared to the reductions required, and much of the captured carbon dioxide has been used for
enhanced oil recovery. This use of industrial carbon removal (ICR) has led researchers to con-
clude: “We found that the commercial ICR (C-ICR) methods being incentivized by governments
are net CO2 additive: CO2 emissions exceed removals.”8 The practice of purchasing carbon
offsets is also controversial, as it does not result in net emissions reductions in many cases.9
Canada, as a northern country with high heating loads in the winter, does face a significant chal-
lenge in reducing emissions by meeting domestic energy use exclusively with renewables like
wind and solar energy. That means some fossil fuels will likely need to be part of the country’s
energy mix for the foreseeable future. As noted above, in 2019, 77 per cent of our end-use energy
demand came from fossil fuels. The CER evolving scenario shows that rate dropping to 64 per
cent by 2050, which still amounts to a significant share of domestic energy consumption. Oil and
gas are finite resources and Western Canada, where most of these resources are produced, is a If oil and gas
mature exploration region. Given that these resources will be needed at some level for the fore- production
seeable future, and that they are a major source of emissions, we should be retaining remaining increases will not
resources to meet our own needs rather than expanding the export market. result in strong
growth in jobs
Clearly, if Canada is to have any hope of meeting its emissions-reduction targets, the oil and gas
production sector will have to reduce emissions to a level far below what is projected in the CER
and government
evolving scenario production forecast. Cutting production will have some economic impacts, revenues and
even though the economic contributions from oil and gas production have already declined will result in
markedly in the past two decades. The industry certainly won’t disappear, as Canadians will Canada missing
need oil and gas at some level for decades, and reducing production will prolong the lifespan of its emissions-
these finite resources for Canada’s domestic use. reduction targets,
why would the
The need to radically reduce fossil fuel production to meet net-zero targets has also been rec-
country allow
ognized by the International Energy Agency (IEA) in its recent Net-zero by 2050 report.10 The
these increases
IEA concluded:
to happen?
• “Net zero means a huge decline in the use of fossil fuels. They fall from almost four‐fifths
of total energy supply today to slightly over one‐fifth by 2050.”
• “Beyond projects already committed as of 2021, there are no new oil and gas fields
approved for development in our pathway, and no new coal mines or mine extensions
are required. Unabated coal demand declines by 90% to just 1% of total energy use in
2050. Gas demand declines by 55% to 1,750 billion cubic metres and oil declines by 75%
to 24 million barrels per day (mb/d), from around 90 mb/d in 2020.”
• “Making net‐zero emissions a reality hinges on a singular, unwavering focus from all
governments — working together with one another, and with businesses, investors
and citizens.”
The IEA’s report underscores the contradiction between Canada’s commitment to achieving
net-zero by 2050 and its policies of building export pipelines to facilitate increased production
and the development of an LNG export industry.
8 June Sekera and Andreas Lichtenberger, “Assessing Carbon Capture: Public Policy, Science, and
Societal Need,” Biophysical Economics and Sustainability 5, no. 14 (2020), https://doi.org/10.1007/
s41247-020-00080-5.
9 Robert Watt, “The Fantasy of Carbon Offsetting,” Environmental Politics (2021): 1–20,
https://www.tandfonline.com/doi/full/10.1080/09644016.2021.1877063.
10 International Energy Agency, May, 2021, Net Zero by 2050: A Roadmap for the Global Energy Sector,
https://www.iea.org/reports/net-zero-by-2050.
A CORPORATE MAPPING PROJECT REPORT 13With respect to the oil and gas production sector, a credible plan to reduce emissions must
include the following:
• Reduce or eliminate the growth in production for exports that is projected through 2050
by CER in its evolving scenario, which forecasts that net oil exports will grow 42 per cent
and net gas exports will grow 186 per cent over the 2019 to 2050 period.
• Reduce current exports to the extent possible to reduce the production emissions assoc
iated with them. Some 53 per cent of 2019 net oil production was exported along with
15 per cent of net natural gas production.
• Cancel export pipeline projects that are not needed as evidenced by the CER evolving
scenario projection, including TMX and the Line 3 expansion. Cancelling TMX would
save $12.6 billion tax dollars (less expenses to date), which could then be devoted to
investments in infrastructure to give Canadians an alternative to high levels of energy
consumption.
Providing incentives to reduce consumption in all sectors and encourage growth in carbon-free
energy must, of course, be emphasized. However, these incentives will not achieve emissions-re-
duction targets on their own unless oil and gas production emissions are also reduced compared
to current projections.
Canada must take a step back and look at the big picture of emissions sources and the possibil-
ities for reducing them. If oil and gas production increases will not result in strong growth in
jobs and government revenues and will result in Canada missing its emissions-reduction targets,
why would the country allow these increases to happen? The path ahead to achieve Canada’s
emissions-reduction targets will be difficult, and reducing emissions from the energy sector will
be a critical part of the solution.
14 CANADA’S ENERGY SECTORIntroduction
CANADA’S ENERGY SECTOR HAS BEEN HERALDED as a critical part of the economy, even though Despite the federal
oil and gas production is one of the largest contributors to Canadian emissions of greenhouse government’s
gas. The Intergovernmental Panel on Climate Change has warned in a recent report that global commitment
emissions of carbon must be eliminated over the next few decades to limit warming to 1.5 Celsius to reducing
above pre-industrial levels and avoid the worst impacts of climate change.11 In order to address emissions by
this, the federal government has recently committed to reduce emissions to net-zero by 2050, an more than 30 per
increase from its earlier commitment of an 80 per cent reduction by then. The question of how
cent from 2005
emissions from the upstream production of oil and gas can be reconciled with emissions-reduc-
levels by 2030,
tion targets has not been addressed.
emissions were
The energy sector contributed about 9 per cent of Canada’s gross domestic product (GDP) in down just 1.2 per
2019, a share that has been declining even though oil and gas production has been increasing. cent as of 2019.
Royalty revenue returned by the oil and gas sector to government has plummeted and employ-
ment in the sector has also been declining.
At the same time, emissions from oil and gas production constituted 26 per cent of Canada’s
total in 2019 (the most recent year for which data are available) and are forecast to continue
to grow, even with technological improvements in oil sands production. Despite the federal
government’s commitment to reducing emissions by more than 30 per cent from 2005 levels by
2030, emissions were down just 1.2 per cent as of 2019. And the government has introduced Bill
C-12 calling for net-zero emissions in 2050.
Forecasts by the Canada Energy Regulator (CER) show that, even with improved technology and
additional climate policies, Canada’s emissions from the oil and gas sector alone are likely to ex-
ceed a target of an 80 per cent reduction by 2050 by 32 per cent. Without improved technology,
and assuming the CER business-as-usual production forecast, emissions from the oil and gas
sector would exceed this target by 94 per cent.
Clearly, increasing oil and gas production as projected in the CER forecasts, even with additional
climate policies, is incompatible with reaching the government’s net-zero emissions target by
2050. This report assesses the current state of Canada’s energy sector, its contributions to the
Canadian economy, forecasts of future production and emissions and their implications for
energy megaprojects. The report also makes recommendations for the future given Canada’s
climate commitments.
11 Intergovernmental Panel on Climate Change, Global Warming of 1.5°C. An IPCC Special Report on the Impacts
of Global Warming of 1.5°C above Pre-Industrial Levels and Related Global Greenhouse Gas Emission Pathways, in
the Context of Strengthening the Global Response to the Threat of Climate Change, Sustainable Development, and
Efforts to Eradicate Poverty (IPCC, 2019) https://www.ipcc.ch/sr15/.
A CORPORATE MAPPING PROJECT REPORT 15Status and evolution
of the energy sector
77.2 per cent AS A PREFACE TO ASSESSING THE CONTRIBUTION OF THE ENERGY SECTOR to the Canadian economy,
of Canada’s the following section reviews the supply and emissions from Canada’s energy consumption and
consumption compares them to other countries globally. The evolution of oil and gas production, much of
in 2019 was which is exported, is also reviewed.
provided by fossil
Despite the exponential growth of non-hydro renewable energy from solar, wind, biomass,
fuels — natural biofuels and geothermal energy sources, fossil fuels in 2019 amounted to 84 per cent of primary
gas and refined energy consumption globally (Figure 1a) and 66 per cent of Canadian consumption (Figure 1b).
petroleum Although non-hydro renewable energy has grown rapidly since 2005, it still made up only 5 per
products — and cent of global consumption and 3.7 per cent of Canadian consumption in 2019.
only 16.3 per cent
Canada is the third-largest producer of hydro power in the world after China and Brazil. Thanks
by electricity.
to its hydro and nuclear generation, Canada’s electricity sector has relatively low-carbon emis-
sions compared with countries that are much more dependent on fossil fuels, such as the US.
Nonetheless, without major investments in building new nuclear power plants and refurbishing
plants nearing retirement age, Canada will have no nuclear capacity by 2036.12 New hydro dams
face increasing opposition.
In terms of end-use energy demand, 77.2 per cent of Canada’s consumption in 2019 was pro-
vided by fossil fuels — natural gas and refined petroleum products — and only 16.3 per cent by
electricity (Figure 2). The share of end-use energy consumption provided by electricity is similar
in most “developed countries.”
Figure 2 also illustrates end-use energy consumption by utilization sector. The industrial sector
consumed over half of end-use energy, followed by the transportation sector at 23 per cent, the
residential sector at 14 per cent and commercial sector at 12 per cent.
In terms of per capita energy consumption, the “developed world” consumes far more energy
than the developing world. Countries in the Organization for Economic Co-operation and
Development (OECD), which represent 17 per cent of the world’s population, consumed 3.3
12 J. David Hughes, Canada’s Energy Outlook: Current Realities and Implications for a Carbon-Constrained Future
(Vancouver: Canadian Centre for Policy Alternatives–BC Office, 2018), https://energyoutlook.ca/.
16 CANADA’S ENERGY SECTORFigure 1a: Global primary energy consumption by fuel in 2019 with a comparison to the growth of total non-hydro
renewable energy (excluding traditional biomass) from 1995 to 2019
Note: Primary energy includes the losses from fossil fuel generation of electricity, so direct sources of electricity such as hydro, solar and wind
have been increased by 2.63 times to make them comparable to fossil fuel–generated electricity at a thermal efficiency of 38 per cent.
Non-hydro renewables combined made up just 37 per cent of the overall increase in global primary energy consumption between 2010
and 2019. Traditional biomass is excluded because it is expected to be phased out.
Source: Data from bp Statistical Review of World Energy 2020 (London: bp plc, 2020), https://www.bp.com/content/dam/bp/business-sites/en/
global/corporate/pdfs/energy-economics/statistical-review/bp-stats-review-2020-full-report.pdf.
Figure 1b: Canadian primary energy consumption by fuel in 2019 with a comparison to the growth of non-hydro
renewable energy (excluding traditional biomass) from 1995 to 2019
Note: Primary energy includes the losses from fossil fuel generation of electricity, so direct sources of electricity such as hydro, solar and wind have
been increased by 2.63 times to make them comparable to fossil fuel–generated electricity at a thermal efficiency of 38 per cent. Non-hydro
renewables combined made up just 43 per cent of the increase in Canadian primary energy consumption between 2010 and 2019.
Source: Data from bp Statistical Review of World Energy 2020 (London: bp plc, 2020), https://www.bp.com/content/dam/bp/business-sites/en/
global/corporate/pdfs/energy-economics/statistical-review/bp-stats-review-2020-full-report.pdf.
A CORPORATE MAPPING PROJECT REPORT 17Figure 2: End-use energy demand in Canada by fuel source and sector in 2019
Source: Canada Energy Regulator, “Canada’s Energy Future Data Appendices,” Canada’s Energy Future 2020: Energy Supply and Demand
Projections to 2050, https://apps.cer-rec.gc.ca/ftrppndc/dflt.aspx?GoCTemplateCulture=en-CA.
Figure 3: Energy consumption per capita by country in 2019
Source: bp Statistical Review of World Energy 2020 (London: bp plc, 2020), https://www.bp.com/content/dam/bp/business-sites/en/global/
corporate/pdfs/energy-economics/statistical-review/bp-stats-review-2020-full-report.pdf.
18 CANADA’S ENERGY SECTORtimes as much energy per capita in 2019 as the 83 per cent of the population in non-OECD
countries (Figure 3). Canadians rank among the highest per capita energy consumers in the
world, at five times the world average and 32 per cent higher than Americans.
Given the correlation between economic development and energy consumption, developing
countries aspire to ever-increasing levels of energy consumption. In the “developed world,”
energy consumption is flat or declining due to increased efficiency. The COVID-19 pandemic has
resulted in a significant decline in energy consumption globally, but this effect is expected to be
temporary. China, for example, has already increased consumption to 2019 levels.
Due to the high reliance on fossil fuels for end-use energy consumption illustrated in Figure 2,
Canadians are also among the top per capita emitters from fossil fuel combustion. Canadians
emitted 3.4 times the world average in 2019, and OECD countries emitted 2.7 times the emis-
sions per capita of non-OECD countries (Figure 4). Canadians emit slightly less than Americans
on a per capita basis due to the high proportion of hydropower in Canada’s electricity supply.
Oil production in Canada began in earnest in the late 1940s (although small amounts have been
produced in Ontario since 1858) and rose rapidly to a production peak of conventional oil in
1972 (Figure 5). Although the advent of fracking over the past decade has allowed conventional
oil production to increase slightly, it has never exceeded the 1972 peak. Virtually all oil produc-
tion growth in Western Canada since the early 1980s has come from bitumen and synthetic oil
production from the oil sands, which accounted for 58 per cent of Canadian production in 2019.
Offshore production in Newfoundland and Labrador began in the 1990s.
Figure 4: Emissions per capita from fossil fuel combustion by country in 2019
Source: bp Statistical Review of World Energy 2020 (London: bp plc, 2020), https://www.bp.com/content/dam/bp/business-sites/en/global/
corporate/pdfs/energy-economics/statistical-review/bp-stats-review-2020-full-report.pdf.
A CORPORATE MAPPING PROJECT REPORT 19Figure 5: Oil production in Canada by province from 1947 through 2019
Source: Canadian Association of Petroleum Producers, Statistical Handbook, https://www.capp.ca/resources/statistics/ (accessed
October 15, 2020).
Figure 6: Marketed natural gas production in Canada by province from 1947 through 2019
Source: Canadian Association of Petroleum Producers, Statistical Handbook, https://www.capp.ca/resources/statistics/ (accessed
October 15, 2020).
Alberta is by far the largest oil-producing province and accounted for 81 per cent of total produc-
tion in 2019, followed by Saskatchewan at 10 per cent, the East Coast and Territories at 5.3 per
cent, BC at 3.5 per cent and Manitoba at 0.9 per cent.
20 CANADA’S ENERGY SECTORNatural gas production also began in Canada in the late 1940s and rose to a production peak
in 2001 (Figure 6). Although Alberta produced 63 per cent of Canada’s gas in 2019, the ad-
vent of high-volume fracking combined with horizontal drilling since 2007 has allowed access
to low-permeability tight- and shale-gas deposits, particularly in BC. Most of the growth in
Canadian production in recent years has come from northeastern BC. Although there has been
some gas production since the late 1990s from the Sable Offshore Energy Project in Nova Scotia,
it has recently been permanently shut down.13
In addition to oil and gas, liquids are often produced in conjunction with natural gas. These
include condensate, pentanes plus, propane and butane. Figure 7 illustrates the total energy
from oil and gas produced in Canada. Marketed natural gas has been converted to barrels of
oil equivalent (on an energy basis, 6,000 cubic feet of marketed natural gas is equivalent to one
barrel of oil). On an energy basis, 55 per cent of Canadian energy production comes from oil, 34
per cent from gas and 11 per cent from natural gas liquids. Oil sands amount to 38 per cent of the
total oil and gas energy production in Canada.
At current prices, oil is worth about three times as much as gas on an energy-equivalent basis. This
difference in value can be attributed to the utility of oil as a transportation fuel and for other uses.
Figure 7: Oil and gas production in Canada by product type from 1947 through 2019
Source: Canadian Association of Petroleum Producers, Statistical Handbook, https://www.capp.ca/resources/statistics/ (accessed
October 15, 2020).
13 “Sable Offshore Energy Project Permanently Shuts Down after Nearly 20 Years,” CTV News, January 1, 2019,
https://www.ctvnews.ca/business/sable-offshore-energy-project-permanently-shuts-down-after-nearly-
20-years-1.4236819.
A CORPORATE MAPPING PROJECT REPORT 21Contributions of the
energy sector to the
Canadian economy
Despite rapid THE ENERGY SECTOR CONTRIBUTES TO THE CANADIAN ECONOMY in terms of GDP, jobs, non-re-
production newable resource payments to provincial governments and corporate taxes. The following
growth between section reviews these contributions and their trends over the past two decades.
1997 and 2019,
the contribution of
the energy sector Gross domestic product
to the Canadian
economy has The contribution of the energy sector to Canada’s GDP is illustrated in Figure 8. Total Canadian
declined. GDP in 2019 was $1,970 billion, of which the energy sector contributed $180 billion, or 9.16 per
cent. The growth rate of the energy sector between 1997 and 2019, at 1.49 per cent per year, was
much slower than the growth rate of the overall economy at 2.37 per cent and the growth rate of
the non-energy sector component at 2.49 per cent.
Although Statistics Canada’s definition of the “energy sector” includes coal mining and other
activities not strictly related to oil and gas, the production and refining of oil and gas along with
petrochemicals and agricultural products made from oil and gas account for three-quarters of
the energy sector’s contributions to total GDP, as illustrated in Figure 9.
Despite rapid production growth between 1997 and 2019 (see Figure 7), the contribution of the
energy sector to the Canadian economy has declined from 11 per cent in 1997 to 9.16 per cent in
2019, as illustrated in Figure 10. The energy sector in Alberta was by far the largest contributor,
but despite the ramp-up in oil sands production over the past 20 years, the proportional contri-
bution of even Alberta’s energy sector to Canadian GDP has declined since 1997.
22 CANADA’S ENERGY SECTORFigure 8: Growth rate of Canada’s energy sector compared with the non-energy sector and Canada’s overall GDP
from 1997 to 2019
Note: Chained dollars refers to inflation-adjusted 2012 dollars.
Source: Statistics Canada, Table 36-10-0402-01, https://www150.statcan.gc.ca/t1/tbl1/en/tv.action?pid=3610040201 (accessed June 27, 2020).
Figure 9: Contributions of Canada’s energy sector to GDP by component from 2007 to 2019
Source: Statistics Canada, Table 36-10-0402-01, https://www150.statcan.gc.ca/t1/tbl1/en/tv.action?pid=3610040201 (accessed June 27, 2020).
A CORPORATE MAPPING PROJECT REPORT 23Figure 10: Energy sector share of Canada’s total GDP by province from 1997 to 2019
Note: Oil sands contributions were not reported separately until 2007.
Source: Statistics Canada, Table 36-10-0402-01, https://www150.statcan.gc.ca/t1/tbl1/en/tv.action?pid=3610040201 (accessed June 27, 2020).
Figure 11: Energy sector share of total provincial GDP by province from 1997 to 2019
Source: Statistics Canada Table 36-10-0402-01, https://www150.statcan.gc.ca/t1/tbl1/en/tv.action?pid=3610040201 (accessed June 27, 2020).
The contribution of the energy sector to the GDP of individual provinces is highly variable,
which is to be expected given the fact that a large proportion of production is concentrated in
Alberta, Saskatchewan and BC. The energy sector constituted 30 per cent of Alberta’s GDP in
2019 and 33 per cent in Newfoundland, compared with 22 per cent in Saskatchewan and 6 per
cent in BC. Figure 11 illustrates the percentage contribution of the energy sector by province
from 1997 to 2019.
24 CANADA’S ENERGY SECTORRevenue provided to provincial governments
Revenue collected by provincial governments from the production of non-renewable resources
like oil and gas includes royalties, sales of Crown leases, rentals and fees. Royalties are by far the
largest revenue component in most provinces.
Figure 12 illustrates the total royalty revenue paid to provincial governments from oil and gas
production over the 2000 to 2019 period, calculated in billion dollars per year. Despite an increase
of 47 per cent in oil and gas production, total royalty payments collected in Canada fell by 45 per
cent. This means Canada is selling off its non-renewable energy resources for ever-lower returns.
Politicians claim that oil and gas production is needed to fund roads and hospitals, but clearly oil
and gas production is providing less and less revenue despite the increasing pace of extraction.
Figure 12: Royalty revenue from oil and gas production by province from 2000 to 2019 (LHS)
Total Canadian oil and gas production is also shown (RHS).
Note: “Oil sands” is primarily Alberta oil sands and “offshore” is Newfoundland offshore.
Source: Canadian Association of Petroleum Producers, Statistical Handbook, https://www.capp.ca/resources/statistics/ (accessed
October 21, 2020).
Figure 13 illustrates the royalty revenue paid to western provincial governments, and Canada
as a whole, from oil and gas production over the 2000 to 2019 period, calculated in dollars per
barrel of oil equivalent (BOE). On a per-barrel basis, royalty revenue received from selling off
non-renewable oil and gas resources has gone down by 62 per cent since 2000.
A CORPORATE MAPPING PROJECT REPORT 25Figure 13: Royalty revenue from oil and gas production by province in dollars per barrel of oil equivalent (BOE)
from 2000 to 2019
Note: “Oil sands” refers primarily to Alberta oil sands.
Source: Canadian Association of Petroleum Producers, Statistical Handbook, https://www.capp.ca/resources/statistics/ (accessed
October 22, 2020).
Figure 14: Non-renewable resource revenue in Alberta by component from 2000 to 2019 (LHS)
Also shown is revenue received per barrel of oil equivalent (BOE) produced (RHS).
Source: Revenue data from Government of Alberta, “2020 Historic Royalty Summary Revenue Workbook,” https://open.alberta.ca/
dataset/382b7a1e-9c34-47c7-9531-38e67ca5441d/resource/94ddf42e-aeb4-4cd1-a0b4-c63c627ebb60/download/energy_royalty_
revenue_workbook.xlsx (accessed January 4, 2021). Production data from Canadian Association of Petroleum Producers, Statistical
Handbook, https://www.capp.ca/resources/statistics/ (accessed September 27, 2020).
26 CANADA’S ENERGY SECTORAlberta provides one of the most complete accounts of revenue received from the sale of
non-renewable resources, and is the largest producer by far, so it is instructive to look at revenue
trends in that province. Figure 14 breaks down Alberta’s non-renewable resource revenue from Ramping up
royalties, lease sales, rentals and fees, as well as the cost of incentive programs. production
is providing
Despite a 42 per cent increase in oil and gas production in Alberta from 2000 to 2019, total
Canadians with
non-renewable resource revenue is down 61 per cent, and revenue per barrel of oil equivalent
diminishing
produced is down by 72 per cent over this period. Even if the environmental and emissions
implications of maintaining and increasing production are ignored (which are discussed in a
returns.
following section), ramping up production is providing Canadians with diminishing returns.
Employment
Politicians hold out jobs as a key reason for maintaining and increasing oil and gas production.
However, the number of jobs has declined since 2014 even as production has increased. Figure
15 illustrates employment by component in the oil and gas sector, including retail sales.
Figure 15: Direct employment by component in the oil and gas sector in Canada from 2001 to 2019
Note: The figure shows jobs in production, distribution, wholesale and retail. Support activities include some mining jobs. The petroleum and
coal product manufacturing component includes some jobs in coal product manufacturing.
Source: Statistics Canada, Table 14-10-0202-01, https://www150.statcan.gc.ca/t1/tbl1/en/tv.action?pid=1410020201 (accessed August 2, 2020).
A CORPORATE MAPPING PROJECT REPORT 27Figure 16: Employment in the oil and gas sector by province (excluding gasoline stations) as a percentage of total
industrial employment from 2001 to 2019
Source: Statistics Canada, Table 14-10-0202-01, https://www150.statcan.gc.ca/t1/tbl1/en/tv.action?pid=1410020201 (accessed August 2, 2020).
Figure 16 illustrates oil and gas employment as a percentage of all industry jobs in each prov-
ince. As expected, given its dominance in production, Alberta depends most heavily on jobs in
oil and gas at 5.5 per cent of employment in 2019. Next were Saskatchewan at 2 per cent and
Newfoundland at 1.3 per cent. Overall, the oil and gas sector accounts for about 1 per cent of
Canadian employment and less than 0.5 per cent in BC and the rest of Canada.
Employment data from Petroleum Labour Market Information (PetroLMI)14 is broadly similar to
employment data from Statistics Canada but includes data provided by industry that is somewhat
Overall, the oil different. PetroLMI subdivides employment data into different categories than Statistics Canada,
and gas sector which allows a breakdown into exploration and production, oil sands, oil and gas services, and
accounts for pipelines.
about 1 per cent
Figure 17 illustrates oil and gas employment by province based on PetroLMI data. Some 53,119
of Canadian
jobs, or 23 per cent of the labour force, were lost between peak employment of 226,460 in 2014
employment and and 2019 — even though production rose 24 per cent to a record high over the same period.
less than 0.5 per Alberta accounted for 83 per cent of total Canadian oil and gas employment in 2019; BC and
cent in BC and the Saskatchewan, 6 per cent each; and the rest of Canada, 5 per cent.
rest of Canada.
Figure 18 illustrates employment by oil and gas sector component. Even though oil sands
accounted for 38 per cent of oil and gas energy produced in Canada, oil sands employment
accounted for only 15 per cent of employment in the industry. Employment in conventional oil
and gas extraction accounted for 35 per cent of total employment, services for 43 per cent and
pipelines for 5 per cent.
As noted above, despite job losses of more than 53,000 since 2014, production is at all-time
highs. Digitalization, including the use of artificial intelligence, has made the industry much
14 Petroleum Labour Market Information, What Is LMI, accessed June 10, 2020, www.careersinoilandgas.com.
28 CANADA’S ENERGY SECTORYou can also read