Canadian Demographics at a Glance Second edition - Statistics Canada
←
→
Page content transcription
If your browser does not render page correctly, please read the page content below
Catalogue no. 91-003-X
ISSN 1916-1832

Canadian Demographics at a Glance

Second edition

by Demography Division

Release date: February 19, 2016
How to obtain more information
For information about this product or the wide range of services and data available from Statistics Canada, visit our website,
www.statcan.gc.ca.

You can also contact us by

email at STATCAN.infostats-infostats.STATCAN@canada.ca

telephone, from Monday to Friday, 8:30 a.m. to 4:30 p.m., at the following toll-free numbers:
   •• Statistical Information Service                                                                 1-800-263-1136
   •• National telecommunications device for the hearing impaired                                     1-800-363-7629
   •• Fax line                                                                                        1-877-287-4369

Depository Services Program
   •• Inquiries line                                                                                  1-800-635-7943
   •• Fax line                                                                                        1-800-565-7757

Standards of service to the public                                      Standard table symbols
Statistics Canada is committed to serving its clients in a prompt,      The following symbols are used in Statistics Canada
reliable and courteous manner. To this end, Statistics Canada has       publications:
developed standards of service that its employees observe. To
                                                                        .     not available for any reference period
obtain a copy of these service standards, please contact Statistics
                                                                        ..    not available for a specific reference period
Canada toll-free at 1-800-263-1136. The service standards are
                                                                        ...   not applicable
also published on www.statcan.gc.ca under “Contact us” >
                                                                        0     true zero or a value rounded to zero
“Standards of service to the public.”
                                                                        0s    value rounded to 0 (zero) where there is a meaningful
                                                                              distinction between true zero and the value that was rounded
                                                                        p
                                                                              preliminary
Note of appreciation                                                    r
                                                                              revised
Canada owes the success of its statistical system to a                  x     suppressed to meet the confidentiality requirements
long‑standing partnership between Statistics Canada, the                      of the Statistics Act
citizens of Canada, its businesses, governments and other               E
                                                                              use with caution
institutions. Accurate and timely statistical information could not     F     too unreliable to be published
be produced without their continued co‑operation and goodwill.          *     significantly different from reference category (p < 0.05)

                                Published by authority of the Minister responsible for Statistics Canada

                                                       © Minister of Industry, 2016

              All rights reserved. Use of this publication is governed by the Statistics Canada Open Licence Agreement.

                                                   An HTML version is also available.

                                            Cette publication est aussi disponible en français.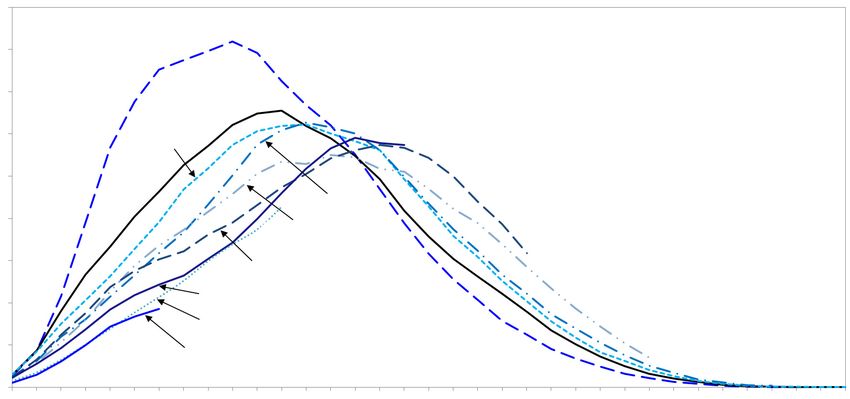
Table of contents
Table of contents
Introduction ............................................................................................................................................. 2
Section one: Population growth and age structure ............................................................................... 3
Population growth ...................................................................................................................................................... 4
Age structure ................................................................................................................................................................ 8
Section two: Composition of the population ........................................................................................ 15
Fertility .......................................................................................................................................................................... 16
Mortality ...................................................................................................................................................................... 22
Migration ..................................................................................................................................................................... 27
Section three: Composition of the population ..................................................................................... 33
Ethnocultural diversity ............................................................................................................................................... 34
Aboriginal population ............................................................................................................................................... 40
Demolinguistic characteristics ................................................................................................................................... 43
Labour force ............................................................................................................................................................... 47
Families ........................................................................................................................................................................ 50
Section four: Regional portrait .............................................................................................................. 55
Provinces and territories ............................................................................................................................................ 56
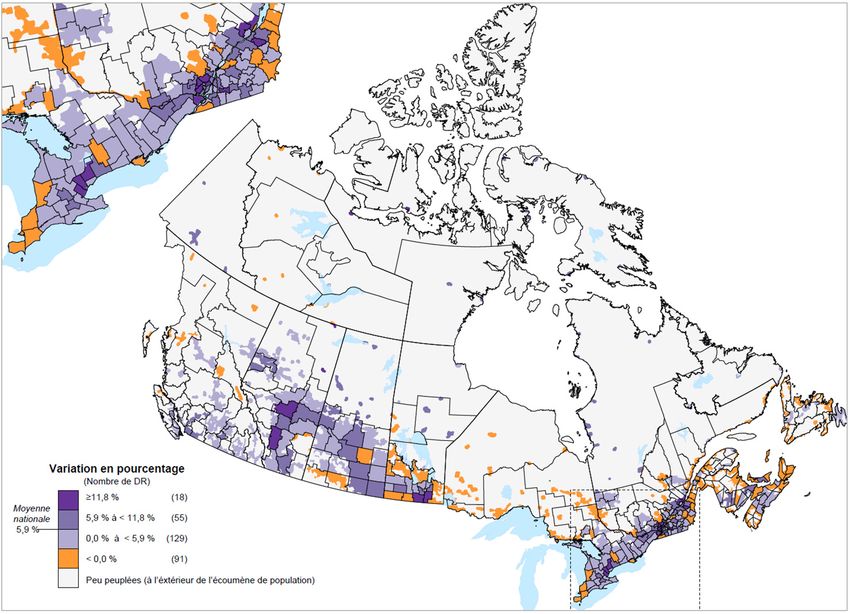
Subprovincial .............................................................................................................................................................. 68
Glossary .................................................................................................................................................. 74
Acknowledgements
The demographic information presented in the second edition of Canadian Demographics at a Glance come primarily
from existing products published by Demography Division at Statistics Canada, as well as other sources such
as the 2011 Census of Population and 2011 National Household Survey. I would like to thank the authors of these studies
and reports which made the production of this compendium possible.
I would also like to thank the editors of this second edition, Anne Milan, Carol D’Aoust and France-Pascale Ménard,
for selecting and preparing the demographic information included in this compendium, for updating the indicators,
and for managing the overall production.
Finally, I would like to thank all the persons who provided support in various ways: Jane Badets, Nora Bohnert,
Jonathan Chagnon, Yvan Clermont, Ian Holmes, Stéphanie Langlois and Stephanie Willbond, as well as Judy McAuley
and the dissemination team.
Laurent Martel
Chief, Demographic Analysis and Projections Section
Demography Division
Statistics Canada — Catalogue no. 91-003-X -1- Canadian Demographics at a Glance - Second Edition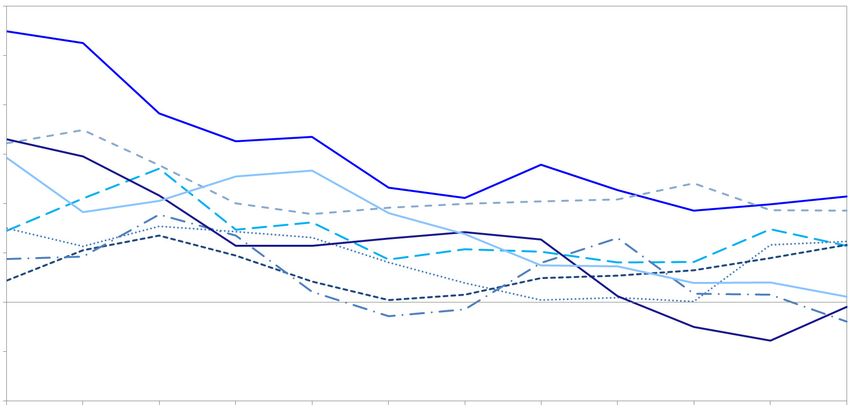
Introduction

                                                    Introduction

This second edition of Canadian Demographics at a Glance updates and expands the data and analyses found in the first
edition.
This compendium is comprised of four sections, beginning in Section one with an overview of Canada’s total
population growth, as well as the age and sex structure. Section two examines the three components of population
growth, that is, fertility, mortality and migration—including immigration, non-permanent residents and emigration.
In Section three, other aspects related to the composition of the Canadian population are analyzed including ethnocultural
diversity, language, Aboriginal identity, the labour force and families and households. Finally, Section four examines
selected demographic characteristics for the provinces, territories and some subprovincial areas.
The data and analyses come primarily from Demography Division, more specifically from the following publications:
   • Report on the Demographic Situation in Canada (Catalogue no. 91-209)
   • Annual Demographic Estimates: Canada, Provinces and Territories (Catalogue no. 91-215)
   • Annual Demographic Estimates: Subprovincial Areas (Catalogue no. 91-214)
   • Population Projections for Canada, Provinces and Territories (Catalogue no. 91-520)
   • “Projected Trends to 2031 for the Canadian Labour Force”, article in Canadian Economic Observer, volume 24,
     no. 8 (Catalogue no. 11-010)
   • Projections of the Diversity of the Canadian Population (Catalogue no. 91-551)
   • Population Projections by Aboriginal Identity in Canada (Catalogue no. 91-552)

Other sources include:
   •   2011 Census of Population, analysis series and data products
   •   2011 National Household Survey, analysis series and data products

Each page of this compendium contains a figure or table, accompanied by a brief analysis. Many figures and tables
contain both historical and projected statistics, providing a relatively long time series.
This compendium is intended for a wide range of users, including those working in various levels of government,
educational institutions, businesses and the media, as well as for any other organization or individual interested in Canadian
demography.

Statistics Canada — Catalogue no. 91-003-X                   -2-               Canadian Demographics at a Glance - Second Edition
Section one: Population growth and age structure                                        Population growth

                     Section one: Population growth and age structure

Statistics Canada — Catalogue no. 91-003-X         -3-   Canadian Demographics at a Glance - Second Edition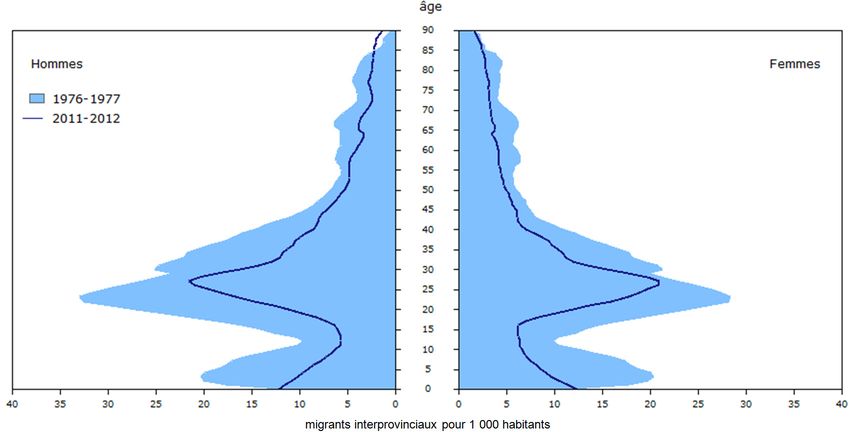
Section one: Population growth and age structure                                                                                      Population growth

                            Approximately 52.6 million Canadians in 2061

   • Over the past 150 years, the population of Canada has grown steadily. At the time of confederation,
     in 1867, the nation’s population was about 3.5 million. In the last four decades of the 19th Century, growth
     was slowed by negative migratory increase, when more people left Canada than arrived.
   • Population growth was especially robust during the first decade of the 20th Century and during the baby
     boom (1946 to 1965) when there was strong natural and migratory increase. By the peak of the baby boom,
     in 1959, the population of the country had increased to close to 17.5 million.
   • On July 1, 2013, Canada’s population was estimated at 35.2 million, and population growth has gradually
     slowed in recent decades. In the one year period between July 1, 2012 and June 30, 2013, Canada’s population
     grew by a rate of 1.2%, mainly due to immigration.
   • In the coming decades, the population of Canada is expected to continue to increase. According to the medium-
     growth scenario of the most recent population projections, Canada’s population could reach 52.6 million
     by 2061. However, population growth could continue to slow as a result of declining natural increase,
     since the number of deaths is expected to gradually approach the number of births.

Figure 1
Population of Canada, 1851 to 2061
thousands
70,000
                                                                                                          Observed      Projected
                     Low-growth scenario
60,000               Medium-growth scenario (M1)
                     High-growth scenario

50,000

40,000

30,000

20,000

10,000

     0
     1851 1861 1871 1881 1891 1901 1911 1921 1931 1941 1951 1961 1971 1981 1991 2001 2011 2021 2031 2041 2051 2061

Sources: Statistics Canada. 2010. Population Projections for Canada, Provinces and Territories 2009 to 2036, catalogue no. 91-520-XPE, low-growth scenario,
         medium-growth scenario (M1) and high-growth scenario, censuses of population, 1851, 1861 and 1871, Demography Division, Population Estimates
         Program.

Statistics Canada — Catalogue no. 91-003-X                                  -4-                  Canadian Demographics at a Glance - Second Edition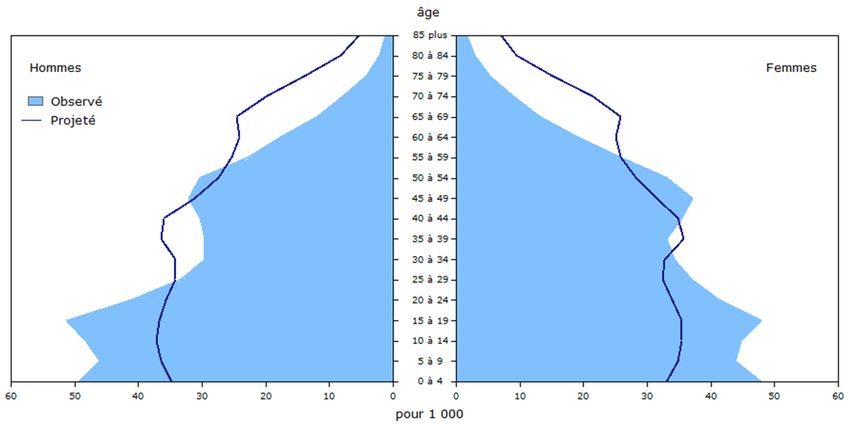
Section one: Population growth and age structure                                                                                  Population growth

                                      Canada’s population is growing rapidly
                                         compared to other G8 countries

   • Between 2005 and 2010, Canada experienced the strongest population growth of any G8 country,
       with an average annual growth rate of about 1.1%. Canada’s more rapid growth rate is attributable to greater
       migratory growth in this country than in the other G8 countries.
   • In the 1950s, Canada’s population growth was 2.6% to 2.7%, more than double the present level. This rapid
       growth, similar to the current growth of some less industrialized countries, was related to the high levels
       of fertility and immigration at that time. The drop in fertility that characterized the end of the baby boom
       contributed to the subsequent slowing of population growth.
   • In the coming decades, Canadian population growth is expected to slow but remain positive and higher
       than most other G8 countries. Some of these countries, such as Germany and Russia, have already seen
       their population decline in some years.

Figure 2
Average annual growth rate of the population, G8 countries, 1950 to 2010
 percent
 3.0

 2.5                   Canada

 2.0

                      United States
 1.5
                                            Japan
              France
 1.0

           Italy                                                                      Russia

 0.5
                           United Kingdom

 0.0
                                                                    Germany

-0.5

-1.0
   1950        1955          1960        1965        1970        1975          1980        1985        1990        1995         2000         2005
     to         to            to          to          to          to            to          to          to          to           to           to
   1955        1960          1965        1970        1975        1980          1985        1990        1995        2000         2005         2010
Sources: Statistics Canada, Demography Division, Population Estimates Program and United Nations. 2013. World Population Prospects: The 2012 Revision,
         Department of Economic and Social Affairs, Population Division.

Statistics Canada — Catalogue no. 91-003-X                               -5-                   Canadian Demographics at a Glance - Second Edition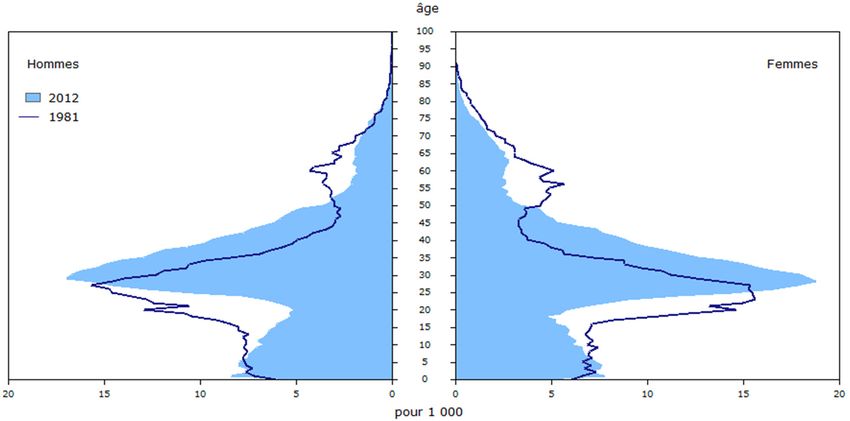
Section one: Population growth and age structure                                                                                       Population growth

                                    Migratory increase is the main source
                                       of Canada’s population growth

   • Between 2001 and 2011, migratory increase accounted for close to two-thirds of Canada’s population
       growth. The remaining growth came from natural increase, that is, the difference between births and deaths.
   • The larger contribution of immigration to Canada’s population growth is relatively recent. Until the 2001
       to 2011 period, natural increase was the main engine of population growth. In the last decade, the situation
       reversed, with migratory increase becoming the main component of population growth owing to low fertility
       and population aging.
   • In the decades to come, migratory increase could become a more important source of population growth
       in Canada. It is projected that population growth from natural increase will continue to decline as the number
       of deaths gradually approaches the number of births.

Figure 3
Annual average growth rate, natural increase and migratory increase per intercensal period, Canada,
1851 to 2061
 percent
 3.5
                                                                                                          Observed       Projected

 3.0
                                                                                           Growth related to the addition of Newfoundland and Labrador
                                                                                           Migratory increase
 2.5
                                                                                           Natural increase
                                                                                           Total growth
 2.0

 1.5

 1.0

 0.5

 0.0

-0.5

-1.0
       1851 1861     1871   1881   1891   1901   1911 1921     1931   1941   1951   1961   1971 1981      1991   2001   2011 2021    2031    2041   2051
        to   to       to     to     to     to     to   to       to     to     to     to     to   to        to     to     to   to      to      to     to
       1861 1871     1881   1891   1901   1911   1921 1931     1941   1951   1961   1971   1981 1991      2001   2011   2021 2031    2041    2051   2061

Source: Statistics Canada. 2012. “Population growth in Canada: From 1851 to 2061”, Census in Brief, Census of Population 2011, catalogue no. 98-310-x.

Statistics Canada — Catalogue no. 91-003-X                                   -6-                  Canadian Demographics at a Glance - Second Edition
Section one: Population growth and age structure                                                                                      Population growth

                           Canada’s rural population declining since 1851

   • According to the 2011 Census of Population, more than six million Canadians were living in a rural area,
       that is, an area with a population under 1,000 and a population density below 400 inhabitants per square
       kilometre. The population living in rural regions in Canada thus accounted for slightly less than 20%
       of the Canadian population.
   • The proportion of people living in rural areas in Canada has steadily declined since 1851, when nearly
       9 in 10 Canadians lived in a rural area. This decline is largely related to changes in the structure of the Canadian
       economy.

Figure 4
Proportion of the population living in rural areas, Canada, 1851 to 2011
 percent
100

  90

  80

  70

  60

  50

  40

  30

  20

  10

   0
        1851    1861     1871     1881     1891     1901    1911     1921     1931     1941     1951      1961   1971   1981   1991    2001   2011

Note: Data presented for 1851 to 1951 censuses are based on the definition of rural areas at that time.
Sources: Statistics Canada, censuses of population, 1851 to 2011.

Statistics Canada — Catalogue no. 91-003-X                                    -7-                   Canadian Demographics at a Glance - Second Edition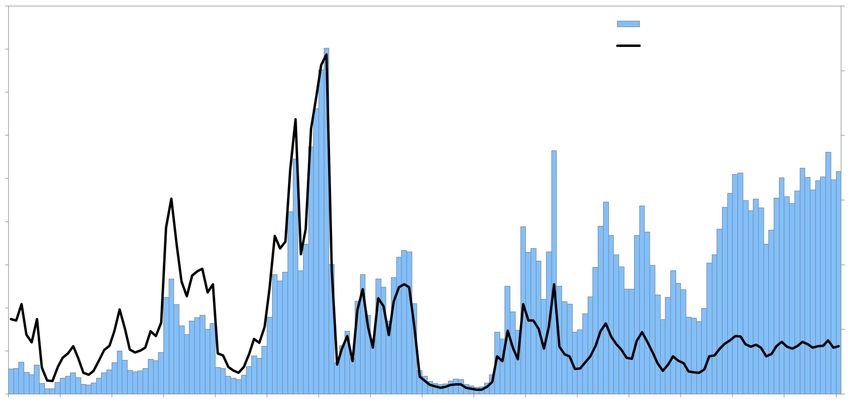
Section one: Population growth and age structure                                                                                               Age structure

                              Aging of the Canadian population continues

   • In the last 50 years, the age and sex structure of the Canadian population has changed considerably. In 1961,
       toward the end of the baby boom, Canada’s population pyramid had a wide base because of the large
       number of young people, reflecting the large cohorts born during this period.
   • More than 50 years later, the bulge has moved up the pyramid as the baby boomers, aged 46 to 65 in 2011,
       have grown older. The drop in fertility is apparent in the pyramid with a slightly narrower base.
   • As the baby-boom cohorts grow older and Canada’s population continues to age, the structure
       of the population can be expected to increasingly resemble a rectangle, as shown by the pyramid for 2061
       based on the medium-growth scenario of the most recent population projections.

Figure 5
Age pyramids of the population, Canada, 1961, 2011 and 2061
                                                                             age
                                                                              100
                                                                               95
          Males                                                                90                                                           Females
                                                                               85
             2011                                                              80
             1961                                                              75
             2061                                                              70
                                                                               65
                                                                               60
                                                                               55
                                                                               50
                                                                               45
                                                                               40
                                                                               35
                                                                               30
                                                                               25
                                                                               20
                                                                               15
                                                                               10
                                                                                5
                                                                                0
     16      14       12      10       8        6       4       2       0          0         2       4       6        8       10      12       14      16
                                                                        per thousand

Sources: Statistics Canada. 2010. Population Projections for Canada, Provinces and Territories, 2009 to 2036, catalogue no. 91-520, medium-growth scenario (M1)
         and Demography Division, Population Estimates Program.

Statistics Canada — Catalogue no. 91-003-X                                   -8-                   Canadian Demographics at a Glance - Second Edition
Section one: Population growth and age structure Age structure
Moving towards a larger proportion of seniors than of children
• On July 1, 2013, the Canadian population included approximately 5.4 million people aged 65 and over,
representing a record proportion of the population, at 15.3%. It also included 5.7 million children aged
14 and under and 24.1 million working-age persons (aged 15 to 64), representing 16.1% and 68.6%
of the population, respectively.
• The proportion of seniors has been steadily increasing for the past 50 years due to below-replacement
fertility1 and the lengthening of life expectancy. This increase will accelerate in the coming years as more
baby boomers reach 65 years of age.
• According to the medium-growth scenario of the most recent population projections, the proportion
of seniors could start to exceed the proportion of children in 2017, with a subsequent widening of the gap.
• The proportion of the population that is of working age (15 to 64 years of age) has remained at around
68% since the 1980s due to the presence of the baby boomers in this age group. In the next 50 years,
as baby boomers exit this age group, this proportion could drop down to the levels recorded in the late
1950s and throughout the 1960s, that is, to approximately 60% of the population.
1. Refers to the number of children per woman necessary to assure the replacement of a population, taking account of mortality
between birth and age 15 and in the absence of migration. This threshold is currently estimated at 2.1 children per woman.
Figure 6
Proportion of the population aged 0 to 14, 15 to 64, and 65 and over, Canada, 1921 to 2061
percent
80
Observed Projected
70
15 to 64
60
50 Low-growth scenario
Medium-growth scenario (M1)
High-growth scenario
40
0 to 14
30
20
10 65 and over
0
1921 1931 1941 1951 1961 1971 1981 1991 2001 2011 2021 2031 2041 2051 2061
Sources: Statistics Canada. 2010. Population Projections for Canada, Provinces and Territories 2009 to 2036, catalogue no. 91-520-XPE, low-growth scenario,
medium-growth scenario (M1) and high-growth scenario and Demography Division, Population Estimates Program.
Statistics Canada — Catalogue no. 91-003-X -9- Canadian Demographics at a Glance - Second EditionSection one: Population growth and age structure Age structure
Canada’s population among the youngest in the G8
• Among the G8 countries, only the United States and Russia have smaller proportions of seniors than Canada.
The baby boom was larger in Canada than in most other G8 countries, and most baby boomers have
not yet reached age 65.2
• The United States had a slightly lower proportion of seniors than Canada, along with a higher proportion
of children, mainly owing to higher fertility.
• Japan has the highest proportion of seniors of any G8 country, along with the smallest shares of children
and working-age people, mainly due to lower fertility and longer life expectancy compared to the other
G8 countries.
2. 2013 World Population Data Sheet, Population Reference Bureau. http://www.prb.org/pdf13/2013-population-data-sheet_eng.pdf.
Page visited on November 3, 2013.
Figure 7
Distribution of the population according to three broad age groups, G8 countries, 2012
percent
100
90
80
70
60
65 and over
50 15 to 64
0 to 14
40
30
20
10
0
Russia United States Canada United Kingdom France Italy Germany Japan
Sources: Statistics Canada, Population Estimates Program and Population Reference Bureau. 2013. 2013 World Population Data Sheet.
Statistics Canada — Catalogue no. 91-003-X - 10 - Canadian Demographics at a Glance - Second EditionSection one: Population growth and age structure Age structure
The population will age more rapidly in Canada
than in most G8 countries
• While the proportion of persons aged 65 and over is lower in Canada than in most other G8 countries,
the aging of the population will be more rapid in Canada than elsewhere in the coming years.
• The pace of population aging can be measured as the number of years required for the proportion
of seniors to increase from 12% to 22% of the population. In Canada, this transition could take place
in approximately 33 years, whereas in France, it could take roughly 62 years. In Japan, where the aging
of the population has been especially rapid, this transition period has already ended and it was completed
in about 18 years.
• The relatively larger size of the baby boom in Canada—which took place between 1946 and 1965—
as well as the subsequent drop in fertility, largely explain the more rapid aging of Canada’s population
compared to the other G8 countries.
Figure 8
Number of years required for the proportion of the population aged 65 or over to go from 12% to 22%,
G8 countries
Observed Projected
Canada 33 years
United States More than 75 years
Germany 53 years
United
72 years
Kingdom
41 years
Italy
France 62 years
Japan 18 years
1960 1970 1980 1990 2000 2010 2020 2030 2040 2050
Sources: Statistics Canada. 2010. Population Projections for Canada, Provinces and Territories 2009 to 2036, catalogue no. 91-520-XPF, medium-growth scenario
(M1), Demography Division, Population Estimates Program, Census offices of the United States,1980 to 2050, Italian National Institute of Statistics,
1975 to 2050, National Institute of Statistics and Economic Studies for France, 1960 to 2050, United Kingdom National Statistics, 1975 to 2050, Statistics
Bureau of Japan, 1990 to 2050, Federal Statistical Office of Germany, 2008 to 2050 and Human Mortality Database for Germany, 1965 to 2010.
Statistics Canada — Catalogue no. 91-003-X - 11 - Canadian Demographics at a Glance - Second EditionSection one: Population growth and age structure Age structure
The number of centenarians in Canada is growing
• On July 1, 2013, the population aged 100 years and over was estimated at approximately 6,900 persons,
about twice the number estimated in 2001, at 3,500 persons.
• According to the medium-growth scenario of the most recent population projections, there could be more
than 78,000 centenarians in 2061, when surviving baby boomers will have reached this age group.
• More women than men reach age 100. In 2013, there were over 6,000 women and nearly 900 men aged 100
and over, corresponding to a sex ratio of close to seven women for every man. This disparity
is due to the higher mortality rates of males across the life course compared to females.
Figure 9
Number of centenarians by sex, Canada, 2001 to 2061
thousands
90
Males Observed Projected
80 Females
70
60
50
40
30
20
10
0
2001 2006 2011 2016 2021 2026 2031 2036 2041 2046 2051 2056 2061
Source: Statistics Canada. 2012. “Centenarians in Canada”, Census in Brief, Census of Population 2011, catalogue no. 98-311-x.
Statistics Canada — Catalogue no. 91-003-X - 12 - Canadian Demographics at a Glance - Second EditionSection one: Population growth and age structure Age structure
Fewer working-age persons for each senior
• On July 1, 2013, there were 4.5 working-age persons (aged 15 to 64) for each person aged 65 and over.
This ratio is an indicator of the changes occurring to the age structure of the Canadian population. It provides
an approximation of the size of the senior population in relation to the potential pool of workers aged
15 to 64.
• From the 1950s to the early 1970s, there were approximately eight working-age persons for each person
aged 65 and over. This ratio has since declined to its current level.
• According to all scenarios of the most recent population projections, the ratio of the working-age population
for each senior aged 65 and over could decline by about half in the next 50 years. By the late 2050s, there
could be just over two working-age persons for each person aged 65 and over.
Figure 10
Ratio of the number of persons aged 15 to 64 for each person aged 65 and over, Canada, 1921 to 2061
ratio
14
Observed Projected
12
10
8
6
4
Low-growth scenario
Medium-groth scenario (M1)
2 High-growth scenario
0
1921 1931 1941 1951 1961 1971 1981 1991 2001 2011 2021 2031 2041 2051 2061
Sources: Statistics Canada. 2010. Population Projections for Canada, Provinces and Territories 2009 to 2036, catalogue no. 91-520-XPE, low-growth scenario,
medium-growth scenario (M1) and high-growth scenario, and Demography Division, Population Estimates Program.
Statistics Canada — Catalogue no. 91-003-X - 13 - Canadian Demographics at a Glance - Second EditionSection one: Population growth and age structure Age structure
Decline in the number of young people about to enter
the labour force for each person about to exit
• On July 1, 2013, there was one person aged 15 to 24 (approximating the population about to join the labour
force) for each person aged 55 to 64 (approximating the population about to exit the labour force).
• Since the mid-1970s, there has been a decrease in the number of persons about to enter the labour force
in relation to the number about to leave it. This decrease followed a period of growth between 1961
and 1975, when the large cohorts of baby boomers were reaching age 15.
• With the aging of the population, the ratio of 15-to-24-year-olds to 55-to-64-year-olds is expected to decline
during the next 10 years. It could fall below one for all growth scenarios of the most recent population
projections, meaning there could be potentially more people leaving the labour force than entering it.
The ratio could then rise slightly and stabilize at around one during the following three decades.
Figure 11
Ratio of the number of persons aged 15 to 24 for each person aged 55 to 64, Canada, 1921 to 2061
ratio
3.0
Observed Projected
2.5
2.0
1.5
1.0
0.5 Low-growth scenario
Medium-groth scenario (M1)
High-growth scenario
0.0
1921 1931 1941 1951 1961 1971 1981 1991 2001 2011 2021 2031 2041 2051 2061
Sources: Statistics Canada. 2010. Population Projections for Canada, Provinces and Territories 2009 to 2036, catalogue no. 91-520-XPE, low-growth scenario,
medium-growth scenario (M1) and high-growth scenario, and Demography Division, Population Estimates Program.
Statistics Canada — Catalogue no. 91-003-X - 14 - Canadian Demographics at a Glance - Second EditionSection two: Components of population growth Fertility
Section two: Components of population growth
Statistics Canada — Catalogue no. 91-003-X - 15 - Canadian Demographics at a Glance - Second EditionSection two: Components of population growth Fertility
A faster increase in the number of deaths
compared to number of births
• In 2011, Canada registered more births (377,636) than deaths (242,074), resulting in a positive natural
increase of 135,562.
• The number of births has considerably declined since peaking at nearly half a million in 1959. However,
there have been fluctuations in the number of births in the last four decades, including a small rise in the early
1990s. In contrast, there has been a fairly steady increase in the number of deaths over the past 90 years.
• The number of deaths is projected to accelerate in the coming decades according to all the scenarios
of the population projections. Under the low-growth scenario, the number of deaths could start exceeding
the number of births in 2030, when the baby boomers reach the ages of high mortality. According
to the medium- and high-growth scenarios—which assume fertility of 1.7 and 1.9 children per woman,
respectively—natural increase would remain positive until the end of the projection period in 2060.
Figure 12
Number of births and deaths, Canada, 1926 to 2060
thousands
800
Low-growth scenario Observed Projected
Medium-growth scenario (M1)
700
High-growth scenario
600
500
Births
400
300
200 Start of negative natural increase
Deaths (according to the low-growth
scenario)
100
0
1926 1936 1946 1956 1966 1976 1986 1996 2006 2016 2026 2036 2046 2056
Sources: Statistics Canada. 2010. Population Projections for Canada, Provinces and Territories 2009 to 2036, catalogue no. 91-520-XPE, low-growth scenario,
medium-growth scenario (M1) and high-growth scenario, Statistics Canada, Canadian Vital Statistics, Births Database, 1926 to 2011, Survey 3231 and
Canadian Vital Statistics, Deaths Database, 1926 to 2011, Survey 3233.
Statistics Canada — Catalogue no. 91-003-X - 16 - Canadian Demographics at a Glance - Second EditionSection two: Components of population growth Fertility
In 2011, Canadian women had an average of 1.61 children
• The total fertility rate indicates the number of children that a cohort of women would have at the end
of their reproductive years if, during their reproductive life, they would have experienced the age-specific
fertility rates observed in a given year.
• The total fertility rate increased slightly from 1.51 children per woman in 2002 to 1.68 in 2008, before
falling during the subsequent years to 1.61 children per woman in 2011.
• For more than 40 years, the total fertility rate in Canada has been below the replacement level3 (which
is currently 2.1 children per woman). This means that, on average, couples are no longer having enough
children to replace them. This low-fertility era is following the postwar baby-boom period (1946 to 1965),
when the total fertility rate was much higher, reaching 3.94 children per woman in 1959.
3. Refers to the number of children per woman necessary for the population to replace itself, taking into account mortality
between birth and age 15, and in the absence of migration.
Figure 13
Total fertility rate (number of children per woman), Canada, 1926 to 2011
number of children per woman
4.0
3.5
3.0
2.5
2.0
1.5
1.0
1926 1931 1936 1941 1946 1951 1956 1961 1966 1971 1976 1981 1986 1991 1996 2001 2006 2011
Note: Births to mothers for whom the age is unknown were prorated.
Sources: Statistics Canada, Demography Division, Population Estimates Program and Canadian Vital Statistics, Births Database, 1926 to 2011, Survey 3231.
Statistics Canada — Catalogue no. 91-003-X - 17 - Canadian Demographics at a Glance - Second EditionSection two: Components of population growth Fertility
Canada’s fertility is in the mid-range for G8 countries
• The total fertility rate in Canada, at 1.61 children per woman in 2011, was in the mid-range for the G8
countries. Among G8 countries, France (2.00), the United States (2.00) and the United Kingdom (1.94)
all have higher fertility levels, approaching the replacement level of about two children per woman.
By comparison, Russia (1.54), Italy (1.41), Germany (1.39) and Japan (1.37) all have fertility levels well
below the replacement level.4, 5
• In the second half of the 20th Century, fertility declined in all G8 countries. In most of these countries,
the drop in fertility occurred between 1950 and the end of the 1970s. Since then, the decline appears
to have nearly stabilized in many countries, including Canada.
4. Based on 2009 data or most recent year.
5. Organisation for Economic Co-operation and Development. 2010. “Total Fertility Rate”, OECD Factbook 2012, accessed March 19,
2013.
Figure 14
Total fertility rate (number of children per woman), G8 countries, 1950 to 2011
number of children per woman
4.5
4.0 Canada
3.5 United
States
3.0
France
2.5
Russia
2.0
Japan
1.5
Germany
1.0
United
Kingdom
0.5
0.0
1950 1955 1960 1965 1970 1975 1980 1985 1990 1995 2000 2005 2010
Note: For Canada, births to mothers for whom the age is unknown were prorated.
Sources: Statistics Canada, Demography Division, Population Estimates Program, Canadian Vital Statistics, Births Database, 1926 to 2011, Survey 3231
and Canadian Vital Statistics, Deaths Database, 1926 to 2011, Survey 3233.Centers for Disease Control and Prevention of the United States, 1950
to 2010, Italian National Institute of Statistics, 2008 to 2010, National Institute of Statistics and Economic Studies for France, 1950 to 2006, National
Office of Statistics for the United Kingdom, 1975 to 2005, National Institute of Statistics and Economic Studies for France and for Japan, 1950 to 2010,
Federal Office of Statistics for Germany, 2008 to 2010 and the Statistical Office of the European Union for France, 2006 to 2010 and Italy, 1950 to 2007.
Statistics Canada — Catalogue no. 91-003-X - 18 - Canadian Demographics at a Glance - Second EditionSection two: Components of population growth Fertility
The fertility of women aged 30 to 34 has surpassed
that of women aged 25 to 29
• The overall decrease in the total fertility rate in Canada over the past four decades is due to relatively
steady declines in the age-specific fertility rates under age 30. In contrast, the fertility rates of women
aged 30 and over have generally increased over the same period.
• The slightly higher fertility rate for women aged 30 to 34 than for women aged 25 to 29 which began
in 2005 has continued with a successive widening of the gap between these two age groups. For women
in their late twenties, the fertility rate has generally been falling for about 50 years.
• In contrast, the fertility rate of 30- to 34-year-olds has been on an overall upward trend since 1976,
consistent with observed patterns of delayed childbearing from other indicators. Of note, however,
is that the fertility rate of women in their early thirties was even higher throughout the 1926 to 1965 period
than it was in 2011.
• For the first time in 2010, the age-specific fertility rate was higher for women aged 35 to 39 than for women
aged 20 to 24, and this gap further widened in 2011. The rate for women in their late thirties has been
on an overall increase since the late 1970s. The 2011 fertility rate for this age group was the highest since
1966, though it is still less than half of the age-specific fertility rate of 1926. In contrast, the fertility rate
for women in their early twenties, after peaking in 1960 and 1961, subsequently fell, reaching a record
low in 2011.
Figure 15
Fertility rate by age group of the mother, Canada, 1926 to 2011
per thousand
250
20 to 24
200 25 to 29
30 to 34
150
100
35 to 39
15 to 19
50
40 to 44
45 to 49
0
1926 1936 1946 1956 1966 1976 1986 1996 2006
Note: Births to mothers for whom the age is unknown were prorated.
Sources: Statistics Canada, Demography Division, Population Estimates Program and Canadian Vital Statistics, Births Database, 1926 to 2011, Survey 3231.
Statistics Canada — Catalogue no. 91-003-X - 19 - Canadian Demographics at a Glance - Second EditionSection two: Components of population growth Fertility
Declining fertility among younger generations
• Age-specific fertility rates across the generations born between 1946 and 1985 show a decline in fertility
and an upward shift in the age pattern of childbearing.
• There has been a trend toward postponing childbearing until later ages, specifically, a decrease in fertility
rates among women in their early twenties and an increase among women in their thirties and early forties.
The age of peak fertility has increased from age 24 for women born in 1946 to age 30 for those born
in 1975.
• Higher fertility rates of women throughout their thirties, however, do not offset lower fertility rates during
their twenties. To date, this results in a lower overall completed fertility among generations as women
do not simply ‘make up’ for lower fertility rates in their twenties by having higher fertility rates at older
ages.
Figure 16
Age-specific fertility rates for selected cohorts of women, Canada
per thousand
180
160 Born in 1946
140
Born in 1955
120
Born in 1960
100
Born in 1965
80
Born in 1970
60 Born in 1975
Born in 1980
40
Born in 1985
20 Born in 1990
0
15 16 17 18 19 20 21 22 23 24 25 26 27 28 29 30 31 32 33 34 35 36 37 38 39 40 41 42 43 44 45 46 47 48 49
Note: Births to mothers for whom the age is unknown were prorated.
Sources: Statistics Canada, Demography Division, Population Estimates Program and Canadian Vital Statistics, Births Database, 1926 to 2011, Survey 3231.
Statistics Canada — Catalogue no. 91-003-X - 20 - Canadian Demographics at a Glance - Second EditionSection two: Components of population growth Fertility
Average age at childbirth now more than 30 years of age
• The average age of mothers at childbirth in 2010 was over age 30, specifically, 30.1 years. By 2011, it had edged
up to 30.2 years, the oldest age on record. It is notable that the average age of mothers was also around
age 30 in the 1920s and 1930s, although the reasons behind the patterns are much different.
• Earlier in the 20th Century, contraception was less effective and most childbearing occurred within marriage,
which, in turn, took place at relatively older ages. Consequently, childbearing would have continued throughout
a woman’s reproductive years for the duration of her married life. In contrast, reasons which may account
for the later age of childbirth today—which began rising in the mid-1970s—include women’s pursuit
of higher levels of education, greater labour force participation and delayed union formation, as well
as improved birth control methods.
• In 1945, the average age at first birth was 25.2 years, corresponding with an older age at marriage. In the mid-
1960s, the average age of first birth had decreased to 23.5 years, but subsequently began shifting to older
ages and this has continued for nearly 50 years. For first-time mothers in 2011, the average age at birth
was 28.5 years.
Figure 17
Mean age of mother at first birth and at all births, Canada, 1926 to 2011
age
32
31
30
Mean age at childbearing
29
(all births)
28
27
26
Mean age of mother at first birth
25
24
23
22
1926 1931 1936 1941 1946 1951 1956 1961 1966 1971 1976 1981 1986 1991 1996 2001 2006 2011
Note: Births to mothers for whom the age is unknown were prorated.
Sources: Statistics Canada, Demography Division, Population Estimates Program and Canadian Vital Statistics, Births Database, 1926 to 2011, Survey 3231.
Statistics Canada — Catalogue no. 91-003-X - 21 - Canadian Demographics at a Glance - Second EditionSection two: Components of population growth Mortality
Life expectancy in Canada increased steadily
throughout the 20th Century
• Life expectancy at birth was 79.1 years for males and 83.4 years for females for the 2009/2011 period.
Over the last decade, the life expectancy of males increased on average by about 4 months every year,
while gains for females were lower, at 2.4 months per year.
• The gap between the life expectancy at birth between males and females decreased from a maximum
of 7.3 years in the late 1970s to 4.3 years in 2009/2011. Many factors are related to this trend, with three
of the most important being the reduction in violent deaths among male teenagers and young adults,
better treatment for cardiovascular diseases and increasing similarity of women’s behaviour to that of men,
particularly in the case of smoking, drinking and work-related stress.
• According to the medium mortality assumption in the most recent population projections, the life expectancy
at birth of males and females would reach 84.0 years and 87.3 years, respectively, in 2036.
Table 1
Life expectancy at birth by sex,
Canada, 1941 to 2009/2011
Males Fem ales
Year / Period
in years
1941 63.0 66.3
1945 64.7 68.0
1950/1952 66.3 70.8
1955/1957 67.6 72.9
1960/1962 68.4 74.2
1965/1967 68.8 75.2
1970/1972 69.3 76.4
1975/1977 70.2 77.5
1980/1982 72.0 79.1
1985/1987 73.2 79.9
1990/1992 74.5 80.8
1995/1997 75.4 81.1
2000/2002 76.9 81.9
2005/2007 78.1 82.7
2006/2008 78.3 82.9
2007/2009 78.5 83.0
2008/2010 78.8 83.2
2009/2011 79.1 83.4
Sources: From 1941 to 1975/1977, Statistics Canada,
official life tables and from 1980/1982,
Demography Division.
Statistics Canada — Catalogue no. 91-003-X - 22 - Canadian Demographics at a Glance - Second EditionSection two: Components of population growth Mortality
Life expectancy in Canada is one of the highest in world
• Compared to other industrialized countries, Canada has one of the highest life expectancies at birth (79.1 years
for males and 83.4 years for females in 2009/2011). According to recent data, life expectancy in the United
States (76 years for males, 81 years for females), for example, was more than 3 years lower for males
and about 2.5 years lower for females than that observed in Canada.
• Japan had the highest female life expectancy at birth at 86 years, followed by Spain, Switzerland, France
(metropolitan) and Italy (85 years each). The highest male life expectancy at birth was observed in Switzerland,
the United Kingdom, Australia and Sweden (80 years each), followed by Japan, France (metropolitan),
Italy, Spain and Norway (79 years each).
• During the last 40 years, life expectancy at birth increased in all the G8 countries except Russia. During
the early 1970s, life expectancy in Russia remained well below that in the other G8 countries, at around
63 years for males and 74 years for females, increasing slightly to 64 years for males and 76 years for females
in 2010. In contrast, Japan saw the largest increase in life expectancy at birth, with a rise of about 10 years
since 1971 for both males and females.
Table 2
Life expectancy at birth by sex, G8 countries
and selected other countries
Males Fem ales
Country
in years
Australia 80 84
Canada 79 83
Denmark 78 82
Finland 78 83
France (metropolitan) 79 85
Germany 78 83
Italy 79 85
Japan 79 86
Norw ay 79 83
Russia 64 76
Spain 79 85
Sw eden 80 84
Sw itzerland 80 85
United Kingdom 80 84
United States 76 81
Source: INED. 2013. « Tous les pays du monde (2013) », Population et Sociétés,
no. 503, September 2013.
Statistics Canada — Catalogue no. 91-003-X - 23 - Canadian Demographics at a Glance - Second EditionSection two: Components of population growth Mortality
The majority of deaths now occur at older ages
• The pyramid of deaths by age in 1926 and 2011 illustrates major changes in the profile of mortality
in Canada. The number of deaths of children less than one year of age was much higher
in 1926—despite a smaller population—than in 2011. Higher child mortality at ages one to four in 1926
also led to more deaths for this age group early last century than in 2011.
• The vast majority of deaths recorded in 2011 were concentrated after age 50. In 2011, the greatest number
of deaths was registered at age 85 for men and 89 for women.
• This important change is due in part to the remarkable progress made in the field of living conditions,
public sanitation and medicine, which has led to a sizable reduction in the early childhood mortality. The main
causes of death in Canada’s population have generally evolved away from infectious diseases, which often
affect children, toward degenerative diseases and cancer, which tend to affect older people.
• Observed for the first time in the data available since 1926, there were about the same number of female
and male deaths in Canada in 2011.
Figure 18
Age pyramids of the number of deaths, Canada, 1926 and 2011
age
100
95
Males Females
90
85
2011 80
1926 75
70
65
60
55
50
45
40
35
30
25
20
15
10
5
0
16,000 14,000 12,000 10,000 8,000 6,000 4,000 2,000 0 0 2,000 4,000 6,000 8,000 10,000 12,000 14,000 16,000
Note: Deaths for which the age of death was unknown were prorated using the observed distribution to calculate the rates.
Source: Statistics Canada, Canadian Vital Statistics, Deaths Database, 1926 and 2011, Survey 3233.
Statistics Canada — Catalogue no. 91-003-X - 24 - Canadian Demographics at a Glance - Second EditionSection two: Components of population growth Mortality
Substantial decline in infant mortality during the 20th Century
• The infant mortality rate, or the number of deaths for infants less than one year of age per 1,000 live
births, was 4.8 in 2011, the lowest rate ever recorded in Canada.
• The decline in infant mortality was substantial during the last century, but the gains were slower for neonatal
(0 to 27 days of life) and early neonatal (0 to 6 days of life) mortality.
• In Canada in 2011, about three-quarters (76%) of infant deaths were neonatal, that is, occurred during
the first 27 days of life. However, the majority of deaths occurred during the early neonatal period, that
is, during the first six days of life. In 2011, close to two out of three infant deaths (63%) occurred during
this period, with an additional 13% occurring between 7 and 27 days of life.
Figure 19
Infant mortality rate, neonatal mortality rate and early neonatal mortality rate, Canada, 1926 to 2011
per 1,000 live births
120
100
80
Infant mortality
60
40
Neonatal mortality
20
Early neonatal mortality
0
1926 1931 1936 1941 1946 1951 1956 1961 1966 1971 1976 1981 1986 1991 1996 2001 2006 2011
Notes: Deaths for which the age of death was unknown were prorated using the observed distribution. Infant mortality refers to deaths of infants aged 0 to 364 days.
Neonatal mortality refers to deaths of infants aged 0 to 27 days. Early neonatal mortality refers to deaths of infants aged 0 to 6 days.
Sources: Statistics Canada, Canadian Vital Statistics, Deaths Database, 1926 to 2011, Surveys 3233 and 3231.
Statistics Canada — Catalogue no. 91-003-X - 25 - Canadian Demographics at a Glance - Second EditionSection two: Components of population growth Mortality
In Canada, 87% of males and 92% of females reach age 65
• Many countries, including Canada, are experiencing the phenomenon of the ‘rectangularization’
or ‘compression’ of mortality. This phenomenon occurs when there is an increase in the proportion of persons
surviving to advanced ages. Consequently, the curve of the number of survivors by age within an initial
cohort of 100,000 persons at birth assumes a more rectangular form, owing to the proportionally higher
number of deaths occurring at increasingly advanced ages.
• The 2009/2011 period life table shows that 86.9% of male newborns and 91.6% of female newborns
would survive to age 65 if they would experience the age-specific probabilities of dying observed during
this period. In 1931, the proportions were 58.7% among males and 61.7% among females.
• Under mortality patterns observed during the 2009/2011 period, the chances of a newborn reaching
90 years of age was 21.7% for males and 35.7% for females. In 1931, the chance was 3.6% for males
and 4.7% for females.
Figure 20
Proportion of persons in a synthetic cohort surviving from birth to age x, by sex, Canada, 1931 and 2009/2011
percent
100
Males
Females
90
80
2009/2011
70
1931
60
50
40
30
20
10
0
0 5 10 15 20 25 30 35 40 45 50 55 60 65 70 75 80 85 90
age
Note: Deaths for which the age of death was unknown were prorated using the observed distribution to calculate the rates.
Sources: Statistics Canada, official life tables.
Statistics Canada — Catalogue no. 91-003-X - 26 - Canadian Demographics at a Glance - Second EditionSection two: Components of population growth Migration
Variation in immigration level to Canada during last 150 years
• In 2012, Canada received close to 257,900 immigrants, representing an immigration rate of 7.4 newcomers
per 1,000 inhabitants. This rate remained fairly stable during the last decade, ranging between 7.0 immigrants
per 1,000 population in 2003 to 8.3 immigrants per 1,000 population in 2010.
• During the last century, the annual number of immigrants received by Canada varied considerably. At the start
of the century, Canada admitted record numbers of immigrants in order to populate the Western provinces.
In 1912 and 1913, immigration rates exceeded 50 newcomers per 1,000 population, about seven times
the rate recorded in 2012.
• The number of immigrants fell sharply during the Great Depression and World War II, remaining below
30,000 immigrants per year between 1931 and 1945 and reaching a low of 8,000 immigrants in 1942.
Since the 2000s, Canada has averaged more than 246,000 immigrants per year.
Figure 21
Number of immigrants and immigration rate, Canada, 1852 to 2012
number (thousands) rate (per thousand)
450 60
Number of immigrants
400 Immigration rate
50
350
300 40
250
30
200
150 20
100
10
50
0 0
1852 1862 1872 1882 1892 1902 1912 1922 1932 1942 1952 1962 1972 1982 1992 2002 2012
Note: Data available as of October 2013.
Sources: From 1852 to 1979: Employment and Immigration Canada. 1982. 1980 Immigration Statistics, Immigration and Demographic Policy Group, catalogue no.
MP22-1/1980. From 1980 to 2012, Citizenship and Immigration Canada.
Statistics Canada — Catalogue no. 91-003-X - 27 - Canadian Demographics at a Glance - Second EditionSection two: Components of population growth Migration
The majority of immigrants to Canada now come from Asia
• In 2012, nearly 6 in 10 (57.9%) immigrants to Canada came from Asia. This stands in contrast to the situation
more than 50 years ago, when Asian-born immigrants to Canada accounted for less than 4% of newcomers.
• At the end of World War II, Canadian immigration policies were more favourable to the admission
of individuals from European countries. In 1961, close to three-quarters (72.7%) of immigrants came
from Europe. By 2012, European immigrants accounted for about 14% of newcomers to Canada.
• Between 1961 and 2012, the relative share of immigrants from Africa grew substantially from 1.5% to 13.0%.
During the same period, the proportion of immigrants from the United States declined from 16.1%
to 3.7%.
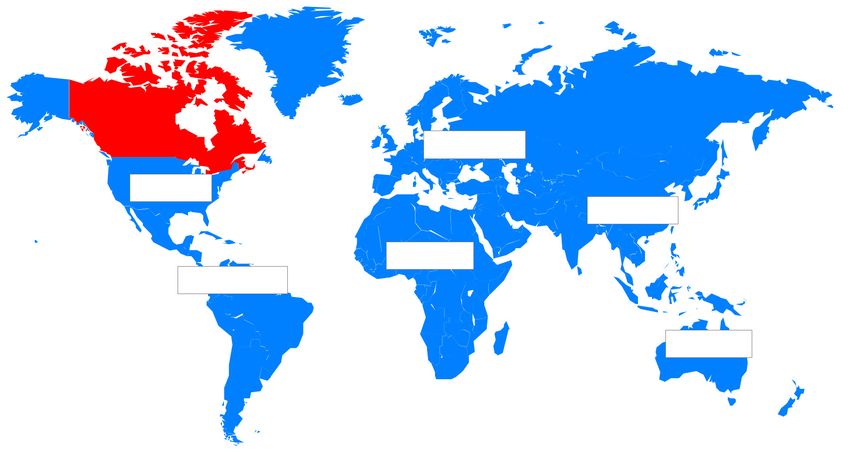
Figure 22
Proportion of immigrants by continent of last permanent residence, Canada, 1961 and 2012
Europe
72.7% / 13.9%
United States
16.1% / 3.7%
Asia
3.8% / 57.9%
Africa
1.5% / 13.0%
Other Americas
3.8% / 10.4%
Legend Oceania
1961 / 2012 2.0% / 0.8%
Note: Data available as of October 2013.
Sources: For 1961, Department of Citizenship and Immigration. 1962. 1961 Immigration Statistics, Statistics Section, Ottawa. For 2012, Citizenship and Immigration
Canada.
Statistics Canada — Catalogue no. 91-003-X - 28 - Canadian Demographics at a Glance - Second EditionSection two: Components of population growth Migration
Most immigrants admitted to Canada in 2012 were part
of the economic category of the immigration policy
• In 2012, 160,800 immigrants—or 62.4% of all immigrants admitted to Canada—were admitted under
the economic category of the immigration policy, including principal applicants as well as their spouses,
partners and dependents. Among these immigrants, the principal applicants were selected for economic
reasons, meaning that they were considered to be more likely to stimulate the economy or integrate into
the labour market given their age, education level and knowledge of Canada’s official languages.
• This situation differs from a number of years during the 1980s and early 1990s, when a larger proportion
of immigrants were admitted under the family reunification category and a smaller proportion were
admitted under economic criteria.
• There were 31,900 immigrants admitted in 2012 in the humanitarian category, or 12.4% of all immigrants
admitted to Canada that year. This number and share has fluctuated over time in conjunction with international
events.
Figure 23
Number of immigrants by category of admission, Canada, 1980 to 2012
thousands
200
180
160
140
Economic
120
100
80
Family
60
40
Humanitarian
20
0
1980 1982 1984 1986 1988 1990 1992 1994 1996 1998 2000 2002 2004 2006 2008 2010 2012
Notes: Data available as of October 2013. A small number of immigrants in other categories of admission are not shown in this figure.
Source: Citizenship and Immigration Canada.
Statistics Canada — Catalogue no. 91-003-X - 29 - Canadian Demographics at a Glance - Second EditionSection two: Components of population growth Migration
Many immigrants come to Canada in the prime of life
• In 2012, nearly 6 in 10 (57.5%) immigrants were between 20 and 44 years of age, as was 34.1% of the overall
population in Canada.
• About one-fifth (20.2%) of the immigrant population was aged 0 to 14 in 2012, slightly higher than
the total population in Canada (16.2%). Just over 4% of new immigrants were aged 65 and over in 2012
compared to approximately 15% for the Canadian population as a whole.
• The age structure of immigrants who arrived in Canada in 1981 shows a population that was both younger
and older compared to those who arrived in 2012. This could reflect the impact of the higher proportion
of immigrants in the family reunification category as well as the humanitarian category 30 years ago.
Figure 24
Age pyramids of immigrants admitted to Canada in 1981 and 2012
age
100
95
Males 90 Females
85
2012 80
1981 75
70
65
60
55
50
45
40
35
30
25
20
15
10
5
0
20 15 10 5 0 0 5 10 15 20
per thousand
Note: Data available as of October 2013.
Source: Citizenship and Immigration Canada.
Statistics Canada — Catalogue no. 91-003-X - 30 - Canadian Demographics at a Glance - Second EditionSection two: Components of population growth Migration
Positive net number of non-permanent residents since late 1990s
• The net number of non-permanent residents represents the change in the number of non-permanent
residents between two dates. For 2012/2013, the net number of non-permanent residents stood at +49,300,
down 11.9% from the level (+56,000) observed in 2011/2012.
• Across all provinces, the net number of non-permanent residents was positive in 2012/2013, thus leading
to an increase in the number of non-permanent residents. The highest net number of non-permanent
residents was observed in Alberta with +19,600, followed by British-Columbia with +11,500 and Ontario
with +7,500. And lastly, the net number non-permanent residents stood at record levels for two provinces:
Manitoba (+1,900) and Saskatchewan (+3,900).
• The net number of non-permanent residents to Canada has been positive since the late 1990s.
Figure 25
Net annual number of non-permanent residents, Canada, July 1, 1971 to July 1, 2013
thousands
200
150
100
50
0
-50
-100
1971/1972 1976/1977 1981/1982 1986/1987 1991/1992 1996/1997 2001/2002 2006/2007 2011/2012
Source: Statistics Canada, Demography Division, Population Estimates Program.
Statistics Canada — Catalogue no. 91-003-X - 31 - Canadian Demographics at a Glance - Second EditionSection two: Components of population growth Migration
Net emigration estimated at 38,900 in 2012/2013
• Of all the components of population growth, emigration, returning emigration and net temporary emigration
are the most difficult to estimate with precision. Most often, these estimates are based on indirect methods.
• Preliminary estimates indicate that in 2012/2013, 57,100 Canadians emigrated, 36,600 emigrants returned
to Canada on a permanent basis and the net number of temporary emigrants was 18,400. Based on these
three estimates, net emigration6 can therefore be estimated at nearly 38,900 for 2012/2013. Net emigration
was concentrated in three provinces, Ontario (+14,700), British Columbia (+12,000) and Quebec (+9,200).
• The net emigration rate was 1.1 per 1,000 population throughout the 2009/2010 to 2012/2013 period,
the lowest rate over the past two decades.
6. Net emigration is obtained as follows: difference between emigration and returning emigration to which is added net temporary
emigration.
Figure 26
Net emigration number and rate, Canada, 1991/1992 to 2012/2013
number (thousands) rate (per thousand)
70 2.5
Number of emigrants
Emigration rate
60
2.0
50
1.5
40
30
1.0
20
0.5
10
0 0.0
1991/1992 1996/1997 2001/2002 2006/2007 2011/2012
Source: Statistics Canada, Demography Division, Population Estimates Program.
Statistics Canada — Catalogue no. 91-003-X - 32 - Canadian Demographics at a Glance - Second EditionYou can also read