Candidate Dusty Galaxy Clusters from Planck & Herschel - David L Clements, Imperial College London Filiberto Braglia, Ashley Hyde, The HerMES ...
←
→
Page content transcription
If your browser does not render page correctly, please read the page content below
Candidate Dusty
                        Galaxy Clusters from
                         Planck & Herschel
                           David L Clements, Imperial College London
                                 Filiberto Braglia, Ashley Hyde,
                       The HerMES Consortium, the H-ATLAS Consortium

Thursday, 4 April 13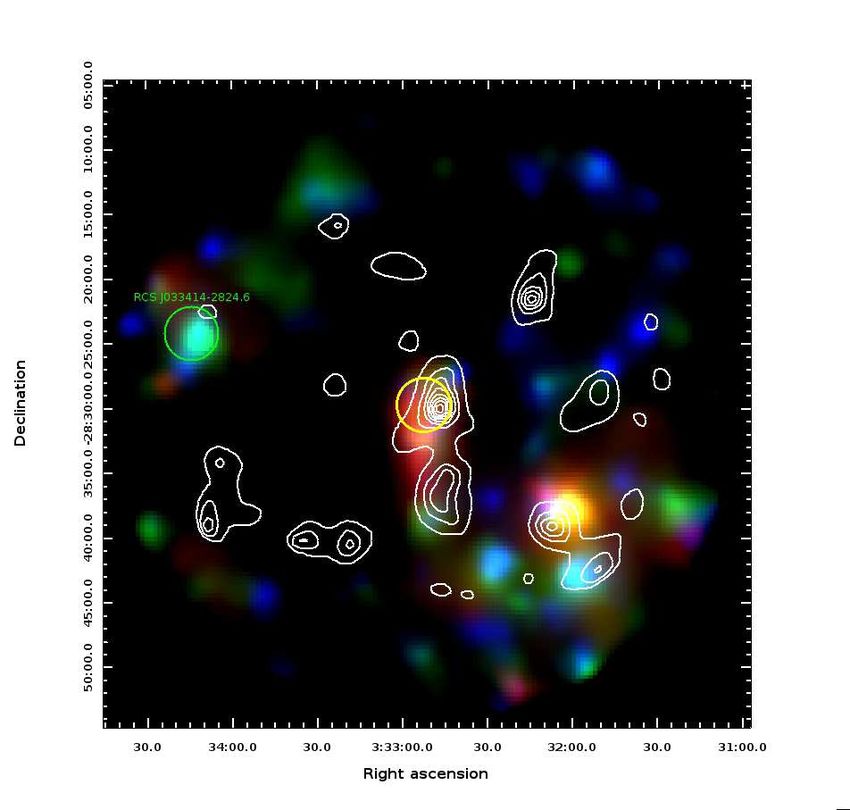
Background
         • Negrello et al. ’05
                 predicted that
                 Planck would be
                 able to find groups/
                 clusters of dusty
                 star-forming galaxies
         • New way to find
                 clusters during
                 short but formative
                 phase

Thursday, 4 April 13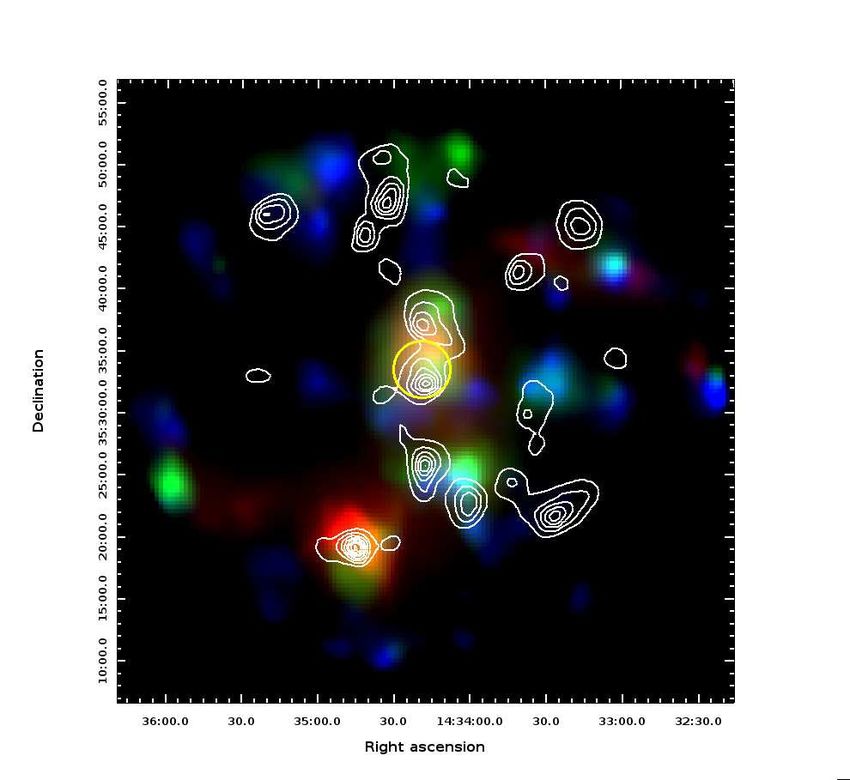
Planck & Herschel
• Can identify candidate clusters by
examining Herschel image at location of a
Planck compact source
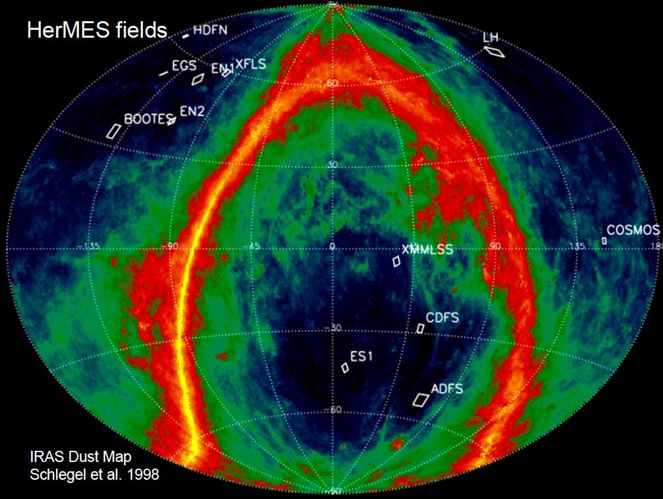
• Here report results from ERCSC sources
in Herschel survey fields from HerMES &
H-ATLAS
Thursday, 4 April 13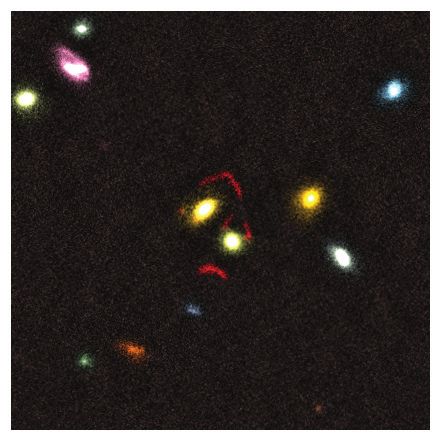
• Largest Herschel survey programme
         • PACS+SPIRE data in all major fields (~110 sq. deg.)
         • Extension to Stripe82 covering ~270 sq. deg.
Thursday, 4 April 13
• Largest area Herschel survey ~570 sq. deg.
                       • NGP, SGP, GAMA fields; SPIRE and PACS
Thursday, 4 April 13
Clump Search in
HerMES & H-ATLAS
• Will report on search for clumps in ~90 sq
deg of HerMES and in the H-ATLAS GAMA
fields
• Uses ERCSC Planck catalogs
• NB Legacy catalog will be deeper and
better
Thursday, 4 April 13HerMES 250 micron images
HerMES: Clusters ofGalaxies
of Dusty all Uncovered
16 ERCSCby Herschel sources
and Planck 7 in 90
sq. deg.
Thursday, 4 April 13HerMES IDs
• 11 ERCSC sources are NED galaxies, one is Mira
• 4 do not have a bright galaxy/star counterpart
• Instead they are local over densities of Herschel
sources, significance 3.6 to 7.2 sigma
Thursday, 4 April 13Thursday,Figure
4 April 13 2. Three colour Herschel images for Planck clumps. Blue = 250µm, Green=350µm, Red=500µm. Fields are Boötes, EGS,PLCKERC857 G172.21-60.84 XMM-LSS 34.680 -6.625 1.83±0.12 0.84±0.15 0.06±0.11 0 0.15 NGC
Table 2. Planck sources in HerMES Fields. All fluxes are given in Jy. Planck bands are indicated as F857, F545, F353 for the 857,
545 and 353 GHz channels. Also shown is the standard deviation for associated Herschel 250µm sources, given as σ(250). See text for
Colours
details. Next is the Planck ERCSC flag for extended sources, with Next=1 indicating extension. ∗ indicates a source at the very edge of
the HerMES map. Identifications indicate the name of the foreground galaxy found to be associated with this source. ’Clump’ indicates
that no foreground galaxy identification was found and thus the source is a candidate dusty protocluster.
Planck Herschel
Figure 3. Planck Colours for Planck Clumps. Planck colours Figure 5. SPIRE Colours for individual Herschel sources asso-
F857 /F545 vs.F545 /F353 for the Planck clumps shown for each ciated with the Planck Clumps, and for generic HerMES sources.
Clump colours & colours of individual Herschel sources
clump, compared to the Planck colours for generic Planck ERCSC
sources (shown as small purple dots) and the sources in the Her-
Only sources detected with a S/N>2 in all three SPIRE bands
are plotted. Also plotted are the mean colours for each clump.
consistent with redshifts >~1
MES fields not identified as clumps (shown as blue dots, exclud- The purple dots are the SPIRE colours for all HerMES sources
ing the three sources which are undetected in one of the Planck in the ECDFS field with S/N>2 in all three bands. These are
bands). ERCSC source colours are only plotted for sources de- compared to the SPIRE colour tracks as a function of redshift
tected at >5σ in the 353 GHz band to ensure that error bars on for SED models of a starbursting (M82) and a quiescent galaxy
the colours are small, and for sources with |b| > 20 to eliminate (M100) from z=0 to z=4.5 with tick marks at intervals of 0.5 in
sources inApril
Thursday, 4 the13galactic plane. These colours are compared to the redshift, as in Fig. 3.Table 6. Photometric quantities for the TNG observations of EGS and Lockman-SWIRE. Integration times are given in seconds, seeing
n arcseconds, photometric zero-points in magnitudes.
Field
EGS
Lockman
Red Sequences
Tint (J)
7470
4050
Tint (K! )
3600
3600
Seeing (J)
1.15
1.20
Seeing (K! )
0.88
0.95
ZP (J)
26.725
26.696
ZP (K! )
26.073
26.143
Ndet
339
169
• Use archival or new optical/IR/IRAC data
Figure 6. Colour-magnitude diagram and red sequence for the EGS (left) and Lockman-SWIRE (right) clumps. Black crosses are all
detected objects in the field, red boxes are objects inside the Planck beam and selected as red sequence galaxies according to the technique
explained in the text. The dashed and dotted lines show the fit to the RS and its scatter, including photometric errors. Vertical bars in
the lower region of each plot show the average colour error at each magnitude interval. Magnitudes in the AB system.
to look for underlying clusters
5.2 Photometric Redshift Analysis 5.2.1 Boötes
Photometric redshifts in the Boötes field are based on the
Thursday, 4 April 13 multi-wavelength dataset described in Section 4.1.1. WherePhoto-z
HerMES: Clusters of Dusty Galaxies Uncovered by Herschel and Planck 13
• Also get photo-z using archival data
Figure 10. Photometric redshift distribution in the Boötes field
n normalised counts). The black histogram shows the distribu-
Figure 12. Photometric redshift distribution in the CDFS field
(in normalised counts). The black histogram shows the distri-
• This & RS analysis allows redshift estimates
on of all objects in the 9 square degrees of the NDWFS, the red bution of all objects in SWIRE survey field, the red one is the
ne is the distribution of objects along the l.o.s. of the Planck distribution of objects along the l.o.s. of the Planck clump. While
lump. While the spikes at z < 1 reflect the overall redshift dis- the spikes at z < 1 reflect the overall redshift distribution in the
ribution in the NDWFS field, a peak of at z ∼ 2.3 is only found NDWFS field, a peak at z ∼ 1.1 is only found along the l.o.s. the
n the l.o.s. of the clump. clump.
conclusions. Nevertheless, our results are capable of provid-
Thursday, 4 April 13HerMES Clump Results
Field z LF IR SFR (M" /yr)
Boötes 2.27±0.12! 73±11 11632±1800
EGS 0.76±0.10∗ 3.7±0.9 620±138
Lockman 2.05±0.09∗ 31±6 4924±946
CDF-S 1.04±0.11! 10±2 1631±356
Table 7. Redshift estimates and integrated FIR luminosities and
SFR for the four clumps. ! indicates a redshift derived using a
photometric redshift method, while ∗ indicates values derived us-
ing the observed red sequences. The values of LF IR are expressed
in units of 1012 L" .
• These are high (z>>0.5) redshift clusters
with6.2member galaxies
Star-formation rates forming stars very
rapidly - just
We derive what
a simple Negrello
estimate 2005SFR
of the integrated predicted
for each
clump by considering all Herschel sources inside the Planck
beam as belonging to the clumps themselves. We consider
only the sources with a ≥ 2σ detection in all SPIRE bands
Thursday, 4 April 13
(cf. Figure 5) and fit their SEDs with a modified blackbody,16
Cluster Formation
D.L. Clements et al.
the HerMES survey
area we find that
creet objects. Inste
sities of Herschel s
Herschel colours su
the nature of these
quency data or thr
veals evidence from
from the presence
clumps and associa
ies at redshifts ∼1—
which leads to thei
beams as compact
rate sources by He
members experienc
mation. A starburs
• Can reach higher z than eg. ISCS cluster search
Figure 16. The mean I-3.6µm colour of the red-sequence for the
CDF-S and Boötes clumps (red squares). different colour tracks
by Granato et al.
in the formation an
galaxies within the
• Allows better constraint on cluster galaxy
for galaxies with different formation redshifts are shown (cf. leg-
end). The cyan triangles mark the mean colour of the RS for to uncover. The co
a selection of clusters from the ISCS survey (Eisenhardt et al. vations, as demons
formation epoch
2008). on its own, are cap
providing a new to
cluster formation a
Thursday, 4 April 13
6.4 Extending the Clump Search available for two o. The
The H-ATLAS Clumps
Candidate z=3.26 Cluster of Star-Forming HLIRGs 5
Table
rpart. The Astrophysical Journal, 753:134 (12pp), 2012 July 10 Fu et al.
some
object
and in
ear to
n. We
th in-
nd its
argest
PIRE
ved in
urces,
ssess-
better
z=3.26 gravitationally
Figure 1. High-resolution images of HATLAS12−00. All images are aligned and the tickmarks are spaced at intervals of 1"" . Green crosses mark the two components
seen in the JVLA image. (a) Keck K-band image painted with a pseudocolor map from Keck K (red), J (green), and ACAM optical (blue) images. Lensing galaxies and
the PSF star are labeled. The scale bar indicates 5"" or 40 kpc at the lens redshift. The inset shows the lens-subtracted K-band image overlaid with the peak positions
for lens modeling (Section 3.1). For clarity, the positional errors, as indicated by the ellipses, are enlarged by a factor of four. The colors distinguish images from the
three clumps in the source plane. (b) SMA 880 µm compact array image. Contours are drawn at −2, −1, +1, +2, and +4σ , where σ is the rms noise (3 mJy beam−1 ).
lensed HLIRG: Fu et al.
(c) JVLA CO(1→0) image. Contours are drawn at −1, +2, +4, and +8σ , where σ is the rms noise (27 µJy beam−1 ). The inset shows the CO spectrum from the same
d with data cube, along with a Gaussian fit (red). In (b) and (c), the ellipse to the lower right shows the beam.
(A color version of this figure is available in the online journal.)
tribu-
2012
o the
64 MHz to avoid noisier edge channels. The eight sub-bands of 2.5. Panchromatic Photometry
y and Figure 2. Three colour SPIRE image of the 5 arcmin ×5 arcmin output pair AC were tuned to 32.5 GHz.
or the The bright compact calibration source, J1150−0023, was Photometry of HATLAS12−00 was obtained from the SDSS
region around the lensed z = 3.26 source HATLAS12-00. Blue = observed every few minutes to determine accurate complex gain (u, g, r, i, and z), the UKIDSS (Y, J, H, and K), the Wide-
• Only one ‘clump’ found in H-ATLAS GAMA regions
s in a 250µm, Green=350µm and Red=500µm, overlaid by cyan con- solutions and bandpass corrections. 3C 286 (S = 2.1666 Jy at Field Infrared Survey Explorer (WISE, 3.6 and 4.6 µm; Wright
sition tours, at levels of 2, 3, 4, 5 and 6 σ, from the LABOCA 870µm 27.06 GHz) was also observed to set the absolute flux scale, and et al. 2010), the Herschel/PACS (100 and 160 µm; Program ID:
the pointing accuracy was checked locally every hour. In total, OT1_RIVISON_1; Ibar et al. 2010), the Herschel/SPIRE (250,
ensity observations. Note that those sources brightest at 870µm are around 2 hr of data were obtained for HATLAS12−00, with 350, and 500 µm; Pascale et al. 2011; Rigby et al. 2011), the
which associated with the reddest SPIRE sources. Furthermore, some ∼1 hr of calibration. LABOCA (870 µm; Siringo et al. 2009), the SMA (880 µm),
The data were reduced using AI P S (31DEC12) following the Max-Planck Millimetre Bolometer (MAMBO, 1.2 mm;
(Herranz et al., 2013)
LABOCA sources at the 3-5σ level do not seem to be associated Kreysa et al. 1999), the CARMA (2792 and 3722 µm; Bock
the procedures described by Ivison et al. (2011), though with a
with any SPIRE source at all. number of important changes: data were loaded using bdf2aips et al. 2006), and the VLA FIRST survey (21 cm; Becker et al.
strain and fring was used to optimize the delays, based on 1 minute 1995).
et al., of data for 3C 286. The base bands were knitted together using We obtained imaging at 870 µm with the LABOCA bolome-
the noifs task, yielding uv data sets with 512 × 2 MHz channels, ter array at the Atacama Pathfinder EXperiment (APEX) tele-
rdlow
• Possible issues with cirrus foreground in GAMA 9
galaxies which contains several far-IR lumionous starbursts, which we then added together using the task dbcon. Finally, scope in 2011 November (D. L. Clements et al., in preparation).
urs of the channels were imaged over a 512 × 512 × 0."" 3 field, with LABOCA observed a 11." 4 diameter field with a resolution of
similar to the objects suggested by Negrello et al. (2005) and natural weighting (robust = 5), to form a 5123 cube centered FWHM = 18."" 6. The observations have a total integration time
dshift of ∼30 hr reaching a 1σ sensitivity of ∼2 mJy.
identified at lower redshifts in HerMES data by Clements et on HATLAS12−00. Integrating over those 55 channels found
n low to contain line emission (so a fwzi of ∼1200 km s−1 ) yielded We obtained 1.2 mm imaging with MAMBO at the IRAM
al. (in prep). an rms noise level of 27 µJy beam−1 . 30 m telescope (FWHM ∼ 10."" 7) in 2011 January and February
y M82 The cleaned and velocity-integrated CO map is shown in (H. Dannerbauer et al., in preparation). Observing time in the
or the Figure 1(c). The beam is 2."" 5×2."" 2 at P.A. = 85◦ . Similar on–off mode is 24 minutes, achieving a 1σ sensitivity of ∼1 mJy.
to the SMA, the map resolves two components separated We obtained continuum observations at 81.2 and 108.2 GHz
Fig. 3, by ∼5"" . The CO lines extracted from the two components (3722 and 2792 µm; covering rest-frame CO(3→2) and
PIRE CO(4→3) lines) on 2011 March 18 and September 1 as part of
Thursday, 45April
DISCUSSION
13 show the same redshift and line profile, further confirming
our CO follow-up campaign of bright, lensed H-ATLAS SMGs
that they are lensed images of a single source. The best-fitCompanion 2 11:46:42.57 -00:08:00.6 45±6 49±7 30±8 10.0±1.6 6.6 17.3” 204” from lens
Companion 3 11:46:23.50 -00:10:58.9 40±6 42±7 14±8 11±2 5.1 2.0” 220” from lens
Companion 4 11:46:44.65 -00:08:40.3 30±6 50±7 50±8 7.5±1.5 5.0 7.7” 188” from lens
LABOCA Companions
Table 1. Sources detected with S/N >5 by the LABOCA observations, giving the LABOCA flux and S/N at 870µm and fluxes in the
SPIRE bands derived from cross matching the LABOCA sources to objects in the H-ATLAS catalog. Also shown are the Herschel and
LABOCA fluxes of the lensed source after correction for the lensing amplification, which reveals that the underlying properties of this
object are very similar to the LABOCA companions.
• Herschel & Herschel-LABOCA colours consistent
Figure 3. 250µm/350µm vs. 350µm/500µm flux ratios of SPIRE Figure 4. 250µm/350µm vs. 350µm/870µm flux ratios of the
sources within 5 arcminutes of the lensed source HATLAS12-00 sources detected at >5σ by LABOCA at 870µm compared to
compared to the colours expected for star forming galaxies as a colour tracks as a function of redshift for star forming galaxies.
with companions at same z as lensed source: a group
function of redshift. The LABOCA detected sources are indicated All these sources have colours similar to the lensed z = 3.26 source
with a red colour, with HATLAS12-00 having the smallest error HATLAS12-00, which is the source in this figure with the small-
bars. Black symbols denote SPIRE sources detected within the est error bars, consistent with them lying at a similar redshift.
of HLIRGs at z=3.26
LABOCA field that do not have a > 5σ LABOCA detection. Note
that the > 5σ LABOCA detected sources are in general redder
Template colour tracks are also shown, similar to those in Fig. 3.
that the bulk of the SPIRE sources, and have colours comparable
to those of the lensed z = 3.26 source itself, but also that a where ν is frequency, β is the emissivity factor, T is tem-
small number of SPIRE-only sources have similarly red colours. perature, and B(ν, T ) is the Planck function, with both β
Thursday, 4 April 13H-ATLAS: A Candidate z=3.26 Cluster of Star-Forming HLIRGs 7
Submm template photo-z fits
Figure 5. SED fits derived from the photometric redshift estimation code compared to the observed data from SPIRE and LABOCA
Thursday, 4 April 13SFRD in clusters/clumps
• Data from clusters in literature & clumps from here
• Cluster SFRD drops rapidly from z~0.7, flat above z~1.5
Thursday, 4 April 13Discussion
• New way to find high z galaxy clusters and to study
formative phase in cluster evolution
• Early days yet for understanding these systems but
more data coming eg. JVLA, SCUBA2, optical, near-
IR etc.
• Esp. important for probing underlying galaxy
population associated with z=3.26 clump
Thursday, 4 April 13More to Come!
ERCSC
source in H-
ATLAS NGP
associated
with a strong
lensing
cluster
• More area from H-ATLAS & Stripe 82 to work with &
better Planck legacy catalogs
• Parallel study within Planck team
Thursday, 4 April 13You can also read