CANTERBURY THE CLIMATE AND WEATHER OF - 2nd edition G. R. Macara - NIWA
←
→
Page content transcription
If your browser does not render page correctly, please read the page content below
THE CLIMATE AND WEATHER OF

CANTERBURY
2nd edition         G. R. Macara
© 2016. All rights reserved. The copyright for this report, and for the data, maps, figures and other information
(hereafter collectively referred to as “data”) contained in it, is held by NIWA. This copyright extends to all forms
of copying and any storage of material in any kind of information retrieval system.

While NIWA uses all reasonable endeavours to ensure the accuracy of the data, NIWA does not guarantee or
make any representation or warranty (express or implied) regarding the accuracy or completeness of the data,
the use to which the data may be put or the results to be obtained from the use of the data. Accordingly, NIWA
expressly disclaims all legal liability whatsoever arising from, or connected to, the use of, reference to, reliance
on or possession of the data or the existence of errors therein. NIWA recommends that users exercise their own
skill and care with respect to their use of the data and that they obtain independent professional advice relevant
to their particular circumstances.

NIWA SCIENCE AND TECHNOLOGY SERIES
NUMBER 68

ISSN 1173-0382

Note to Second Edition
This publication replaces the first edition of New Zealand Meteorological Service Miscellaneous Publication 115
(17), written in 1987 by A. P. Ryan. It was considered necessary to update the first edition, incorporating more
recent data and updated methods of climatological variable calculation.
THE CLIMATE AND WEATHER OF
CANTERBURY
2nd edition           G.R. Macara
CONTENTS
SUMMARY                                        5

INTRODUCTION                                   6

TYPICAL WEATHER SITUATIONS IN CANTERBURY       8
   Easterly-quarter airflows                   8
   Southerly-quarter airflows                  9
   West-southwesterly airflows                 9
   Northwesterly airflows                     10

CLIMATIC ELEMENTS                             12
   Wind                                       12
   Rainfall                                   16
     Rainfall distribution                    16
     Rainfall frequency and intensity         19
     Recent extreme events in Canterbury      21
     Periods of low rainfall                  22
   Temperature                                23
     Sea surface temperature                  23
     Air temperature                          23
     Earth temperatures                       27
     Frosts                                   27
   Sunshine and Solar Radiation               29
     Sunshine                                 29
     Solar radiation                          30
     UV (ultra-violet) radiation              30
   Other elements                             31
     Snow                                     31
     Thunderstorms                            32
     Hail                                     32
     Fog                                      32

DERIVED CLIMATOLOGICAL PARAMETERS             34
  Vapour pressure and relative humidity       34
  Evapotranspiration and soil water balance   35
  Degree-day totals                           36

ACKNOWLEDGEMENTS                              41

REFERENCES                                    41

                                                   4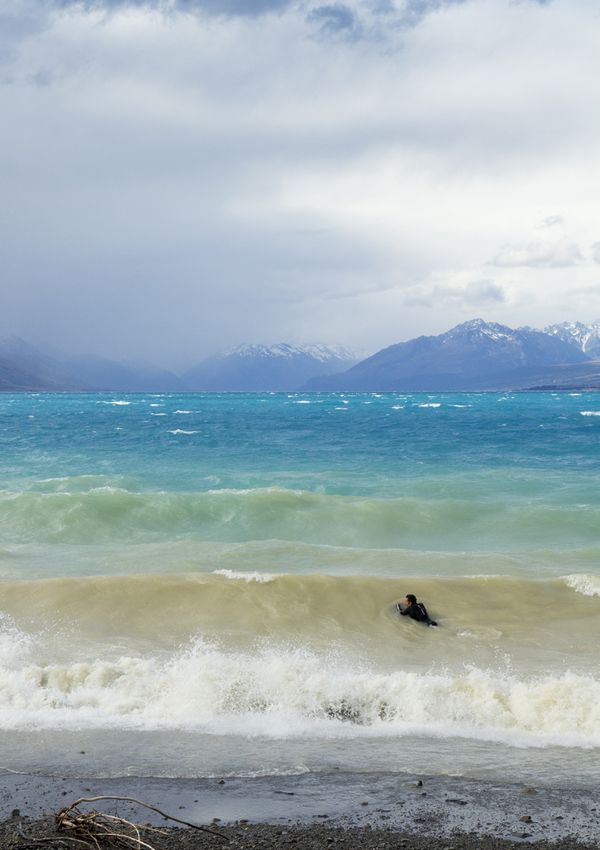
SUMMARY
All aspects of the climate of Canterbury are dominated
by the influence of the Southern Alps on the prevailing
westerly airflows. Five main climate zones can be
distinguished:

 1. The plains, with prevailing winds from the north-
     east and south-west, low rainfall, and a relatively
     large annual temperature range by New Zealand
     standards.
 2. The eastern foothills and southern Kaikouras, with
     cooler and wetter weather, and a high frequency of
     north-westerlies.
 3. The high country near the main divide, with
     prevailing north-west winds, abundant
     precipitation, winter snow and some glaciers
     particularly towards the south.
 4. Banks Peninsula and the coastal strip north of
    Amberley, with relatively mild winters, and rather
    high annual rainfall with a winter maximum.
 5. The inland basins and some sheltered valleys,
     where rainfall is low with a summer maximum, and
     diurnal and annual temperature ranges are large.

Although north-westerlies are not frequent on the
plains they are an important consideration for the
agricultural sector, due to the exceptional evaporation
that occurs on north-westerly days. Irrigation is
necessary in most parts of the plains during the
growing season due to the relatively low rainfall
received there. The rather cold winter weather in
Canterbury is interrupted at times by unseasonably
warm days during foehn episodes. Daily maximum
temperatures in summer often exceed 30°C throughout
Canterbury during such foehn episodes, and on rare
occasions temperatures in excess of 40°C have been
recorded.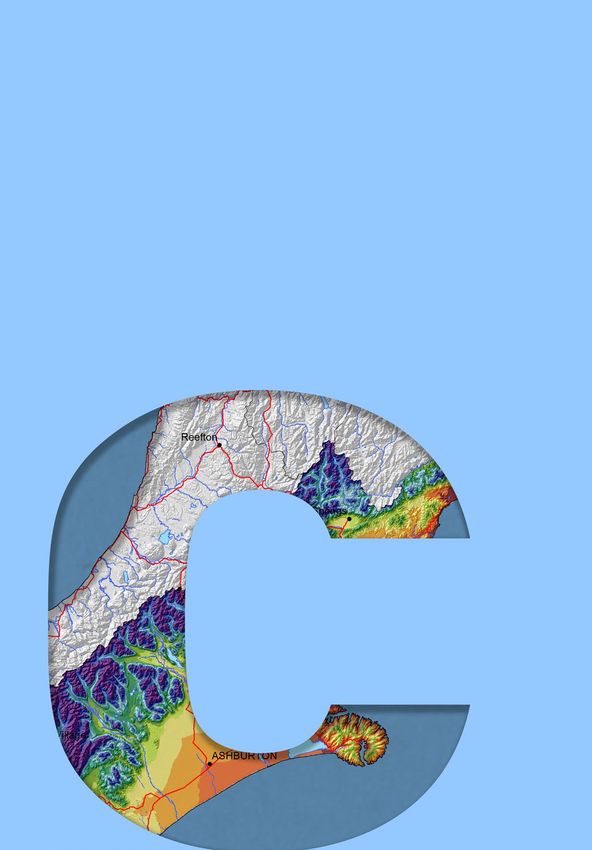
INTRODUCTION
New Zealand spans latitudes 34 to 47
degrees south, and so lies within the
Southern Hemisphere temperate zone. In
this zone, westerly winds at all levels of
the atmosphere move weather systems,
which may also be either decaying or
developing, eastwards over New Zealand
giving great variability to its weather.
These prevailing westerlies sometimes
abate, and air from either tropical or
polar regions may reach New Zealand
with heavy rainfalls or cold showery
conditions, respectively. The main divide of
the Southern Alps acts as a barrier to the
prevailing westerlies and has a profound
effect on the climate of Canterbury,
separating New Zealand’s wettest region
(the West Coast) from considerably drier
regions east of the main divide.
The Canterbury region (Figure 1) is
bounded in the east by the coast, and in
the west by the main divide which reaches
3,724 m at the summit of Mount Cook. The
coastal plain extends from Waimate to
Waipara. The plains slope gently upwards
to reach 150-200 m in the north, but where
they are broadest in mid-Canterbury, the Figure 1. Map of the Canterbury region, showing the places mentioned in
foot of the ranges lies at 350-400 m. Banks this publication.
Peninsula lies to the east of the general
run of the coast, and rises to 919 m at Mt
Herbert.
Apart from on Banks Peninsula, the high country are large enough to influence the local climate.
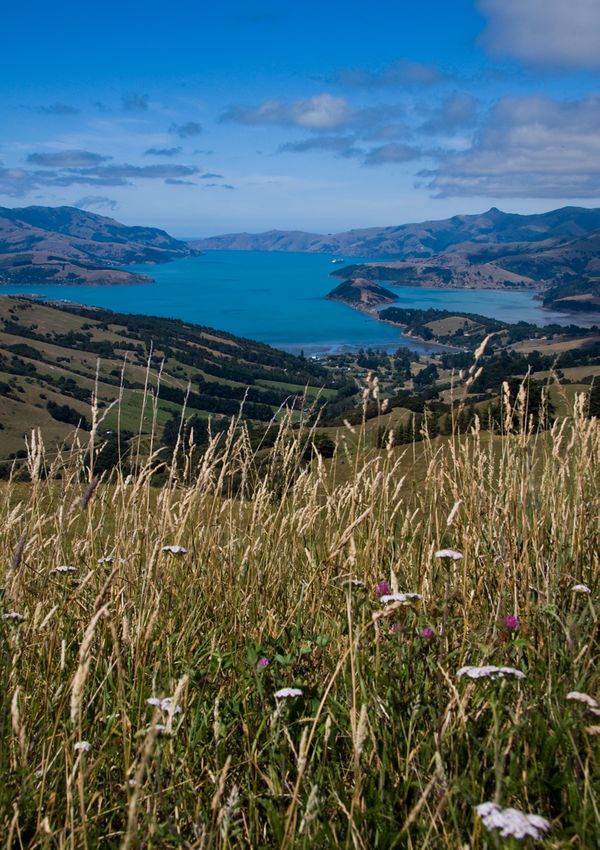
region’s rivers drain eastwards to the The unique colour of these lakes is derived from the suspended
coast. There are two types of river system, sediment (rock flour) sourced from the glaciated areas occurring
which respond differently to rainfall along and near the main divide.
events. The catchments of the major rivers
Note that all numbers given in the following tables are calculated
extends to the main divide, and the rivers
from the 1981-2010 normal period (a normal is an average
typically penetrate the foothills through
or estimated average over a standard 30-year period), unless
deep gorges. River flows gauged at the
otherwise stated. Also note that all data for Christchurch are
plains may be very high when there is a
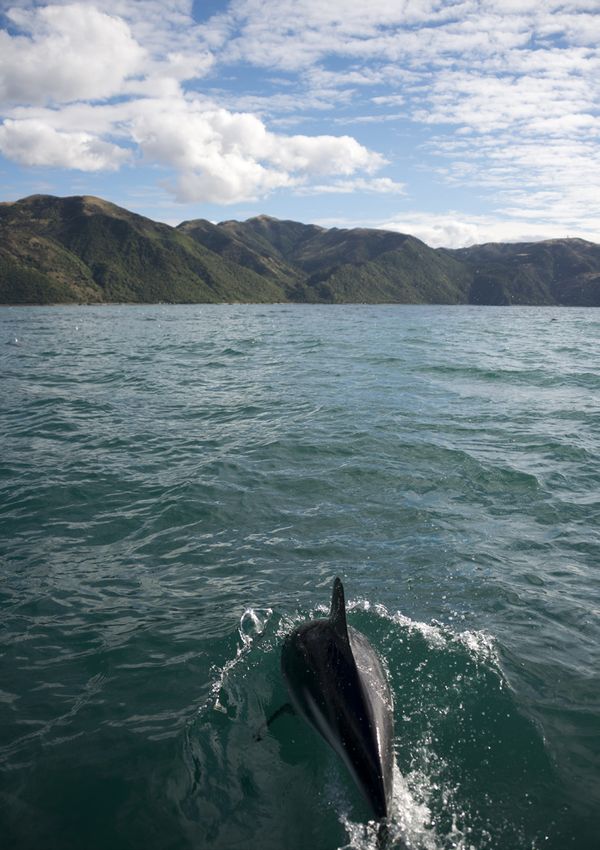
Photo: ©mychillybin.co.nz/Jeremy Town
recorded at the airport, unless otherwise stated.
heavy rainfall event along the divide, even
though there may be little or no rainfall
recorded on the plains at the time. Other
rivers rise on the eastern flanks of the
foothills, and their flow regimes may
differ considerably from the major rivers.
Some of the glacial lakes in the western
6
7
TYPICAL WEATHER
SITUATIONS IN
CANTERBURY
New Zealand lies in the zone of mid- Easterly-quarter airflows
latitude westerlies where a succession
Surface south-easterlies are very rare, except for sea breezes
of depressions (lows) and subtropical
south of Banks Peninsula, and where the flow is channeled by
anticyclones (highs) generally progress
valleys. Usually, there is an anticyclone to the south or east of New
eastwards over the country. Often, a
Zealand (Figure 2), and an inversion at about 1000-2000 m which
trough of low pressure separates two
prevents significant convection. However, in winter the freezing
highs, and it usually contains a frontal
level may lie below the inversion, and in the more southerly flows
system, which extends into one or more
there are frequent light showers. Otherwise, the typical cloud is
lows on the southern side of the highs.
stratus with a low base and periods of drizzle. Sea fog also occurs,
As the highs move east, New Zealand
especially between late-spring and early-autumn. The low cloud
experiences a regular weather sequence,
does not penetrate inland of the foothills, and it usually clears
which has a period of about a week. Whilst
during the day, except in winter or when there is also a sheet of
this pattern provides the basic framework
upper-level cloud.
of the day-to-day weather, the succession
is frequently interrupted.
In anticyclonic conditions the weather in
Canterbury is generally fine, but it is often
cloudy in winter if winds are onshore.
Approaching troughs of low pressure are
commonly preceded by extensive high
cloud, but significant precipitation east
of the main divide is rare at the frontal
passage unless it becomes slow-moving.
Orographic influences on the weather
in Canterbury are very strong. Westerly
airflows bring rainfall and cloudiness
along the main divide, but reduced rainfall
and increased sunshine hours farther
Figure 2. Mean sea level pressure analysis for 1200 hrs NZST on 19 November
east. Conversely, an easterly airflow often 1960.
results in rainfall and cloudiness for
the east coast and plains, but reduced
rainfall and increased sunshine hours
farther west. Because of the orographic
influence, both the pressure and airflow
patterns can be strongly disturbed in
Canterbury causing, for example, a lee
wave depression.
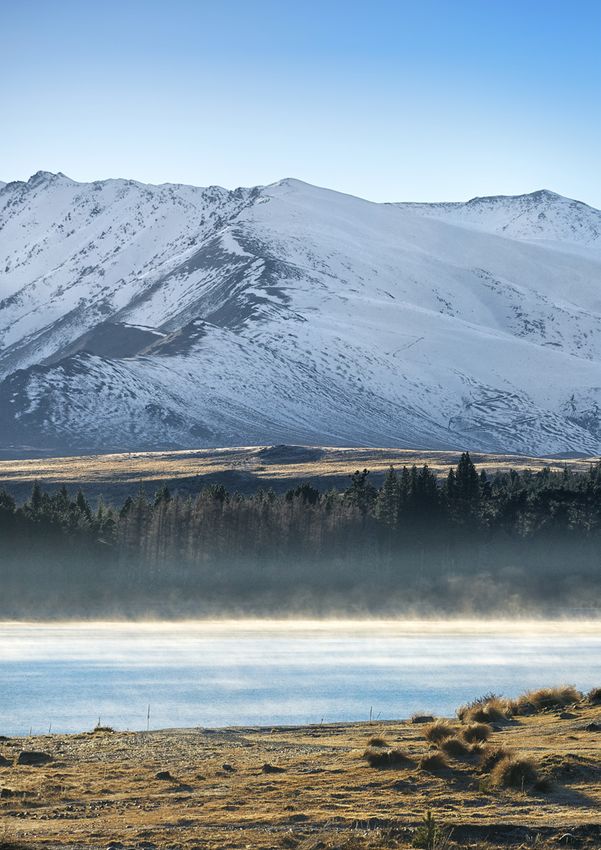
Photo: ©mychillybin.co.nz/Peter Mitchell
8
Southerly-quarter airflows
    These cold airflows have travelled over
    relatively warm sea and they are unstable.
    When the flow is anticyclonic, there
    is extensive low stratus and cumulus
    cloud, with frequent light showers. Cloud
    generally clears west of the Seaward
    Kaikoura Range and the eastern foothills,
    but it occasionally penetrates into the
    southern basins. With cyclonic flow
    (Figure 3), convection is stronger, and
    significant snowfalls may occur to low
    elevations, particularly in winter and
    spring. Summer convection on land is
                                                  Figure 3. Mean sea level pressure analysis for 1800 hrs NZST on 26 April
    intensified by daytime heating, and heavy
                                                  1965.
    afternoon or early evening showers may
    develop. At the passage of an active cold
    front, the south or south-west winds
    may be very strong. Eventually, the flow
    turns to the west as a trailing ridge
    approaches. As this happens, Canterbury
    is progressively sheltered by the high
    ground farther south. The sheltering effect
    begins inland and spreads to the coast, so
    that showers now only form over the sea
    and on exposed headlands.

    West-southwesterly airflows
    In deep south-west flows associated with
    strong outbreaks of polar air, the wind
    is south-west over the whole region,
    except in some of the river gorges
    where winds are often channeled to
    north-west. The weather is mainly fine
    throughout Canterbury and showers
    only affect exposed coastal areas, mainly
    north of the Rakaia mouth. Showers
    do not penetrate far inland as these
    areas are sheltered by the mountains
    of Southland and Otago. In many cases,
    especially in spring and summer, south-
    westerlies are comparatively shallow.
    Such cases are often associated with
    minor frontal disturbances. The post-
    frontal air penetrates quickly north-east
    along the east coast, but only very slowly
    inland, where the winds remain north-
    west. However, when winds are not too
    strong and the flow ahead of the frontal

9
disturbance is potentially unstable, the
combination of daytime heating and frontal
uplift may result in the formation of heavy
convective storms.
Northwesterly airflows
When the undisturbed flow is light or
moderate and stable (Figure 4), there
is strong resistance to the ascent of air
over the main divide. The flow is diverted
around the northern end of the South
Island, to return through Cook Strait and
along the east coast of Canterbury as a
north-easterly. With a strong unstable
flow, there is little resistance to ascent
over the main divide, and the wind is
north-west throughout Canterbury.
The weather is usually fine eastward of
Figure 4. Mean sea level pressure analysis for 0000 hours NZST on
the main divide, although convection 18 September 1982.
occasionally occurs towards the east
coast on summer afternoons, resulting
in showers from high-base cumulus.
There is strong diurnal variation in wind
strength, especially in winter, when a
nocturnal inversion often forms over the
plains. In such conditions, places above
the inversion (such as the hills of Banks
Peninsula) experience relatively high
temperatures while considerable frosts
may be present on the plains. Often the
warm north-westerlies reach the ground
over the inland plains but rise over the
cool north-east flow nearer the east coast.
As a result, there can be a considerable
difference between the air temperatures
observed at these locations, with coastal
temperatures at least several degrees
lower than those inland.
1011
CLIMATIC ELEMENTS
Wind
Wind direction over New Zealand in the
zone directly above the earth’s surface
may be interpreted from a mean sea
level pressure (MSLP) map, following the
general principle that in the Southern
Hemisphere air flows in a clockwise
direction around a depression (or a ‘low’),
and in an anticlockwise direction around
an anticyclone (or a ‘high’). As such, MSLP
maps can be used to indicate the general
wind direction at the earth’s surface.
However, actual wind direction and speed
at a particular locality is modified by the
influence of friction and topography. Along
the east coast of Canterbury the wind
regime is complicated by a cool sea breeze
from the easterly quarter, particularly in
late-spring, summer and early-autumn.
Sea breezes develop in Canterbury when
synoptic-scale pressure gradients are weak
(e.g. Figure 4), and are generated by air
temperatures over land becoming higher
than air temperatures over the sea. Figure
5 shows mean annual wind frequencies of
surface wind based on hourly observations
from selected Canterbury stations.

Mean wind speed data (average wind
speeds are taken over the 10 minute
period preceding each hour) are available
for a number of sites in Canterbury, and
these illustrate the several different wind
regimes of the region (Table 1). Mean wind
speeds are highest at coastal locations       Figure 5. Mean annual wind frequencies (%) of surface wind directions from
                                              hourly observations at selected Canterbury stations. The plot shows the
such as Le Bons Bay and Kaikoura, and
                                              directions from which the wind blows, e.g. the dominant wind direction at
lowest at the sheltered inland location       Christchurch Airport is from the east-north-east.
of Hanmer Springs. There is notable
variability in mean monthly wind speeds
over the course of a year in Canterbury,
where wind speeds are typically highest
from around mid-spring (October) to mid-
summer (January), and lowest from mid-
autumn to mid-winter (April to August).
This seasonality is observed across almost
all of the Canterbury region, but is more
pronounced at inland locations. Kaikoura
is typically windier than most areas of

                                                                                                                           12
Canterbury throughout the year, with this difference in in Canterbury, the actual number of strong wind days
mean wind speeds more prominent during the winter per season at those locations may be considerably
months. different. As shown in Tables 1 and 2, spring and
summer are typically the windiest seasons throughout
Table 2 gives the seasonal distribution and frequency
the region.
of occurrence of strong winds (defined as having a
daily mean wind speed of greater than 30 km/hr). For Diurnal variation in wind speed is well-marked, with
example, of all strong winds recorded at Christchurch, highest wind speeds occurring mid-afternoon before
35% (seven strong wind days, on average) occur decreasing overnight. This is because heating of
in spring. As a further example, Le Bons Bay and the land surface is most intense during the day, and
Rangiora share the same distribution of strong winds stronger winds aloft are brought down to ground
in autumn, with 26% of their respective annual strong level by turbulent mixing. Cooling at night generally
winds being recorded in that season. However, Le Bons restores a lighter wind regime. Table 3 gives average
Bay has an average of 25 strong wind days in autumn, wind speeds at three-hourly intervals for selected
compared to just 1 in Rangiora. This highlights that locations, whilst Figure 6 visually highlights the typical
although a similar seasonal distribution of strong diurnal variation of wind speed observed at two of
winds may be observed between different locations these sites.
Table 1. Mean monthly and annual wind speed (km/hr) for selected Canterbury locations, from all available data.
Location Jan Feb Mar Apr May Jun Jul Aug Sep Oct Nov Dec Ann
Le Bons Bay 23.0 22.2 23.0 22.1 22.2 23.7 21.1 22.0 24.3 24.1 23.7 23.5 22.9
Kaikoura 16.3 15.8 15.9 15.2 15.7 16.4 15.3 16.3 15.8 16.9 17.1 16.7 16.1
Lyttelton Harbour 18.1 17.2 16.4 14.0 14.1 13.6 13.1 14.8 16.0 17.4 17.7 18.3 15.9
Christchurch 17.3 16.3 14.9 13.0 12.2 11.1 11.4 12.8 14.4 15.9 16.6 17.1 14.4
Lake Tekapo 15.9 13.0 13.0 11.6 11.3 10.7 11.3 11.5 15.3 15.9 16.3 14.8 13.4
Darfield 13.7 13.4 13.3 11.6 11.7 12.1 11.3 12.0 14.3 14.4 14.6 14.5 13.1
Rangiora 11.6 10.7 10.0 8.8 9.3 9.1 8.7 10.0 10.9 11.4 11.4 11.8 10.3
Pukaki Aerodrome 13.4 10.7 10.3 8.9 8.5 6.6 7.7 8.3 11.5 12.4 12.7 12.5 10.3
Winchmore 11.4 10.3 10.2 9.0 9.0 8.2 8.4 9.5 11.5 11.7 12.0 11.7 10.3
Fairlie 11.0 8.4 8.8 8.3 9.9 9.4 10.4 9.2 11.1 11.0 10.5 9.6 9.8
Mt Cook Village 12.4 10.3 10.0 8.2 8.1 7.3 6.8 7.2 10.7 11.5 11.9 11.1 9.6
Timaru 10.4 9.7 9.4 8.3 8.2 8.4 8.2 8.6 9.7 10.9 10.8 10.5 9.4
Culverden 10.2 8.1 7.9 6.8 6.4 6.0 6.3 7.0 8.6 9.5 9.4 9.1 8.0
Hanmer Springs 7.7 6.9 6.8 5.7 5.9 5.5 5.2 6.0 8.1 8.5 8.4 8.2 6.9
Table 2. Seasonal distribution and frequency (mean number of days) of strong winds (daily mean wind speed > 30 km/hr) recorded at
selected Canterbury locations, from all available data.
Location Summer Autumn Winter Spring Annual
Distribution Frequency Distribution Frequency Distribution Frequency Distribution Frequency Frequency
Le Bons Bay 22% 21 26% 25 25% 25 27% 27 98
Kaikoura 23% 9 24% 10 26% 10 27% 11 40
Christchurch 28% 6 21% 4 16% 3 35% 7 20
Lake Tekapo 28% 5 15% 2 18% 3 39% 7 17
Mt Cook Village 30% 3 20% 2 15% 1 35% 4 10
Darfield 26% 2 15% 1 18% 2 41% 4 9
Timaru 24% 1 17% 1 23% 1 36% 2 5
Rangiora 16% 1 26% 1 20% 1 38% 2 5
Hanmer Springs 27% 1 10% 0.3 13% 0.4 50% 1 3
1325.0
Mt Cook Village Christchurch
Mean wind speed (km/hr)
20.0
15.0
10.0
5.0
0.0
0 3 6 9 12 15 18 21
Hour of day
Figure 6. Mean wind speed at selected hours of the day for Christchurch and Mt Cook Village.
Table 3. Mean wind speed (km/hr) at three-hourly intervals of the day.
Location 0000 0300 0600 0900 1200 1500 1800 2100
Christchurch 11.6 10.8 10.3 12.7 17.8 21.0 18.6 14.2
Darfield 11.3 11.2 11.2 12.3 14.7 16.7 15.4 12.3
Hanmer Springs 5.5 5.5 5.4 5.6 8.1 9.9 8.9 6.4
Kaikoura 15.0 14.4 14.1 14.1 17.1 18.0 16.7 15.8
Lake Tekapo 12.4 11.7 11.4 11.4 13.4 16.5 16.4 13.8
Le Bons Bay 23.2 22.4 22.1 22.4 24.0 24.4 23.9 23.5
Mt Cook Village 8.2 7.8 7.6 8.2 11.4 13.5 11.4 8.8
Rangiora 8.3 7.8 7.7 8.8 12.6 14.8 12.8 9.6
Timaru 7.7 7.4 7.4 8.3 11.2 14.3 11.7 8.5
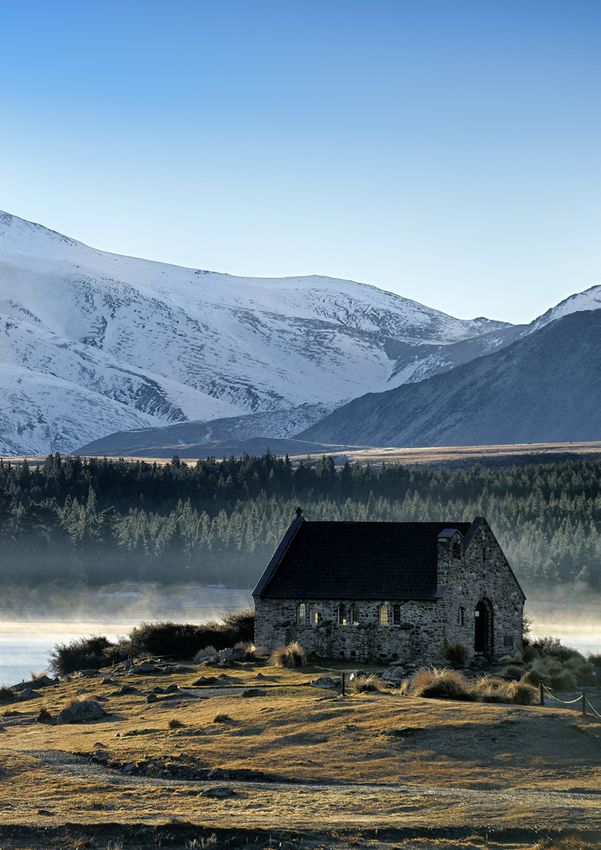
Photo: ©mychillybin.co.nz/Jeremy Town
14Gusty winds are relatively infrequent
throughout most lowland Canterbury
locations, occurring more frequently in
the mountain ranges and exposed coastal Table 4. Mean number of days per year with gusts exceeding 61 km/hr (33
knots) and 94 km/hr (50 knots) for selected locations.
locations. Christchurch experiences an
Days with Days with
average of 52 days per year with wind Location gusts >61 gusts >94
gusts exceeding 61 km/hr, considerably km/hr km/hr
less than Kaikoura where on average 97 Christchurch 52 2
such days per year are recorded (Table Darfield 43 1
4). Maximum gusts recorded at different Hanmer Springs 36 2
locations in Canterbury are listed in Table Kaikoura 97 17
5. The highest gust recorded in the region Lake Tekapo 69 5
(and for all New Zealand) was 250 km/hr, Mt Cook Village 108 15
occurring at Mt John (near Lake Tekapo) Mt John 158 72
on 18 April 1970 (http://www.niwa.co.nz/ Rangiora 30 0.6
education-and-training/schools/resources/ Timaru 34 2
climate/extreme).
Table 5. Highest recorded wind gusts at selected Canterbury locations, from all available data.
Location Gust (km/hr) Direction Date
Christchurch (Airport) 172.4 WNW 01/08/1975
Darfield 116.6 NW 05/05/2014
Hanmer Springs 137.2 NW 28/03/2001
Kaikoura 194.8 WNW 01/08/1975
Lake Tekapo 122.4 WNW 13/10/2006
Mt Cook Village 177.8 N 21/02/2004
Mt John 250.0 NW 18/4/1970
Rangiora 116.6 NW 22/09/2002
Timaru 164.9 WNW 01/08/1975
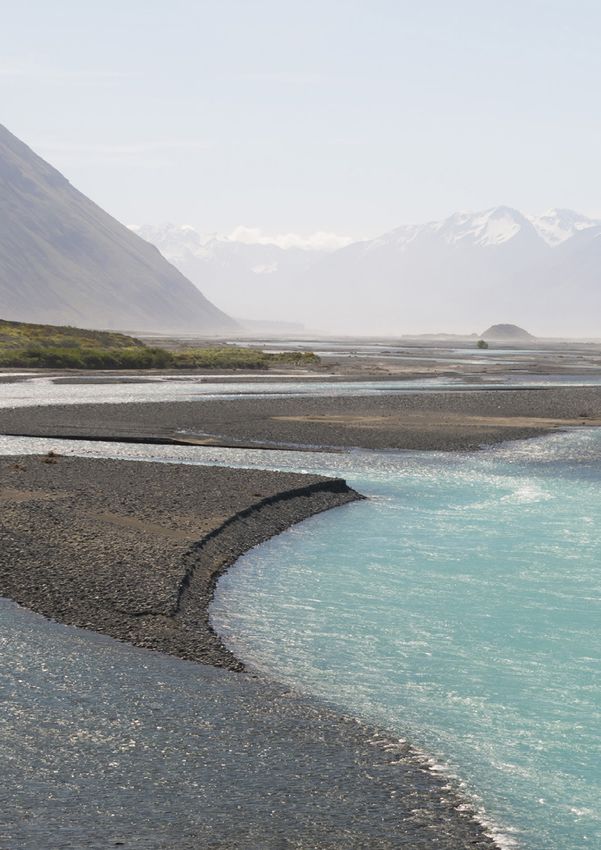
Photo: ©mychillybin.co.nz/Jeremy Town
15Rainfall
Rainfall distribution
Canterbury’s median annual rainfall is
shown in Figure 7, which clearly illustrates
how rainfall is affected by topography and
exposure to the main rain bearing airflows
from the west. Rainfall is highest along the
main divide which has both high elevation
and western exposure. This is the result
of orographic enhancement. Specifically,
moisture-laden air masses passing over
the Tasman Sea are forced to rise over the
western ranges. As these air masses rise,
they cool rapidly, causing the stored water
vapour to condense, resulting in rainfall.
The air masses continue eastwards,
but they hold significantly less moisture
once beyond the main divide. As a result,
there is a marked decrease eastwards
in median annual rainfall beyond the
Canterbury high country. The inland basins
of the MacKenzie Country are among
the driest areas of New Zealand. Here,
annual rainfall totals of below 500 mm are
typically recorded. This is approximately
ten times less than that which falls in
nearby high elevation locations in the
main divide. The inland basins typically Figure 7. Canterbury median annual total rainfall, 1981–2010.
aren’t quite as dry as Central Otago, where
annual rainfall totals below 400 mm are
common.
Table 6 lists monthly rainfall normals
and the percentage of annual total for
selected locations. Many Canterbury
locations observe a maximum of rainfall
in late-autumn and winter. For example,
Christchurch, Kaikoura and Akaroa
receive 31%, 32% and 37% of their
annual rainfall during winter respectively.
Methven, Timaru, Waimate and Tara
Hills receive a fairly even distribution of
rainfall throughout the year, with a peak
in December. Akaroa observes a notable
summer rainfall minimum, with just 16%
of annual rainfall falling from to December
to February.
16Table 6. Monthly and annual rainfall normal (a; mm), and monthly distribution of annual rainfall (b; %) at selected Canterbury
locations, for the period 1981–2010.
Location Jan Feb Mar Apr May Jun Jul Aug Sep Oct Nov Dec Ann
a 51 53 68 67 92 101 131 123 70 82 70 63 969
Akaroa
b 5 5 7 7 9 10 14 13 7 8 7 6
a 414 267 341 342 377 401 305 352 430 483 424 508 4642
Arthur’s Pass
b 9 6 7 7 8 9 7 8 9 10 9 11
a 53 53 57 49 63 57 64 62 48 59 59 57 681
Ashburton
b 8 8 8 7 9 8 9 9 7 9 9 8
a 62 55 80 63 70 92 84 100 98 101 77 84 967
Castle Hill Village
b 6 6 8 6 7 9 9 10 10 10 8 9
a 38 42 45 46 64 61 68 64 41 53 46 50 618
Christchurch
b 6 7 7 7 10 10 11 10 7 9 7 8
a 28 44 47 57 46 50 58 53 32 48 63 52 576
Culverden
b 5 8 8 10 8 9 10 9 6 8 11 9
a 54 57 64 53 68 67 74 75 55 62 62 65 756
Darfield
b 7 8 8 7 9 9 10 10 7 8 8 9
a 39 52 59 56 57 75 92 67 57 63 59 47 721
Kaikoura
b 5 7 8 8 8 10 13 9 8 9 8 7
a 44 36 49 45 57 60 50 58 50 50 41 52 591
Lake Tekapo
b 7 6 8 8 10 10 8 10 9 8 7 9
a 75 70 80 65 75 66 78 80 64 80 74 90 895
Methven
b 8 8 9 7 8 7 9 9 7 9 8 10
a 423 260 380 344 365 322 265 301 345 416 367 497 4285
Mt Cook Village
b 10 6 9 8 9 8 6 7 8 10 9 12
a 47 53 50 50 59 64 78 66 51 57 54 57 688
Rangiora
b 7 8 7 7 9 9 11 10 7 8 8 8
a 48 33 43 36 46 46 39 36 36 38 42 62 506
Tara Hills (Omarama)
b 9 7 8 7 9 9 8 7 7 8 8 12
a 48 52 48 38 47 39 46 44 37 50 50 52 550
Timaru
b 9 9 9 7 9 7 8 8 7 9 9 10
a 50 45 49 44 38 37 49 42 37 46 43 56 536
Waimate
b 9 8 9 8 7 7 9 8 7 9 8 11
a 58 41 45 56 36 53 54 63 63 39 60 52 620
Waipara
b 9 7 7 9 6 9 9 10 10 6 10 8
17Christchurch Timaru Lake Tekapo
50 100 150 200 250 300
50 100 150 200 250 300
50 100 150 200 250 300
Rainfall (mm)
Rainfall (mm)
Rainfall (mm)
0
0
0
J FM AMJ J A S ON D J FM AMJ J A S ON D J FM AMJ J A S ON D
Kaikoura Arthur’s Pass
300 600 900 1200 1500
Highest Monthly Total
0 50 150 250 350 450
90 Percentile Value
Rainfall (mm)
Rainfall (mm)
Mean
0
10 Percentile Value
J FM AMJ J A S ON D J FM AMJ J A S ON D Lowest Monthly Total
Figure 8. Monthly variation of rainfall for selected Canterbury locations from all available data.
The distribution of monthly rainfall is shown in Figure 8. one month to twelve months (annual), with each time
The 10th percentile, 90th percentile, and mean rainfall period that is longer than one month beginning with
values for each month are shown along with maximum the month stated. For example, using the table for
and minimum recorded values for several stations. Christchurch (Table 8), it can be seen that in the three
month period beginning in January, 75 mm or more of
Rainfall variability is further indicated by rainfall
rainfall can be expected in nine years in ten, while a
deciles, as given in Tables 7, 8 and 9. The 10th
total of 246 mm or more should occur, on average, in
percentile values show the accumulated rainfalls
only one year in ten.
that will normally be exceeded in nine out of ten
years, whilst the 90th percentile values indicate the
accumulated falls that will normally be exceeded in
only one year in ten. The tables include periods from
Table 7. Rainfall means and deciles at monthly, 3-monthly, 6-monthly, 9-monthly and annual intervals for Arthur’s Pass
from all available data.
Arthur’s Pass Jan Feb Mar Apr May Jun Jul Aug Sep Oct Nov Dec
1 month 90th 635 555 591 679 645 523 499 520 686 785 745 739
Mean 370 283 310 359 358 310 279 307 382 463 401 398
10th 107 93 121 117 137 131 110 135 133 216 140 131
3 months 90th 1449 1412 1484 1434 1348 1262 1420 1646 1769 1794 1857 1641
Mean 966 954 1029 1028 941 897 966 1147 1254 1262 1159 1057
10th 560 559 563 658 597 552 525 685 743 720 620 562
6 months 90th 2626 2561 2531 2598 2763 2893 2995 3051 3020 2825 2879 2806
Mean 1993 1900 1924 1997 2106 2153 2235 2320 2298 2218 2123 2081
10th 1435 1401 1337 1432 1438 1621 1560 1707 1681 1539 1453 1451
9 months 90th 3834 3988 4197 4263 4191 4048 4125 4076 4207 4093 3980 3909
Mean 2959 3063 3186 3275 3273 3197 3197 3282 3317 3245 3060 2989
10th 2073 2242 2235 2321 2476 2412 2449 2498 2403 2429 2239 2240
Annual 90th 5317
Mean 4245
10th 3117
18Table 8. Rainfall means and deciles at monthly, 3-monthly, 6-monthly, 9-monthly and annual intervals for
Christchurch from all available data.
Christchurch Jan Feb Mar Apr May Jun Jul Aug Sep Oct Nov Dec
1 month 90th 105 88 113 108 146 124 145 112 89 92 84 107
Mean 51 43 51 55 69 65 69 56 44 47 47 55
10th 16 12 12 16 19 21 23 18 11 12 14 14
3 months 90th 246 249 262 292 299 306 264 238 211 237 242 233
Mean 145 150 174 186 202 189 169 148 138 148 152 149
10th 75 69 87 103 121 103 86 75 72 79 77 78
6 months 90th 462 492 514 492 475 450 424 422 411 446 432 455
Mean 330 346 359 354 349 327 315 299 287 294 302 323
10th 211 217 234 226 230 206 212 191 182 184 182 193
9 months 90th 679 665 671 662 653 638 631 615 627 647 665 669
Mean 497 493 497 502 501 475 462 449 462 479 499 509
10th 343 341 357 353 358 330 322 304 310 338 335 344
Annual 90th 839
Mean 644
10th 461
Table 9. Rainfall means and deciles at monthly, 3-monthly, 6-monthly, 9-monthly and annual intervals for Lake Tekapo
from all available data.
Lake Tekapo Jan Feb Mar Apr May Jun Jul Aug Sep Oct Nov Dec
1 month 90th 95 81 85 104 118 108 95 99 108 103 80 104
Mean 48 39 45 51 57 54 51 53 52 52 45 50
10th 11 5 9 9 17 10 12 15 15 15 10 12
3 months 90th 212 226 242 258 248 239 233 233 234 234 225 212
Mean 131 135 153 160 162 159 157 157 149 148 143 136
10th 62 57 69 89 102 79 71 80 75 79 86 74
6 months 90th 424 426 433 467 449 428 441 406 380 396 408 415
Mean 291 294 309 315 321 309 305 301 287 279 278 288
10th 180 166 191 202 211 200 199 218 187 171 164 165
9 months 90th 610 604 620 630 582 592 558 553 588 586 597 609
Mean 447 453 460 463 463 444 432 432 438 440 438 445
10th 294 311 313 336 354 331 308 317 309 291 282 279
Annual 90th 767
Mean 595
10th 425
Rainfall frequency and intensity
Table 10 lists the average number of days per month to more total days of rain when compared to other
with at least 0.1 mm (a ‘rain day’) and 1 mm (a ‘wet seasons. The average number of rain days each year
day’) of rain for selected locations. The number of rain varies from 87 days at Waipara to 171 days at Mt Cook
and wet days recorded at a given station tends to be Village. Tara Hills and Lake Tekapo exhibit the lowest
higher near the main divide and foothills, and lower number of wet days in the region, with 72 and 74 wet
near the east coast and in inland basins. The inland days recorded on average respectively, compared with
basins experience considerably fewer rain and wet 153 wet days at Mt Cook Village.
days than nearby western-most locations, which is due
to the rain-shadow (sheltering) created by the main
divide. The seasonal variation of rain days and wet days
in Kaikoura is relatively small. Therefore, the winter
maximum of rainfall observed may be largely attributed
to there being more heavy falls of rain, as opposed
19Table 10. Average monthly rain days (a; days where at least 0.1 mm rainfall is measured) and wet days (b; days where at least 1 mm
rainfall is measured) at selected Canterbury locations.
Location Jan Feb Mar Apr May Jun Jul Aug Sep Oct Nov Dec Ann
a 7 6 8 8 10 11 12 10 9 9 8 8 107
Akaroa
b 6 5 7 7 9 10 11 9 8 7 7 7 93
a 13 11 12 13 13 13 12 14 16 17 15 15 166
Arthur’s Pass
b 12 10 11 12 12 12 11 13 15 16 14 14 152
a 10 9 10 11 11 10 11 11 10 11 11 11 126
Ashburton
b 7 7 7 7 8 7 8 8 7 8 8 8 89
a 8 6 7 7 8 7 6 7 7 8 9 9 88
Castle Hill
b 7 6 6 7 7 6 6 7 7 8 8 8 84
a 9 8 9 10 12 12 13 11 9 10 9 10 122
Christchurch
b 7 5 6 7 8 9 9 7 7 7 7 7 86
a 8 7 7 8 9 9 10 8 8 9 8 8 99
Culverden
b 7 6 6 6 7 7 8 7 7 8 7 6 82
a 10 9 9 10 10 10 11 10 10 11 10 11 120
Darfield
b 7 7 7 7 8 8 8 8 7 8 8 8 92
a 8 7 9 9 9 9 9 9 8 8 8 9 103
Kaikoura
b 7 6 7 7 8 8 8 8 7 7 7 7 86
a 7 6 7 8 9 8 8 9 9 9 8 8 97
Lake Tekapo
b 6 5 5 6 7 6 6 7 7 7 6 6 74
a 11 10 10 10 10 9 10 10 10 11 11 11 123
Methven
b 8 8 8 8 8 7 8 8 8 9 9 9 97
a 14 12 14 14 14 13 13 14 15 16 16 15 171
Mt Cook Village
b 12 10 12 13 13 12 12 13 13 15 14 14 153
a 10 9 8 11 12 12 12 12 9 12 9 10 124
Rangiora
b 6 6 5 7 7 7 7 7 5 8 6 7 77
a 8 7 8 8 10 12 11 11 10 11 8 10 113
Tara Hills (Omarama)
b 6 5 5 5 6 7 5 6 6 7 6 7 72
a 11 10 10 10 9 8 9 8 8 10 10 11 114
Timaru
b 8 7 7 7 6 6 6 6 6 7 7 8 81
a 12 10 11 10 9 9 9 9 9 11 11 12 122
Waimate
b 8 7 8 7 7 6 6 6 7 8 8 9 87
a 6 6 6 7 8 8 8 8 7 8 7 8 87
Waipara
b 5 5 6 6 7 6 7 7 6 7 6 7 75
The heaviest short period rainfalls in Canterbury are calculated return periods are given for Christchurch
recorded nearest the main divide, which often occur and Mt Cook Village. Also listed in this table are the
when persistent west/northwesterly airflows are maximum rainfalls expected in 2, 5, 10, 20, and 50
established as a trough approaches the South Island. years. Depth-duration frequency tables for Canterbury
For remaining areas of Canterbury, heavy short period locations are available from NIWA’s High Intensity
rainfalls occur with the passage of a depression over Rainfall Design System (HIRDS). HIRDS uses the index-
or close to the region, or in association with slow frequency method to calculate rainfall return periods.
moving fronts. Eastern areas of Canterbury typically For more information on methods and to use the tool,
experience heaviest 12-hour to 72-hour period see hirds.niwa.co.nz.
rainfall when a depression is centred to the east of
the South Island, due to the prevalence of moisture-
laden easterly or south-easterly winds under such
circumstances. In Table 11, maximum short period
rainfalls for periods of 10 minutes to 72 hours with
20Table 11. Maximum recorded short period rainfalls and calculated return periods (or average recurrence intervals, ARI) from HIRDS.
Location 10min 20min 30min 1hr 2hrs 6hrs 12hrs 24hrs 48hrs 72hrs
Christchurch a 16.1 20.3 21.5 27.4 50.6 80.6 107.9 118.4 121.3 137.6
b Jan Nov Nov Mar Mar Mar Jan Jan Jan Apr
1968 1979 1979 1975 1975 1975 1980 1980 1980 1968
c 100+ 71 37 23 75 83 89 40 18 18
d 4.7 6.9 8.6 12.7 17.6 29.4 40.6 56.1 69.0 77.9
e 6.4 9.5 11.9 17.5 23.8 39.0 53.1 72.4 89.1 100.6
f 7.9 11.7 14.7 21.6 29.2 47.0 63.5 85.8 105.6 119.2
g 9.7 14.3 17.9 26.4 35.4 56.2 75.3 101.0 124.2 140.2
h 12.6 18.6 23.3 34.3 45.4 71.0 94.0 124.6 153.3 173.0
Mt Cook Village a 11.6 22.7 31.8 50.0 70.4 164.5 287.2 442.8 665.2 768.3
b Dec Dec Dec Dec Mar Mar Apr Apr Apr Apr
2000 2000 2000 2000 2004 2004 2009 2009 2009 2009
c 23 33 33 19 12 19 32 29 98 100+
d 6.2 11.0 15.4 27.4 45.3 100.2 165.4 273.0 334.5 376.6
e 8.0 14.3 20.1 35.7 58.0 124.8 202.5 328.5 402.4 453.1
f 9.6 17.1 23.9 42.6 68.3 144.3 231.5 371.3 454.8 512.1
g 11.3 20.2 28.3 50.4 79.9 166.0 263.3 417.6 511.5 575.9
h 14.1 25.1 35.1 62.6 97.9 198.8 310.9 486.1 595.5 670.5
a: highest fall recorded (mm)
b: month and year of occurrence
c: calculated return period of a (years)
d: max fall calculated with ARI 2 years (mm)
e: max fall calculated with ARI 5 years (mm)
f: max fall calculated with ARI 10 years (mm)
g: max fall calculated with ARI 20 years (mm)
h: max fall calculated with ARI 50 years (mm)
Recent extreme events in Canterbury
Canterbury has experienced numerous extreme during April 2014. Winchmore experienced its wettest
weather events, with significant damage and disruption April on record at the time, with 301 mm recorded
caused by heavy rain and flooding. The events listed there (599% of the April normal). In Christchurch
below are some of the most severe rainfall and (Riccarton), 224 mm of rain was recorded (499% of
flooding events to have affected the Canterbury region the April normal): the second-wettest April observed
between 1986 and 2015. there on record at the time. Farther north, Kaikoura
recorded 264 mm of rain in April (475% of the April
March - April 2014: March and April 2014 were
normal). Christchurch (Riccarton) received a total of
remarkably wet months for eastern parts of
424 mm of rain for the March-April 2014 period. This is
Canterbury. Christchurch (Riccarton) endured its
more than four-times greater than the normal March-
wettest March on record at the time (records began in
April rainfall, with the city receiving 71% of its average
1863). Additionally, of the 200 mm (437% of the March
annual rainfall over the two-month period.
normal) that fell during the month at Christchurch,
123 mm accumulated on one day (4 March), which 11–14 December 1995: Heavy rain during this period
was the greatest one-day March rainfall on record was caused by a front that stalled over the southern
for the city at the time. The highest one-day rainfall South Island. On the evening of 11 December, an active
total in New Zealand for the month of March 2014 cold front crossed Fiordland and Southland, preceded
was 153 mm, recorded at Lyttelton on the 4th. These by a long fetch of northerlies originating from the sub-
records were largely as a result of heavy rain that fell tropics. During 12 December, this front was blocked
on 4 and 5 March, which caused considerable flooding by a large high east of New Zealand and became
throughout Christchurch and surrounding areas. At stationary, while a weak southerly spread into eastern
least 100 homes in Woolston, Richmond, St Albans and parts of the South Island. Overrunning of moist warm
Mairehau were inundated with water, and residents air produced high rainfalls in eastern areas on this
of Akaroa and Sumner were temporarily isolated by day. The combination of snow-melt and heavy rain in
flooding. Further significant rainfall was recorded the headwaters contributed to a major flood event, and
21the hydro-lakes were at abnormally high levels. A Civil in the 24-hours from 9 a.m. on 12 March to 9 a.m.
Defence Emergency was declared for Hakataramea, the following day, and reported its worst flood since
Waimate and Omarama districts. Seventeen people 1929. Rangiora recorded 86 mm of rain in the three
were evacuated from seven houses at Hakataramea, hours from 1 a.m. to 4 a.m. on 13 March, and Timaru
and 35 people were evacuated from Omarama. Rivers recorded 100 mm of rain in the 48-hours to 9 a.m. on
throughout Canterbury were running high. The Waitaki 13 March.
River at the Waitaki Dam had a peak flow of 3,300
cumecs: the highest flow since recordings began 55 Periods of low rainfall
years earlier. Farther north, the main trunk railway line Periods of fifteen days or longer with less than 1mm
was washed out near Rangitata. Mount Cook Village of rain on any day are referred to as ‘dry spells’.
recorded 515 mm of rain in 72-hours from 9 a.m. on Dry spells are quite common in most areas of
11 December to 9 a.m. on 14 December. Canterbury, however they occur relatively infrequently
in the western-most parts of the region. Dry spells
12–13 March 1986: A very intense rainstorm brought
throughout Canterbury typically occur when a
flooding to large parts of Canterbury, resulting in very
persistent (blocking) anticyclone becomes established
high damage costs and stock losses. Two key features
over the South Island. Additionally, the western ranges
combined to create this extreme event. Firstly, warm
provide a great deal of sheltering for eastern areas,
and moist air originating from a tropical cyclone near
such that dry spell conditions can occur in westerly
the Kermadec Islands spread down onto the South
and north-westerly airstreams. Table 12 outlines
Island. Secondly, a high-latitude anticyclone brought
the dry spell frequency and duration for selected
cool south-easterly air up the east coast of the South
Canterbury locations. On average, a dry spell occurs
Island. Convergence between the cool and warm
once every four months in Christchurch, and once
airmasses resulted in intense convection. The highest
every fourteen months in Arthur’s Pass. To date,
rainfalls of the event occurred in the Timaru district
the longest dry spell is 49 days, recorded in Lake
and the western foothills of Ashburton, especially near
Tekapo on three separate occasions. Table 13 shows
Peel Forest. A Civil Defence Declaration was in place
the seasonal distribution of dry spells at selected
for the entire Canterbury region. The flood damage
Canterbury locations. Dry spell occurrence is fairly
to property, roads, railway lines, bridges, crops and
evenly distributed throughout the year in Lake Tekapo.
livestock throughout South Canterbury was extensive,
In contrast, dry spell occurrence is notably infrequent
and estimated to cost $60,000,000 (1986 dollars).
during spring in Arthur’s Pass, reflecting the high
Other damage costs included another $6,170,000 (1986
frequency of westerly airflows in that season.
dollars) to river control works such as embankments
and plantings. Geraldine recorded 102 mm of rain
Table 12. Average dry spell (at least 15 consecutive days with less than 1 mm rainfall per day) frequency and duration for selected
Canterbury locations, from all available data.
Location Frequency Mean duration Max duration Max duration date
(days) (days)
Arthur’s Pass One every 14 months 19 37 18/5/1922 to 23/6/1922
Christchurch One every 4 months 20 44 2/8/1911 to 14/9/1911
Lake Tekapo One every 3 months 21 49 18/2/1930 to 7/4/1930
30/9/1937 to 17/11/1937
10/2/1976 to 29/3/1976
Table 13. Seasonal distribution (%) of dry spells at selected Canterbury locations, from all available data.
Location Summer Autumn Winter Spring
Arthur’s Pass 28% 32% 33% 7%
Christchurch 27% 27% 19% 27%
Lake Tekapo 27% 27% 24% 22%
22Temperature
Sea surface temperature
Monthly mean sea surface temperatures (SST) off the 18
east coast of Canterbury are compared with mean 16
14
air temperature for Christchurch and Lake Tekapo in
Temperature (°C)
12
Figure 9. There is a lag in the increase of sea surface 10
temperatures when compared to air temperatures 8
6
from July to September. This may be at least in part 4
attributed to the greater heat capacity of the sea 2
compared to land, which results in the sea surface 0
Jan Feb Mar Apr May Jun Jul Aug Sep Oct Nov Dec
temperatures taking longer to increase and decrease Month
in response to changing seasons compared to land- Christchurch air temp Lake Tekapo air temp Sea surface temp
based areas. Christchurch records considerably higher
mean air temperatures in winter compared to the Figure 9. Mean monthly air temperature (Christchurch and
inland location of Lake Tekapo. This may be partly Lake Tekapo) and estimated sea surface temperatures (off the
east coast of Canterbury).
attributed to the moderating influence of the sea on
overnight minimum temperatures near the coast.
Figure 10 shows the mean sea surface temperatures
for the New Zealand region for February and August,
which are the warmest and coolest months with
respect to sea surface temperatures.
A) MEAN FEBRUARY SST (°C) B) MEAN AUGUST SST (°C)
Figure 10. Monthly mean sea surface temperatures (°C) for: a) February; b) August. Source: NIWA SST Archive, Uddstrom and Oien
(1999).
Air temperature temperatures are recorded throughout Canterbury,
Canterbury typically observes afternoon temperatures with the notable exception of high elevation hills and
reaching between 20°C and 23°C in summer, and mountains where temperatures become increasingly
overnight temperatures falling to between -2°C and lower as elevation increases. In winter, daily minimum
4°C in winter (Figure 11). Similar daily maximum temperatures become lower as distance from the
23Figure 11. Left: Canterbury median summer (December, January and February) average daily maximum temperature; Right:
Canterbury median winter (June, July and August) average daily minimum temperature, 1981–2010.
east coast and elevation increases. Figure 12 shows
the median annual average temperature in the
Canterbury region, and clearly demonstrates that
lower temperatures are recorded at higher elevation
locations. Locations near the coast and on the plains
have a median annual temperature of between 11°C
and 13°C. Median annual temperatures are between
10°C and 11°C nearer the foothills, and between
8°C and 10°C in the inland basins. Median annual
temperatures of below 2°C occur along the main divide
especially around Mt Cook, which contributes to the
perennial snow and glaciers at high elevations in those
areas. Figure 13 gives the monthly temperature regime
(highest recorded, mean monthly maximum, mean
daily maximum, mean, mean daily minimum, mean
monthly minimum, and lowest recorded) for selected
locations in Canterbury.
Figure 12. Canterbury median annual average temperature,
1981–2010.
24Christchurch Hanmer Springs Kaikoura
5 15 25 35 45
5 15 25 35 45
5 15 25 35 45
Temperature (oC)
Temperature (oC)
Temperature (oC)
-15 -5
-15 -5
-15 -5
J F M A M J J A S O N D J F M A M J J A S O N D J F M A M J J A S O N D
Lake Tekapo Timaru
Highest Recorded
5 15 25 35 45
5 15 25 35 45
Mean Monthly Maximum
Temperature (oC)
Temperature (oC)
Mean Daily Maximum
Mean
Mean Daily Minimum
-15 -5
-15 -5
Mean Monthly Minimum
Lowest Recorded
J F M A M J J A S O N D J F M A M J J A S O N D
Figure 13. Monthly variation in air temperatures for selected Canterbury locations from all available data.
Table 14 shows that the average daily temperature Tekapo isn’t as pronounced as may be expected given
range, i.e. the difference between the daily maximum its inland location. This is because the town is located
and minimum temperature, is typically smaller at the at a relatively high elevation (the local climate station
coast (e.g. Kaikoura) than in inland areas (e.g. Hanmer is 762 metres above sea level), which constrains the
Springs). This is the case for most of the year, however daily maximum air temperatures, particularly during
the difference is most prominent from January to the summer months.
April. The average daily temperature range in Lake
Table 14. Average daily temperature range (Tmax – Tmin, °C) for selected Canterbury locations.
Location Jan Feb Mar Apr May Jun Jul Aug Sep Oct Nov Dec Ann
Christchurch 10.0 9.7 9.5 9.5 9.3 9.2 9.0 9.3 9.8 10.2 10.4 10.0 9.6
Hanmer Springs 13.7 13.8 13.3 12.8 11.8 11.1 11.0 11.8 12.4 12.6 12.8 13.0 12.5
Kaikoura 7.5 7.2 6.9 6.5 6.2 5.9 5.7 6.0 6.8 7.3 7.3 7.4 6.7
Lake Tekapo 12.9 13.2 12.6 11.3 9.8 8.9 8.8 9.7 10.9 11.6 12.0 12.5 11.2
Timaru 10.0 9.7 9.6 9.6 9.3 9.1 9.0 9.3 9.8 10.2 10.4 9.8 9.6
Table 15. Median hourly mean air temperatures for January and July at Christchurch and Lake Tekapo.
00 01 02 03 04 05 06 07 08 09 10 11
January 14.7 14.4 14.0 14.0 13.8 13.7 13.7 14.4 15.7 16.8 17.8 18.8
July 5.3 4.8 4.6 4.3 4.0 3.9 3.8 3.7 3.6 3.8 5.4 7.3
Christchurch 12 13 14 15 16 17 18 19 20 21 22 23
January 19.3 19.8 19.9 19.8 19.2 18.7 18.1 17.3 16.2 15.7 15.3 15.1
July 8.7 9.5 9.9 10.0 9.7 8.9 7.8 7.0 6.5 6.2 6.0 5.6
00 01 02 03 04 05 06 07 08 09 10 11
January 11.4 11.1 10.8 10.3 9.8 9.6 9.5 11.2 13.2 14.8 16.1 17.4
July -0.2 -0.3 -0.4 -0.6 -0.7 -0.8 -0.8 -0.9 -0.8 -0.6 0.9 2.6
Lake Tekapo 12 13 14 15 16 17 18 19 20 21 22 23
January 18.4 19.3 19.9 20.1 20.2 19.9 19.2 18.2 16.8 14.4 13.2 12.3
July 3.8 4.4 5.1 5.4 5.1 4.2 2.0 0.9 0.6 0.6 0.2 0.0
2525
Table 15 and Figure 14 further highlight
20
the diurnal temperature range, showing
Temperature (°C)
15
the median hourly mean air temperature
for January and July at Christchurch and 10
Lake Tekapo. Air temperatures at Lake 5
Tekapo remain lower than Christchurch 0
at all hours of the day in July, but become -5
higher from 3 p.m. to 8 p.m. in January. 0 1 2 3 4 5 6 7 8 9 10 11 12 13 14 15 16 17 18 19 20 21 22 23
Note that hourly mean air temperature Time (hours)
at a given time is calculated as the mean Christchurch (January) Lake Tekapo (January)
of many air temperature observations Christchurch (July) Lake Tekapo (July)
recorded over the previous hour. As such,
both the daily maximum and minimum Figure 14. Median hourly mean air temperatures at Christchurch and Lake
Tekapo in January and July.
air temperatures calculated from hourly
values are dampened, resulting in a
reduced diurnal temperature range
Canterbury record considerably more days with a minimum
(Table 15) compared to the absolute daily
temperature below 0°C compared to locations closer to the
temperature range (Table 14) recorded at
coast. Indeed, the inland basins of Canterbury frequently observe
Christchurch and Lake Tekapo.
New Zealand’s lowest daily minimum temperature during winter.
Maximum air temperatures in excess The highest air temperature recorded in Canterbury to date is
of 25°C occur relatively frequently 42.4°C at Rangiora on 7 February 1973. This temperature is
throughout the plains, particularly in additionally the highest recorded in New Zealand, and occurred
Darfield, where an annual average of 45 on the last day of an extremely hot spell in Rangiora between
such days occur (Table 16). Furthermore, 31 January and 7 February 1973. During these eight days, the
locations on the plains reach maximum air average daily maximum temperature was 32.1°C, with the
temperatures in excess of 30°C relatively temperature reaching at least 32.5°C on five out of the eight
frequently when compared to remaining days. Tara Hills (Omarama) recorded the lowest air temperature
parts of New Zealand. Inland parts of in Canterbury; -21.0°C on 24 June 2015.
Table 16. Highest and lowest recorded air temperatures, average number of days per year where maximum air
temperature exceeds 30°C and 25°C, and average number of days per year where the minimum air temperature falls
below 0°C, for selected Canterbury locations from all available data.
Highest Annual days Annual days max Lowest recorded Annual days
Location
recorded (°C) max temp > 30°C temp > 25°C (°C) min temp < 0°C
Akaroa 35.5 5 35 -8.0 11
Arthur’s Pass 32.1 0.03 3 -12.5 90
Ashburton 41.3 7 39 -11.6 51
Christchurch 41.6 3 25 -7.2 34
Culverden 38.0 6 41 -11.0 70
Darfield 40.7 8 45 -11.8 34
Kaikoura 34.3 1 14 -1.0 0.1
Lake Tekapo 33.5 0.8 17 -16.7 100
Mount Cook Village 32.8 0.3 11 -13.9 98
Rangiora 42.4 5 31 -7.6 47
Tara Hills (Omarama) 34.9 3 25 -21.0 88
Timaru 41.3 2 17 -9.1 35
Waimate 39.0 2 17 -10.0 36
Waipara 38.0 7 43 -7.5 25
26Earth temperatures
Earth (soil) temperatures are measured once daily variation of earth temperatures (not shown) decreases
at 9 a.m. at several Canterbury locations. Earth with increasing depth, such that earth temperatures
temperatures are measured at varying depths and are may show little-to-no diurnal variation at 100 cm
important for determining the growth and development depth.
of plants. Different plants have different rooting
depths and as such, earth temperatures are routinely Frosts
monitored at 10, 20, 30, 50, and 100 cm depths. Table 17 Frost is a local phenomenon and both its frequency
lists mean monthly earth temperatures for a number of occurrence and intensity can vary widely over
of standard depths. At the coastal Christchurch small areas. Frosts occur most frequently in winter
location, higher winter earth temperatures are during periods of anticyclonic conditions, primarily
observed when compared to the inland location of for two reasons. Firstly, clear skies associated with
Tara Hills. anticyclones enhance the rate of radiative cooling
during the night. Secondly, anticyclones are associated
Figure 15 shows how earth temperatures change
with light winds, which reduces the amount of
throughout the year at Christchurch, compared with
turbulent mixing of air. Cold air is relatively dense, so
mean air temperature. The 10 cm earth temperatures
when there is a lack of turbulent mixing it tends to sink
are lower than the mean air temperature except
towards the earth surface. Therefore, areas most likely
during summer. The annual earth temperature cycle
to experience frost are flat areas, where relatively cold
at 100 cm depth is more dampened and lagged than
air is not able to drain away on calm nights, and in
at shallower depths. As a result, earth temperatures
valleys and basins, where relatively cold air pools after
at 100 cm remain above mean air temperature in June
descending from higher elevation areas nearby. Under
and July, but fall slightly below mean air temperatures
such conditions, temperature inversions (where the air
during spring, before returning to higher temperatures
temperature increases with elevation) are common.
than the mean air temperature in summer. Diurnal
Table 17. Monthly and annual mean 9 a.m. earth temperatures (°C) at varying depths from the ground surface for selected
Canterbury locations.
Location Jan Feb Mar Apr May Jun Jul Aug Sep Oct Nov Dec Ann
Christchurch 10 cm 17.4 16.7 14.3 10.8 7.3 4.5 3.8 4.8 7.3 10.5 13.7 16.2 10.6
20 cm 18.5 18.1 15.6 12.2 8.4 5.4 4.6 5.7 8.1 11.2 14.5 16.9 11.6
30 cm 19.2 18.9 16.6 13.3 9.5 6.3 5.4 6.5 8.9 12.0 15.1 17.6 12.5
100 cm 18.1 18.4 17.2 14.8 11.6 8.6 7.0 7.4 9.0 11.4 14.2 16.4 12.9
Rangiora 10 cm 17.3 16.5 14.0 11.2 7.8 5.0 4.3 5.7 8.3 10.7 13.9 16.3 10.8
20 cm 17.9 17.6 15.7 12.3 9.1 6.2 5.4 6.6 8.8 11.2 14.4 16.7 11.9
50 cm 17.9 17.8 16.3 13.9 11.1 8.3 6.9 7.7 9.6 11.7 14.5 16.5 12.6
100 cm 17.2 17.7 16.8 15.1 12.9 10.5 8.9 9.0 10.2 11.8 14.0 15.7 13.3
Tara Hills (Omarama) 10 cm 16.7 15.9 13.0 8.5 4.2 1.4 0.5 2.1 5.1 8.8 12.6 15.5 8.7
20 cm 17.8 17.6 14.6 10.1 5.6 2.4 1.3 2.9 5.9 9.4 13.2 16.2 9.7
30 cm 18.5 18.2 15.5 11.0 6.3 2.9 1.8 3.3 6.3 10.1 13.8 16.6 10.4
50 cm 18.1 18.5 15.3 11.6 7.7 5.0 3.1 4.2 7.0 9.8 13.2 16.2 11.1
100 cm 17.0 17.8 16.0 13.0 9.3 5.8 3.7 4.4 6.8 9.4 12.6 15.3 11.1
27There are two types of frost recorded. Air frosts occur Hoar frost is another form of frost which occurs
when air temperature measured by a thermometer infrequently, and its occurrence in Canterbury is
in a screen 1.3 m above the ground falls below 0°C. typically limited to the inland basins. Hoar frost occurs
Ground frosts are recorded when the air temperature when water vapour in the air contacts features at the
2.5 cm above a closely cut grass surface falls to Earth’s surface (e.g. tree leaves, branches, fences)
-1.0°C or lower. Both types of frost are common in that are below 0°C. The water vapour condenses and
Canterbury in the cooler months. Table 18 lists for freezes upon contact, enabling ice crystals (frost) to
selected locations the mean daily grass minimum form on the individual features, making for a scenic
and extreme grass minimum temperatures, and the phenomenon.
average number of days each month with ground and
air frosts. Ground frosts occur more frequently than
air frosts, and air frosts occur most frequently at the
inland location of Lake Tekapo.
20
18
16
Temperature (°C)
14
12
10
8
6
4
2
0
Jan Feb Mar Apr May Jun Jul Aug Sep Oct Nov Dec
Month
10 cm 100 cm Air temp
Figure 15. Monthly mean 9 a.m. earth temperature at different depths from the ground
surface, and monthly mean air temperature, from all available data at Christchurch.
Table 18. Frost occurrence and grass minimum temperatures at selected Canterbury locations from all available data.
Location Jan Feb Mar Apr May Jun Jul Aug Sep Oct Nov Dec
Christchurch a 9.1 9.0 7.1 4.1 1.2 -1.2 -1.5 -0.8 1.1 3.2 5.2 7.8
b -4.9 -3.0 -6.2 -11.3 -11.5 -14.9 -12.1 -12.9 -11.7 -9.0 -6.9 -6.3
c 0.1 0.2 1 4 11 18 19 17 10 5 2 0.4
d 0 0 0.01 0.5 3 9 11 7 2 0.3 0.1 0
Darfield a 8.3 8.3 6.4 3.3 0.5 -2.0 -2.6 -1.6 0.3 2.6 4.5 7.1
b -0.8 -1.6 -4.2 -5.8 -8.9 -9.7 -14.1 -10.7 -8.6 -9.1 -6.7 -3.0
c 0 0.1 0.8 5 13 20 22 19 13 7 3 0.3
d 0 0.01 0.03 0.7 4 10 13 9 4 1 0.3 0
Lake Tekapo a 5.0 4.7 2.7 -0.1 -2.7 -5.1 -6.0 -4.5 -2.0 0.1 2.0 4.0
b -10.7 -9.5 -11.7 -12.5 -14.4 -21.1 -20.6 -21.6 -14.9 -15.3 -11.1 -8.8
c 3 3 7 13 21 25 27 25 18 12 8 4
d 0.2 0.2 0.9 4 12 21 24 20 10 5 2 0.5
a: Mean daily grass minimum (°C)
b: Lowest grass minimum recorded (°C)
c: Mean number of ground frosts per month
d: Mean number of air frosts per month
28Sunshine and Solar Radiation
Sunshine
Sunshine hours are highest in the inland
basins of Canterbury, which typically
receive between 2,100 and 2,300 hours
of sunshine annually (Figure 16). Lake
Tekapo is frequently one of the top-5
sunniest locations in New Zealand on
an annual basis. The remainder of the
Canterbury region receives moderate
annual sunshine hours compared to
the rest of New Zealand. The notable
exception is high elevation mountainous
areas, where increased cloudiness
reduces the annual sunshine totals
experienced. Figure 17 shows the
monthly mean, maximum, and minimum
recorded bright sunshine hours for
selected locations in Canterbury. Note
that the lower sunshine hours recorded
in the winter months tends to reflect
the northerly declination of the sun, as
opposed to signalling an increase in
cloudiness during those times.
Figure 16. Median annual sunshine hours for Canterbury, 1981–2010.
Christchurch Hanmer Springs
Bright Sunshine (hours)
Bright Sunshine (hours)
300
300
200
200
100
100
0
0
J F M A M J J A S O N D J F M A M J J A S O N D
Lake Tekapo
Highest Recorded
Bright Sunshine (hours)
300
200
Mean
100
Lowest Recorded
0
J F M A M J J A S O N D
Figure 17. Mean, highest and lowest recorded monthly bright sunshine hours for
selected locations in Canterbury from all available data.
29Solar radiation
Solar radiation observations of greater
than 10 years are available for only a few
sites in Canterbury. Table 19 presents the
mean daily global (i.e. direct and diffuse)
solar radiation for Christchurch, Hanmer
Springs and Lake Tekapo. Insolation is
highest in December in Christchurch and
Hanmer Springs, but peaks in January at
Lake Tekapo. Insolation is at a minimum
in June at all locations.
Table 19. Mean daily global solar radiation (MJ/m2/day) for selected Canterbury locations from all available data.
Location Jan Feb Mar Apr May Jun Jul Aug Sep Oct Nov Dec Ann
Christchurch 21.9 18.8 14.1 9.7 6.2 4.7 5.3 8.0 12.3 17.3 21.2 22.3 13.5
Hanmer Springs 21.7 19.1 15.0 9.9 6.6 5.0 5.9 8.4 12.8 17.1 21.0 21.9 13.7
Lake Tekapo 24.9 21.5 16.4 11.1 6.8 5.7 6.3 9.4 13.9 18.7 24.0 24.5 15.3
UV (ultra-violet) radiation
Christchurch Leigh (Auckland)
The mean daily ultra violet radiation
14.0
(UV) index recorded at Christchurch is
compared to that recorded at Leigh (a 12.0
site north of Auckland) in Figure 18. 10.0
Christchurch records lower UV levels
UV Index
8.0
than Leigh throughout the year due to its 6.0
relatively southern location. Both sites 4.0
record significantly higher UV levels in
2.0
summer than in winter, with maximum UV
0.0
levels recorded in January and minimum Jan Feb Mar Apr May Jun Jul Aug Sep Oct Nov Dec
UV levels recorded in June. Figure 19 Month
shows an example of a UV forecast for
Christchurch, indicating the UV levels and Figure 18. Mean daily maximum UV index for each month at Christchurch
and Leigh.
times of the day when sun protection is
required.
Figure 19. UV Index forecast for Christchurch, January and July. Source: https://www.niwa.co.nz/our-services/
online-services/uv-and-ozone.
30Other elements
Snow
Snowfalls occur quite frequently in Canterbury relative Table 20. Average number of days each year with snow, thunder,
to other parts of New Zealand. Table 20 shows the hail and fog recorded at selected Canterbury locations, from all
available data. The elevation of each station above mean sea
average number of days each year that snowfall level is also shown.
occurs at selected Canterbury locations. Snow doesn’t
Location Snow Thunder Fog Hail
tend to settle for longer than a day or two at a time,
Christchurch Airport (37 m) 3 3 6 49
except after particularly heavy snowfall events or in
Darfield (195 m) 4 3 2 14
higher elevation inland locations. The exception is
Kaikoura (108 m) 2 4 6 26
Canterbury’s extensive mountainous terrain, where
Lake Tekapo (762 m) 12 2 0.3 9
seasonal snowfields typically begin to accumulate in
Mount Cook Village (765 m) 24 9 2 12
late autumn, and persist through to early summer. Tara Hills, Omarama (488 m) 11 6 2 22
Heavy and frequent snowfalls occur in the western- Timaru Airport (25 m) 1 2 2 18
most mountains of Canterbury which contributes to
the perennial snow and glaciers at high elevations in
those areas. A single winter storm cycle can deposit
2 - 3 m of snow in the Fiordland mountains farther
south (Conway et al., 2000), and it is likely that similar
totals would be recorded along and near the main
divide in Canterbury. The alpine passes over Porters
Pass, Arthur’s Pass and Lewis Pass are often subject
to snowfall in winter, requiring the use of chains by
motorists and forcing closure of those roads from
time to time. Snow has an important role to play for
the economy of the Canterbury region. Commercial
skifields and heli-ski companies operate throughout
the region, attracting thousands of visitors each winter.
In June 2006 a significant snow event struck
throughout Canterbury. The snowstorm was a result
of a rapidly deepening depression moving south-
eastward from the Tasman Sea across New Zealand,
with a strong moist north-westerly flow preceding it
and a very cold southerly airflow behind. Notably, the
depression’s central pressure fell by 20 hPa in the
24-hours between midnight 10 June and midnight 11
June. Snow fell in Canterbury overnight on 11 June and
lay for about two weeks across the plains. The weight
of snow and ice destroyed more than 500 power poles
around the region, cutting power to 35,000 homes
and businesses. On 21 June, 800 mid- and south-
Canterbury homes went into their 10th day without
power. Between 30 and 60 cm of snow accumulated
over much of the plains, with approximately 40 cm
recorded in Ashburton, 30 cm in Timaru and 15 cm in
Christchurch. The insurance cost of the June snow in
the South Island was $43.91 million (in 2006 dollars),
making it the third-most expensive single weather
event in New Zealand at that time.
31You can also read