Capital expenditure by the public sector for 2017 - Statistician-General: Mr Risenga Maluleke 20 August 2018 - Statistics ...
←
→
Page content transcription
If your browser does not render page correctly, please read the page content below
Capital expenditure by the public sector for 2017
     Statistician-General: Mr Risenga Maluleke
    20 August 2018

                                                          @StatsSA

Image: www.mediaclubsouthafrica.com/   Hannelie Coetzee
Contents

 1. Background

 2. Key findings

 3. Conclusion
Background
                       Reporting units for public-sector capex (2016 & 2017)!

                                                    2016: 772       2017: 751

                Public Corporations                       47           46
                Provincial Government                   123           123
                Municipalities                           278          257
                National Government                       47            47
                Higher Education Institutions             26            26
                Extra-Budgetary Accounts                 251           252

!Public  sector classification committee
!Not   adjusted for the different financial years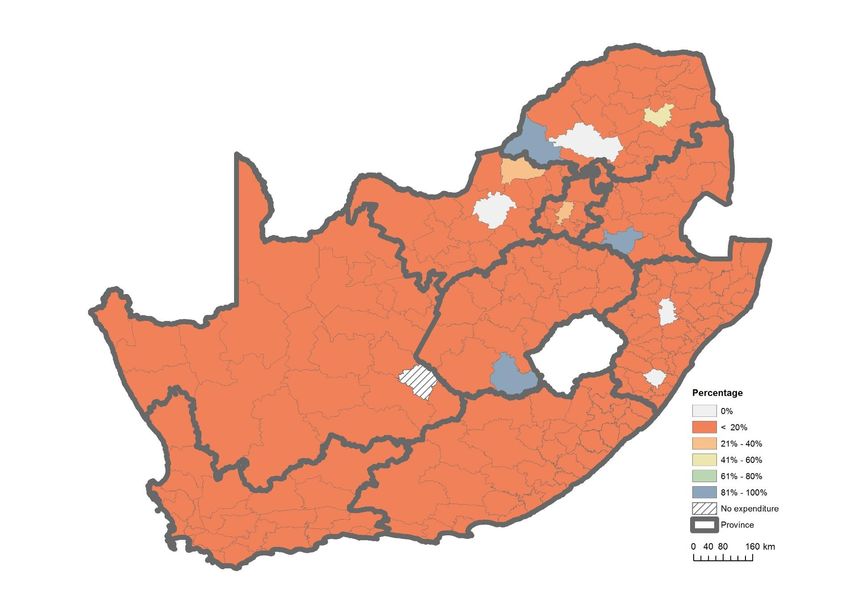
Background
  Capital expenditure is:
   “any expenditure incurred in or incidental to the acquisition or improvement of
  land, buildings, engineering structures and machinery and equipment”.

  The expenditure normally confers a lasting benefit and results in the
  acquisition of, or extends the life period of, a fixed asset.

 Capital expenditure does not:
  •   Measure or monitor specific projects of specific entities. It only reports on
      capex spend (by type) during their financial year.
  •   Verify the existence of the fixed assets purchased or constructed.
  •   Indicate timeframes for structures completed or to be completed.
  •   Reconcile different year-ends of the reporting units.
  •   Compare capex spent across different reporting units.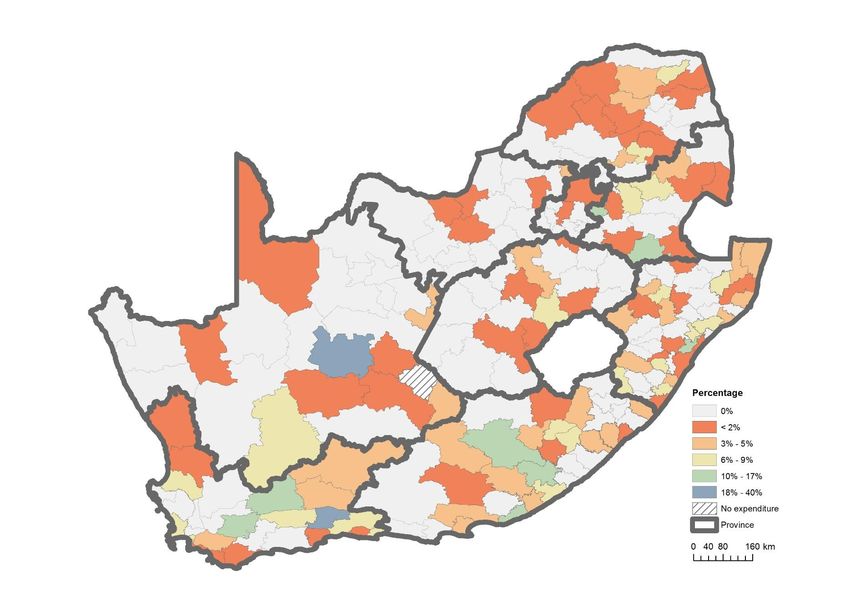
Background

Type of capital expenditure

  •   New construction works;
  •   Plant, machinery and equipment;
  •   Transport equipment;
  •   Land and existing buildings;
  •   Other fixed assets; and
  •   Leased assets and investment property.
                                •
                              • work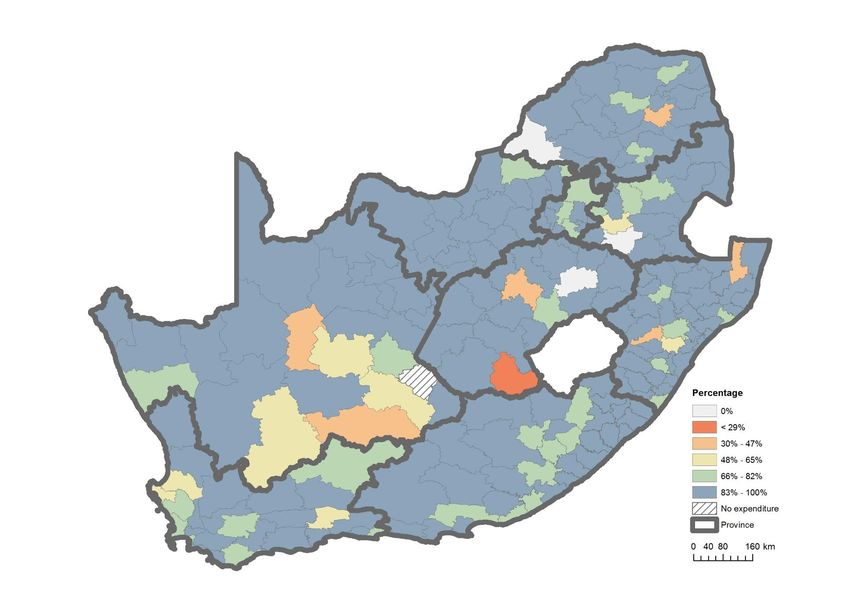
Key
findings
Contribution to total capex by institution (R billion)*

350                                                                                           283                           300
                                                                                                               271
                                                                        259    265
300
                                                                                                                            250
                                                              225                               7
                                                                                6                               7
250                                             203                      6
      182                           183                                                                                     200
                        178                                    5
200                                              5                                            139
                                                                                                               135
                                                                        144    142
       4                 5            6                                                                                     150
150                                                           124
                                                112
      89                82           91
                                                                                                                            100
100                                                                                            64              63
                                                                        52      57
      43                41           35                       43
                                                40                                             18                           50
                                                                                13                             17
 50                                                           10        13
       14            17              18          7                                             36
                                                              29        30      31                             34
       22            24              22         27
       10             9              11         12            14        14      16             18              16
  0                                                                                                                         0
      2009          2010            2011        2012         2013       2014   2015          2016*             2017

       National Government                      Provincial Government          Extra-Budgetary Accounts and Funds
       Municipalities                           Public Corporations            Higher Education Institutions
       Total capital expenditure (Right axis)

                                                                                                                    * Rounded off*
Total capex by asset (R billion)

                                  250

                                  200

                                  150

                                  100

                                   50

                                     0
                                           2013   2014   2015   2016*   2017
   New construction works                  122    131    174     194    188
   Plant, machinery and equipment           67     95     62     55      46
   Land and existing buildings              19     15     14     16      17
   Other fixed assets                        8      6      6      7      10
   Transport equipment                       8      9      6      8       6
   Leased assets and investment property     1      2      2      4       4
Total capex by type of asset (R billion)
                                       2016
                                       2017
Plant, Machinery & Equipment              Transport Equipment

                                16%                                 18%
                               R55,0                               R7,8

                               R46,1                               R6,4

Land & Existing Buildings                 New Construction Works

                                 7%                                  3%

                               R15,8                               R193,7

                               R16,8                               R188,3
Examples of capex by public sector
institutions in 2017Public corporations
Public corporations (R billion)

             150

             145
                           144
                                  142
             140
                                         139

                                                135
             135
 R billion

             130

                   124
             125

             120

             115

             110
                    2013   2014   2015   2016   2017
Major contributions: public corporations, 2017 (R billion)
6,1
PASSENGER RAIL AGENCY OF SOUTH AFRICA
5,4
5,8
TELKOM SOUTH AFRICA LIMITED
8,2
2016
8,5
SOUTH AFRICAN NATIONAL ROADS AGENCY 2017
9,3
33,6
TRANSNET LIMITED
25,4
73,0
ESKOM
75,7
0 20 40 60 80Major contributions by public corporations, 2017
Eskom
Eskom remains the main
contributor to the total
capital expenditure (R75,7
billion) during the 2016/17
financial year, which was
spent mainly on the power
generation projects at
Kusile and nationwide on
new electricity distribution
programmes.Major contributions by public corporations, 2017
South African National Roads Agency
The South African
National Roads Agency
capital expenditure
increased to R9,3 billion
in 2017 from R8,5 billion
in 2016.
Its capital works on
roads (such as Moloto
road), amounted to
R6,3 billion.Major contributions by public corporations, 2017
Transnet Limited
Transnet spent R1,9
billion on purchases of
new wagons for freight
rail and R22,5 billion on
various equipment for
various operating
divisions across the
country.Major contributions by public corporations, 2017
Telkom SA Ltd
About R8,2 billion invested
mainly in submarine cable
systems, network evolution
initiatives, sustainment
programme, freehold
buildings, network, support
equipment, IT and operating
software systems and the
new next generation network
programme.Municipalities
Municipal expenditure in 2017 (R billion) : Capex vs Opex

                                     Expenditure
                                    (Total = R394)

   Capital Expenditure (Capex)                       Operational Expenditure (Opex)
              {63}                                                {331}

  Metros     Locals                                  Metros      Locals     Districts
                        Districts

   33          22                                     187         123          21
                            8
Capex: municipalities
Local and metropolitan municipalities
Thulamela LM
New construction works, 2017 (R122m or 67% of
!Kheis LM total capex)
(R3m or 39% of total Construction of
capex) access road from
Upgrading of Giyani to
existing water Tshianzwane,
network in Cillie construction of
ward 5, Lutzburg Thohoyandou J
ward 7. extension 1 landfill
site, road storm water
bridges and street
lights
Oudtshoorn LM
(R31m or 62% of eThekwini MM
total capex) (R4 891m or 84%
Bulk electrical supply of total capex)
to Rose Valley and New construction
surrounding areas works such as
(phase 2) and high rehabilitation of
mast flood Shallcross Road,
installations in Langerberg Road,
Oudtshoorn, Escom Road and
Dysselsdorp and construction of the
Blomnek at Da Rust Integrated Rapid
Public Transport
Network.Capex: municipalities
District municipalities Gert Sibande DM
New construction works, 2017 (R2m or 25% of total
capex)
Construction of a
disaster centre in Pixley
ka Seme LM.
UThukela DM
(R596m or 100%
of total capex)
New construction
works such as
Amathole DM construction of
(R140m or 74% of total access road,
capex) municipal
Acquisition of tools utilised buildings,
for the maintenance of the Lombardskop bulk
water and sewer networks water feeder
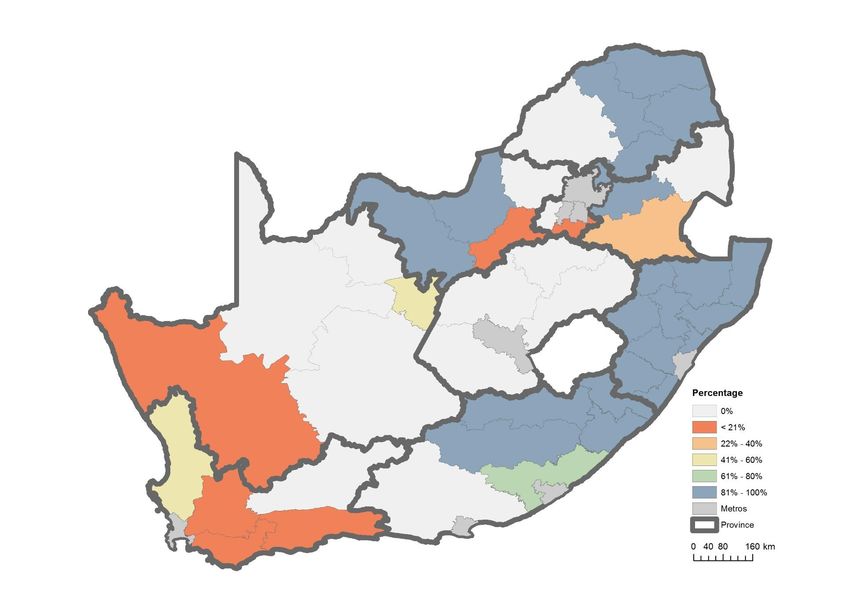
mainsCapex: municipalities
Local and metropolitan municipalities Jozini LM
(R32m or 53% of
Land and existing buildings, 2017 total capex)
City of Matlosana Renovation and
LM extension of the
(R20m or 12% of municipal offices.
total capex)
Upgrading of
various sidewalks;
landscaping of
Jabulani Street.
Nyandeni LM
(R5m or 7% of total
capex)
Expansion of existing
municipality officesCapex: municipalities
Local and metropolitan municipalities City of
Transport equipment, 2017 Johannesburg MM
Siyathemba LM (R173m or 2% of
City of Cape Town MM (R3m or 40% of total total capex)
(R427m or 7% of total capex) Purchased vehicles
capex) Procurement of motor for different
Purchases of various vehicles and other departments for
types of vehicles specialised vehicles to service delivery and
(watercraft, increased increase service delivery. acquisition of BRT
high- occupancy vehicles and
vehicles, more park-and- emergency service
ride facilities at rail, bus vehicles.
stations, mechanical
street-sweeping vehicles
and fire-rescue service). Enoch Mgijima
LM
(R10m or 14%
of total capex)
Purchased new
motor vehicles in
order to enhance
service delivery
throughout the
municipal area.Capex: municipalities
Local and metropolitan municipalities Greater Tzaneen LM
(R64m or 49% of total
Plant, machinery & equipment, 2017 capex)
City of Johannesburg MM Procurement of office
(R1 881m or 24% of total furniture, computer and
other equipment for
capex) administrative staff.
City of Cape Town MM Driefontein wastewater treatment
(R935m or 15% of total works.
capex) Purchases and replacement of
Purchases of more park-and- laptops and desktops and office Lekwa LM
ride facilities at rail and bus equipment for all regional offices. (R40m or
stations under construction,
computers, tables, phones
100% of total
and laptops, computers for capex)
libraries, expansion of CCTV Expenditure was
cameras on the areas of on printers,
Kewton, Gatesville, computers,
Goodwood and Parow and cameras, vacuum
furniture for additional staff. cleaners and
scanners for the
office, workshop
equipment and
medical
equipment.Provincial government
Examples of provincial government capex, 2017 (R billion)
Total 2016: 36,4
-6,0%
Total 2017: 34,2 Gauteng Department of
Gauteng Education had a capital
Limpopo expenditure of R2,5 billion
6,1 and spent R2,4 billion on
2,1 primary, secondary and
5,9
1,9 specialised schools, grade
R infrastructure, etc.
Mpumalanga
North West 3,6
3,2 2,9
2,3
Western Cape KwaZulu-Natal Transport
Transport and Public incurred R3,5 billion of its
Works Free State
R2,6 billion was on
Kwazulu-Natal on road upgrades in Ulundi,
Umzumbe, new gravel at
2,5
provincial roads and Northern Cape 8,7 Maphumulo and Abaqulisi.
streets in order to 2,3 Various other spend on
preserve and upgrade 1,4 7,9 new and pedestrian bridges,
conditions of the patching and repairs in
1,3
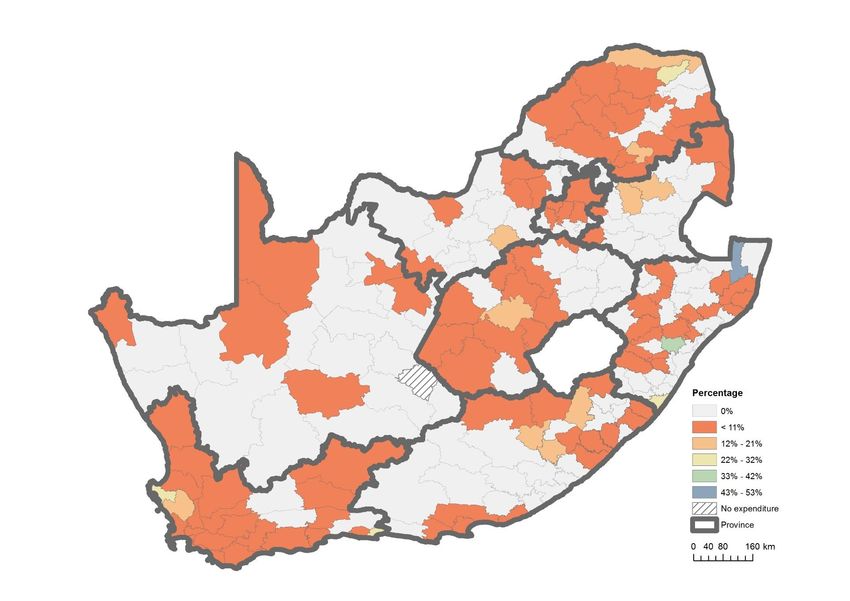
Municipalities capex per province
Summary Tables_Capex 2017
provincial road network. Province
Umvoti, as well as
Amount_Revised
Total capital expenditure
Eastern Cape
3 868 724
4 774 956
Free State
2 480 834
2 300 485
Gauteng
6 127 295
5 891 675
Kwazulu-Natal
8 651 370
7 914 267
Limpopo
2 100 826
1 884 028
Mpumalanga
3 585 196
2 926 216
North West
3 184 863
2 307 009
Northern Cape
1 385 151
1 332 583
Western Cape
5 045 663
4 916 697
rehabilitation of various
Eastern Cape Free State Gauteng Kwazulu-Natal Limpopo Mpumalanga North West Northern Cape Western Cape roads in ILembe, eThekwini,
2016 3,9 2,5 6,1 8,7 2,1 3,6 3,2 1,4 5,0
UMgungundlovu, Uthukela,
2017 4,8 2,3 5,9 7,9 1,9 2,9
Eastern Cape
2,3 1,3 4,9
etc.
3,9
Western Cape 4,8
5,0
4,9Examples of provincial government capex, 2017 (R billion)
Departments Reasons
R billion
Western Cape: Transport and Public
Works 2,9 Construction of provincial roads
and streets.
Construction of various primary,
secondary and specialised
Gauteng: Education 2,5
schools for grade R, etc.Examples of provincial government capex, 2017 (R billion)
Departments R billion Reasons
Built 263 classrooms and 43
specialist classrooms in public
Kwazulu-Natal: Education 2,2 ordinary schools for primary,
secondary, specialised and
grade R schools.
Specialised schools, extension of
Eastern Cape: Basic Education 1,8 old secondary schools, new
primary schools etc. in Engcobo,
Elundini and Buffalo City etc.
Construction of district, regional,
Gauteng: Health 1,6 central and tertiary hospitals
throughout the province.Extra-budgetary accounts and funds
Examples of EBA capex, 2017 (R billion)
Departments R billion Reasons
Major renovations and alterations in harbours
for the Small Harbours and Coastline
Property Management Trading Entity 4,7
Development programme
Water Trading Entity Bulk water project in Mopani DM
3,2
Computer equipment and computer software
to ensure that it remained current to OEM
South African Revenue Service 1,2 supported versionsExamples of EBA capex, 2017 (R billion)
Departments R billion Reasons
Upgrading, rehabilitation and resealing
Road Agency Limpopo of roads; building of 2 road bridges.
1,2
Acquisition of land and agricultural
Agriculture Land Holding Account 0,7 equipment.
Acquisition of land for astronomy
reserve for SKA project, and
National Research Foundation construction of buildings for research
0,6
purposes.National government
Examples of national government capex, 2017 (R billion)
Departments Amount Reasons
Rehabilitation of conveyance systems
Water Affairs 5,0 and 31 Municipal Water Infrastructure
programmes.
Purchases of motor vehicles and
South African Police Service construction of driver testing centres,
2,8
police stations and laboratories.
Construction of new buildings and
Justice and Constitutional improvements to the head office in
1,4
Development GautengExamples of national government capex, 2017 (R billion)
Departments Amount Reasons
New construction and rehabilitation of
Basic Education 1,1 schools
Construction of new buildings,
purchased motor vehicles and audio
National Department of Defence visual, gardening, laundry equipment,
0,9
etc.
Procurement of capital assets to
defray excess expenditure on goods
Correctional Services 0,9 and services and rehabilitation of
prisons nationally.Higher education institutions
Examples of higher education capex, 2017 (R million)
Stellenbosch 1 050 Expenditure was on non-residential buildings (offices
University
and lecture rooms) in the university campus.
University of 738 New construction works in the university campus, new
Pretoria
& replacement of computers, laboratory equipment
and vehicles.
University of
Venda 615 Work-in-progress of student residential buildings and
construction of office blocks.Examples of higher education capex, 2017 (R million)
University of 4 new buildings completed as part of phase 2 for the
518
Mpumalanga 2017 academic year
Non-residential buildings particularly the teaching
University of 487
Witwatersrand
venues and research laboratories, IT and field work
research vehicles.
University of 2 new buildings were constructed for the 2017
the Western 479
Cape academic year.
Capex on existing sport and recreation amenitiesCapex on higher education institutions, 2017 (R million)
Conclusion
Conclusion

• Capex by public sector institutions for the last 5 years exceeded R1,3 trillion

• This is the first year-on-year capex decrease, since 2009_2010

• By Type: New construction was the largest component of public-sector capex

• By institution: Public corporations was the largest spenders

• Significant amounts were spent on service-delivery orientated aspects

• Unit data is available on the website (or on request)
Conclusion

                             Thank you

 Technical Queries:

     Dr. Patrick Naidoo (patrickn@statssa.gov.za)
     Cell: 082 888 2509 Office: 012 310 8307

     Mr. Malibongwe Mhemhe (malibongwem@statssa.gov.za)
     Cell: 082 906 8964 Office: 012 310 6928)
You can also read