Capital Region Local Government Electric Vehicle (EV) + Electric Bike (E-Bike) Infrastructure Backgrounder
←
→
Page content transcription
If your browser does not render page correctly, please read the page content below
APPENDIX A

                        CAPITAL REGION EV + E-BIKE INFRASTRUCTURE PLANNING
                                                      BEST PRACTICES GUIDE
Capital Region
Local Government Electric Vehicle (EV) + Electric Bike (E-Bike)
Infrastructure Backgrounder

Prepared by: WATT Consulting Group

Prepared for: Capital Regional District

September 2018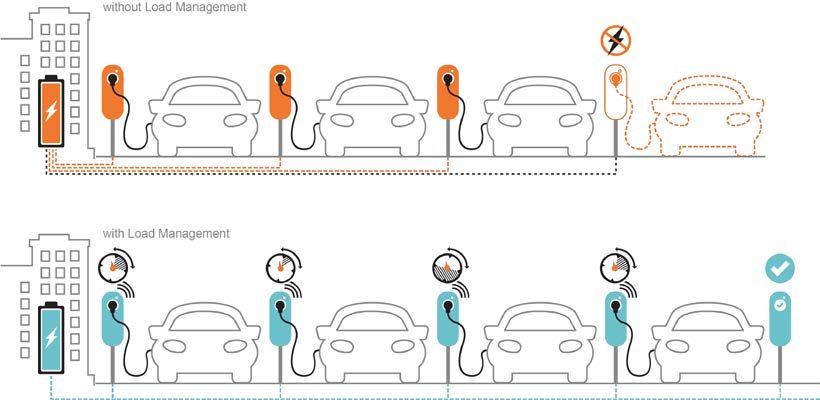
Capital Region Local Government EV + E-Bike Infrastructure Backgrounder

Contents
1. Overview............................................................................................................................................ 1
2. Electric Vehicles + Electric Bikes 101 ................................................................................................ 2
   2.1 Electric Vehicles .......................................................................................................................................... 2

   2.2 EV Charging Station Types ......................................................................................................................... 4

   2.3 Load Management & Load Sharing........................................................................................................... 6

   2.4 EV-Readiness & Retrofits............................................................................................................................ 8

   2.5 E-Bikes ........................................................................................................................................................ 8

3.0 EV + E-Bike Trends ......................................................................................................................... 10
   3.1 Electric Vehicles in BC .............................................................................................................................. 10

   3.2 Electric Vehicles in the Capital Region .................................................................................................... 13

   3.2 E-Bikes in the Capital Region Today........................................................................................................ 15

4. Plan + Policy Review ....................................................................................................................... 16
   4.1 Official Community Plans in the Capital Region ..................................................................................... 16

   4.2 EV Specific Regulations in the Capital Region ........................................................................................ 19

   4.3 EV & E-Bike Specific Regulations in Other Parts of British Columbia .................................................... 20

   4.4 Regulatory Aspects of Selling Electricity for EV Charging ...................................................................... 21

5.0 Public EV Charging Additional Considerations ............................................................................... 23
   5.1 Public Charging Station Networks ........................................................................................................... 23

   5.2 Paying a Fee for Public Charging Station Use ........................................................................................ 25

6.0 Barriers to EV & E-Bike Adoption ................................................................................................... 27
   6.1 Electric Vehicles ........................................................................................................................................ 27

   6.2 E-Bikes ...................................................................................................................................................... 31

   6.3 Summary of Barriers to EV & E-Bike Adoption ....................................................................................... 33

7.0 Infrastructure Gap Analysis ............................................................................................................. 34
   7.1 Purpose of a Public Charging Station Network ...................................................................................... 34

   7.2 Methodology ............................................................................................................................................ 35

   7.3 Results....................................................................................................................................................... 39

8.0 Public + Development Industry Engagement ................................................................................. 40
   8.1 Public Survey ............................................................................................................................................. 40
Capital Region Local Government EV + E-Bike Infrastructure Backgrounder

   8.2 Development / Building Industry Survey ................................................................................................ 49

   8.3 Development Industry Meeting ............................................................................................................... 54

References ............................................................................................................................................ 56

Appendix A. Summary of EV Regulations in Metro Vancouver Communities
Appendix B. Infrastructure Gap Analysis Mapping Outputs
Appendix C. Public Survey Results
Appendix D. Developer/Building Industry Survey Results
Capital Region Local Government EV + E-Bike Infrastructure Backgrounder

1. Overview
Working with and on behalf of local governments, the Capital Regional District (CRD) is undertaking
the Electric Vehicle (EV) and Electric Bicycle (E-Bike) Infrastructure Planning Project to understand
and assess opportunities to advance EV and E-Bike charging infrastructure in public and private
locations throughout the region. EV and E-Bike technology is rapidly advancing and this project is
focused on the current landscape. The key objectives of this project are to:

    •   Understand opportunities for local governments to accelerate uptake of EVs and E-bikes;

    •   Collect feedback from the development community and general public to better
        understand the barriers and opportunities for EV and E-bike charging;

    •   Draw on resources and lessons learned from other communities;

    •   Identify priority locations for new EV charging stations in the Capital Region; and

    •   Create a best practices guide outlining options for local governments on how to advance
        EV and E-bike charging infrastructure in the region.

The Backgrounder (this document) is the foundational document for the EV + E-Bike Infrastructure
Planning Project. It contains all baseline information that has been collected and analyzed in
developing an understanding of issues and opportunities for EV and E-Bike infrastructure in the
Capital Region. It is a companion document to the Capital Region Local Government EV + E-Bike
Infrastructure Planning Guide, containing the necessary detailed baseline information and allowing
the Infrastructure Planning Guide to be succinct and focused on providing direction and strategies.

Specifically, this document contains the following information:

    •   An overview of existing EVs and E-bikes, charging station technology, trends in EVs and E-
        bike ownership in the Capital Region and elsewhere, and key barriers to uptake;

    •   A summary of relevant community plans and policies from the Capital Region that support
        EV and E-bikes and the deployment of charging infrastructure;

    •   A synthesis of “lessons learned” from research and interviews with leading municipalities;

    •   An overview of the approach and results from a mapping exercise undertaken to identify
        gaps in the existing EV charge station network in the Capital Region; and

    •   A summary of findings from surveys and working sessions held to gather input and learn
        from the development industry and the general public.

                                                                                                        |1
Capital Region Local Government EV + E-Bike Infrastructure Backgrounder
2. Electric Vehicles + Electric Bikes 101
2.1 Electric Vehicles
Electric vehicles are a class of vehicles that run fully or partially on electricity. They have a battery
instead of a gasoline tank, and an electric motor instead of an internal combustion engine. There
are five distinct types of electric vehicles: Battery Electric Vehicles (BEVs), Plug-In Hybrid Electric
Vehicles (PHEVs), Conventional Hybrids, Fuel Cell Vehicles (FCVs), and Extended Range Electric
Vehicles (EREVs). Table 1 presents an overview of the existing EVs available in British Columbia.
While conventional hybrid vehicles, FCVs, and EREVs are featured below, they are not discussed
elsewhere in this Backgrounder. The focus of this Backgrounder is on BEVs and PHEVs exclusively.
BEVs run exclusively on electricity and need to be plugged into an outlet or charging station to
recharge the battery. The typical range (kilometers) varies from 100 kilometres to over 400
kilometers. Examples of BEVs include the Nissan Leaf, Ford Focus Electric and the Tesla Model S.
PHEVs have an electric motor and an internal combustion engine – the electric motor also
needs to be charged at an outlet or charging station but PHEVs typically have a smaller electric
range than BEVs and use the internal combustion engine once the battery dies. Examples of
PHEVs include the Chevrolet Volt, Kia Optima and Mitsubishi Outlander.
Conventional Hybrids are fueled with gasoline only, but are able to recapture some kinetic
energy from the braking system which is converted into electricity to charge the battery. The
battery helps to power the vehicle.
Fuel Cell Vehicles (FCVs) are a type of electric vehicle that use a fuel cell, instead of a battery.
Those cells generate electricity by using oxygen from the air and compressed hydrogen. Their
range and refueling processes are comparable to conventional cars. They produce only water
and heat as a by-product. Examples of FCVs include the Hyundai Nexo, Honda Clarity Fuel Cell,
and Toyota Mirai.
Extended Range Electric Vehicles (EREVs) have an electric motor and include an auxiliary
power unit, typically an internal combustion engine. The difference with the PHEVs is that the
electric motor is used constantly to move the vehicle, and the internal combustion engine is
used as a generator that recharges the battery when it dies.
|2Capital Region Local Government EV + E-Bike Infrastructure Backgrounder
Table 1. Electric Vehicles Available in British Columbia (as of May 2018 1)
Vehicle Range (km) MSRP
Type Vehicle Name
Electric Range Full Range (CAD$)
BMW i3 183 183-303 $56,000
Chevrolet Bolt 383 - $43,195
Ford Focus Electric 185 - $34,998
Hyundai IONIQ Electric 200 - $35,649
Kia Soul EV 179 - $35,895
BEV Nissan Leaf 242 - $35,998
Smart fortwo ED 155 - $28,800
Tesla Model S 338-539 - $96,650 – 191,900
Tesla Model X 322-475 - $110,200 – 200,200
Tesla Model 3 350 - $45,600
Volkswagen e-Golf 201 - $36,355
Chevrolet Volt 85 676 $38,995
Porsche Panamera S E Hybrid 26 897 $113,400
KIA Optima PHEV 47 982 $42,995
Chrysler Pacifica PHEV 53 911 $53,440
Cadillac CT6 PHEV 50 692 $86,770
Honda Clarity PHEV 77 552 $41,680
Hyundai Sonata 43 944 $43,999
Hyundai IONIQ PHEV 43 TBD $31,999
Toyota Prius Prime 40 1,035 $32,990
Mitsubishi Outlander 35 944 $42,998
Ford Fusion Energi 35 982 $33,588
Volvo S90 PHEV 34 655 $74,950
PHEV Volvo XC90 T8 27 547 $86,450
Volvo XC60 T8 27 537 $70,250
Audi A3 e-tron 26 605 $45,900
BMW 530e 25 572 $67,500
BMW i8 24 533 $152,715
BMW 740e 23 548 TBD
BMW 330e 23 556 $51,500
BMW X5 xDrive40e 23 886 $74,950
Porsche Cayenne S E Hybrid 23 791 $90,400
Mercedes-Benz S550e 23 725 $117,900
Mercedes-Benz GLC 350e 23 TBD $59,900
Mercedes-Benz GLE 550e 19 738 $83,900
Mini Cooper S E Countryman 19 439 $43,490
|3Capital Region Local Government EV + E-Bike Infrastructure Backgrounder
2.2 EV Charging Station Types
Charging stations are commonly referred to as electrical vehicle supply equipment (EVSE).
Generally there are three types of charging stations: Level 1, Level 2, Level 3.
Level 1 Level 2 Level 3
AC, 120V AC, 240V DC fast charging
Level 1 charging stations Level 2 charging stations Level 3 charging stations
utilize household outlets provide a higher amount provide the fastest
that provide 120V of AC of AC power to the charging option, although
power (120V) to the vehicle and require their installation costs are
Type vehicle. This type of own circuit (similar to significantly higher than
charging is cheapest and larger household other charging station
typically involves little to appliances). These are types. These stations
no infrastructure, but is the most common form appeal to EVs needing a
the slowest of the three of public charging station “top up” during longer
charging station types. and installation costs are distance trips that
significant less than Level approach or exceed
3 charging stations battery range.
Cost $500 $2,500 - $15,000+ $75,000+
(approx.) (retrofit) installation cost installation cost
3–8 km 18–45 km 90-150 km
per hour of charge time per hour of charge time per hour of charge time
Key Stats 8-12 hrs 4-6 hrs 0.5-1 hrs
for a full charge for a full charge for a full charge
Charging at home Charging at home or at Charging “on the go”,
Common
Uses (overnight) or at work work, or for charging “on commonly longer
(all day) the go” (parking lots) distance trips
An October 2017 white paper by the International Council on Clean Transportation Electric Vehicle
examined the status of charging infrastructure in major electric vehicle markets in North American,
Europe, and Asia.2 The white paper reported that the costs of installing EV charging infrastructure
|4Capital Region Local Government EV + E-Bike Infrastructure Backgrounder
has been declining over the past couple years. Based on a review of costs for EV charging stations,
typical costs for a Level 2 station, which include administrative, installation, and siting, range from
$6,500 to $20,000, whereas a Level 3 station varies from $50,000 to $130,000. 3 The variation in
costs for both charging station types is attributed to factors such as different networking
capabilities (e.g., number of connectors), geographical context (e.g., urban vs rural), and type of
station (e.g., mounted on the wall vs stand-alone). See Section 2.4 for ‘EV-Ready’ cost
considerations.
A number of local suppliers offer charging stations from a variety of manufacturers. Refer to Table
2 for a list of charging station manufacturers.
PlugIn BC maintains a full database of charging station manufacturers and local suppliers that may
be referenced for the most up-to-date list - https://pluginbc.ca/incentives/manuf_list
A Tesla Supercharger is a special Level 3 charger that can only be used to charge Tesla
vehicles. These stations are owned and operated as part of Tesla’s world-wide network. They
are typically sited to support the long-distance travel needs of Tesla vehicle owners, but are
increasingly being installed in cities to facilitate charging for Tesla owners living in multi-unit
buildings and others without access to home charging.
|5Capital Region Local Government EV + E-Bike Infrastructure Backgrounder
Table 2. EV Charging Station Manufacturers (as of September 2018 4)
Key Functions
Manufacturer
Load Management Data Tracking
AddEnergie/Flo Some units Yes
AeroVironment Some units No
BMW Some units Some units
Bosch No No
ChargePoint Some units Yes
EFACEC Yes Yes
Elmec & EVduty Some units Some units
EV Box Yes Yes
EVoCharge Yes Yes
Hubbell Some units Some units
JuiceBar Some units Some units
JuiceBox Some units Yes
Leviton Some units Some units
Liberty Plugins Yes Yes
PowerPost Yes Yes
SemaConnect Some units Yes
Siemens Some units Some units
Sun Country Highway Some units Some units
Thermolec Yes Yes
WattZilla No No
2.3 Load Management & Load Sharing
Load management and load sharing refer to control technologies that reduce peak power demand
and improve the overall utilization of EV charging systems. 5 The technologies help reduce electric
infrastructure costs and provide the capability to control the time of use, which can be utilized to
|6Capital Region Local Government EV + E-Bike Infrastructure Backgrounder
reduce the impact on the utility’s system. Both terms are used interchangeably for the general
public but are distinguished by electrical engineers for technical purposes.
In general, load management / sharing refers to a method where multiple EV charging stations
share the same electrical line. This is commonly used in cases where the electrical capacity is not
sufficient for all the required charging stations.6 The ability to distribute the available power of the
existing grid connection to all connected charge points is ideal not only for multiple charging
points, but in case there is a need for future expansion and increase in the number of EV charging
points.
In principle, this is a classic example of peak saving, which British Columbia has been doing over
the past several years. It is also known as Demand Side Management (DSM), which allows utilities
to reduce demand for electricity during peak usage times. New load management technologies
are constantly under development by both the public and private sector; examples of organizations
/ manufacturers that load management technology include BC Hydro, AddEnergie/Flo,
AeroVironment, ChargePoint, Leviton, and Siemens, among others.7 Figure 1 provides an
illustrative example of how load managements works in practice.
Figure 1. Illustrative Example of Load Management 8
|7Capital Region Local Government EV + E-Bike Infrastructure Backgrounder
2.4 EV-Readiness & Retrofits
EV-Ready, is considered a parking stall that is provided with conduit and an energized outlet
capable of providing power to an electric vehicle charging station. It is a measure used to future-
proofing a development to easily accommodate a future EV charging station.
The City of Richmond procured a costing study to better understand installation costs for various
architypes of new multi-unit buildings. Costs per charging unit depended on the EV charging
technology and ranged from $561 (Level 2, 4-way load shared ‘energized’) to $2,610 (Level 2,
dedicated ‘energized’). 9
Retrofit costs, especially in multi-unit buildings, are typically much greater (averaged $6,800 per
charging unit based on results from a previous provincial incentive program).10 Retrofits to an entire
building, requiring additional panel upgrades, retrofits to the electrical room and transformer
upgrades would significantly increase the average cost per station. Retrofits to an existing single-
family home are typically less onerous and less costly (if home has existing electrical capacity and
space).
2.5 E-Bikes
E-Bikes are electric bicycles with an electric motor of 500 watts or less and functioning pedals that
are limited to a top speed of 32 km/h without pedalling. 11 Electric bicycles in British Columbia
must comply with all standards outlined in the Motor Assisted Cycle Regulation, BC Reg. 151/2002.
In summary, to be considered an electric bicycle it must meet the following characteristics:
• Electric motor of up to 500 watts,
• Functional pedals,
• Maximum speed of 32 km/h when power assisted, and
• The power assist must disengage in any of the following: rider stops pedaling, throttle is
released, brake is applied.
If the above mentioned characteristics are met then there is no requirement for driver’s license,
vehicle registration, or insurance. However a bicycle helmet must be worn and the rider must be
at least 16 years old.
E-Bikes have a range of benefits beyond (or in addition to) those provided by a traditional, non-
motorized bicycle. E-Bikes make cycling possible for a much wider diversity of people as they can
|8Capital Region Local Government EV + E-Bike Infrastructure Backgrounder
increase the length of bicycle trips, minimize the impact of hills and other terrain challenges, and
allow people to bike with heavier cargo loads. This increase bicycle accessibility for women,
seniors, and people with disabilities. Research has shown that E-Bikes are ridden twice as far and
twice as often as traditional bicycles. Though E-Bikes offer riders some assistance, riders are still
required to pedal and therefore achieve similar health benefits to that of a traditional bicycle. 12
The amount of assistance the motor supplies depends on the size of the motor: smaller motors
work to only assist the rider’s pedaling and larger, more powerful, motors can propel the bike
forward without the rider needing to pedal. E-Bikes are classified according to their power, and
there are three distinct classes. There are three types of E-Bikes, broadly described as follows:
The pedal-assist, also known as pedelecs, enhances the efforts of the rider only when they
are pedaling. Two sub-categories exist in pedal-assist: the first provides assistance upon
detecting pedal strokes and the second provides assistance when a chosen level of torque is
reached. An example of a pedal-assist bike is the OPUS Grid.
The power-on-demand bikes only provide power on demand – this is initiated by the rider
using a throttle which is typically located on the handgrip.
The third class is a hybrid of the pedal-assistance and power-on-demand. There is both a
pedal-assist sensor and the option to engage the motor by utilizing the throttle on the
handgrip. Examples of hybrid bikes are the Spark, Juiced OceanCurrent and CrossCurrent S, and
the Interceptor Electric Cruise Bike.
Figure 2 provides an illustration of how pedal-assist differs from power-on-demand.
Figure 2. Pedal-assist (left) vs. Power-on-demand (right) 13
|9Capital Region Local Government EV + E-Bike Infrastructure Backgrounder
Table 3 presents an overview of E-Bike performance and costs. Broadly speaking, E-Bikes costs
typically range from as low as $1,300 to as much as $4,600 with range varying from 38 to 125
kilometres. However, prices have been reported to be even lower than $1,300; Stark Drive has
released a number new E-Bike models with prices as low as $399 for the Stark Drive City. It should
also be noted that almost any bicycle can be retrofitted into an E-Bike with the use of a conversion
kit (e.g., Hub motor, mid drive, all-in-one, friction drive) reducing the cost but without providing
the same user experience, degree of integration, and ride. The cost of a conversion kit is
approximately $150-$250.
Table 3. Summary of Select E-Bikes Available in Canada in 2018, Performance + Cost
Battery Top Speed
Name /
Type Range without Pedaling Cost (CAD$)
Model
(km) (km/h)
Pedal-Assisted / Stark Drive City 40 25 399
Power-on-demand
Spark 80 32 1,300
Juiced OceanCurrent (500W) 67-120 38 2,100
Juiced CrossCurrent S 54-108 45 2,300
Interceptor | Electric Cruise Bike - 32 3,800
- OHM-EbikeBC XU450 40-80 32 2,500
Pedal-Assisted OPUS Grid 38 32 2,500
Pedal-Assisted
with options Opus Connect 125 32 3,600
- Powerfly 5 Women’s - 32 4,600
3.0 EV + E-Bike Trends
3.1 Electric Vehicles in BC
The following is an overview of the latest EV sales data in British Columbia as a comparison to the
country as a whole.
BC’s Total EV Sales Compared to Canada
The EV market in BC, much like the rest of Canada, has been growing rapidly over the last 10
years. Data from fleetcarma, published in June 2018, indicate that electric vehicle sales increased
| 10Capital Region Local Government EV + E-Bike Infrastructure Backgrounder
by 75% in the first quarter of 2018 compared to the first quarter of 2017. 14 There was a total of
6,600 EVs sold in the first quarter of 2018 with 4,000 PHEVs and 2,600 BEVs.
Electric vehicle ownership in BC has continued to climb, especially in the last 5 years. BC saw
1,400 EVs sales for the first quarter, representing an increase of 58% over the previous year. Data
show that from 2013-2016, there were approximately 5,000 EVs sold in BC. In 2017 and in the first
quarter of 2018 alone, there were 4,670 EVs sold, which is almost equivalent to the number of
sales over a four year period (2013-2016). 15 Figure 3 shows EV growth across three of Canada’s
leading EV provinces. Notably, BC’s population as of 2018 is 4.8 million, which is significantly
smaller than both Quebec (8 million) and Ontario (14 million). Therefore, even though there were
more absolutely sales of EVs in Quebec and Ontario, BC saw more EV sales on a per capita basis.
Figure 3. Annual EV Sales, 2013-2017, by Province 16
8000 7477
7194
7000
6000
4987
5000
4000 3229 3400 3270
3000 2679
2049 2132
1736 1546
2000 1438
1092
567 769
1000
0
2013 2014 2015 2016 2017
British Columbia Quebec Ontario
BC’s EV Market Share Compared to Canada
EV market share—the portion of electric vehicles sold compared to the total automotive market—
has also been growing in the last 5 years. The percent of EV sales compared to passenger car sales
across the country is 5%, which is slightly higher from the all-time high of 4.6% in December
2017. 17 EV sales currently represent 1.4% of all vehicle sales in Canada, which is also higher than
the previous high of 1.3% in December 2017.
| 11Capital Region Local Government EV + E-Bike Infrastructure Backgrounder
In British Columbia, EV market share set a new high of 2.6% at the end of March 2018,
representing an increase from 1.7% in the three preceding months. As shown in Figure 4, BC has
seen the highest portion of EV market share growth in the last two years when compared to the
national average and Quebec and Ontario—the two largest EV markets. According to Statistics
Canada data, in the month of March 2018 there were 53,588 passenger cars sold nationally. British
Columbia and territories represented approximately 11% (6,069) of this total, compared to 29% in
Quebec, and 44% in Ontario.18
Figure 4. EV Market Share in BC (3 month average), January 2013 to January 2018 19
| 12Capital Region Local Government EV + E-Bike Infrastructure Backgrounder
Most Popular EVs in BC Compared to Canada
Similar to national trends, the Chevrolet Volt was one of the most popular PHEVs in BC in the first
quarter of 2018 with 133 sales. The Mitsubishi Outlander (one of the first widely-available sport-
utility vehicles) recorded the highest number of sales at 140. The Chevrolet Bolt was the most
popular BEV vehicle at the national scale, followed by the Nissan Leaf, at 581 and 505 sales,
respectively. In BC, the Tesla Model X was the most popular BEV with 197 sales compared to the
Bolt at 139 sales in the first quarter of 2018. Table 4 and Table 5 present the top three BEV and
PHEV vehicles sold in BC in the first quarter of 2018.
Table 4. Top BEV Sales in BC, Q1 2018
Vehicle Name Q1 2018 Sales Percent of All BEV Sales
Tesla Model X 197 29%
Chevrolet Bolt 139 20%
Nissan Leaf 98 14%
Table 5. Top PHEV Sales in BC, Q1 2018
Vehicle Name Q1 2018 Sales Percent of All PHEV Sales
Mitsubishi Outlander 140 21%
Chevrolet Volt 197 20%
Toyota Prius Prime 103 15%
3.2 Electric Vehicles in the Capital Region
In June 2018, the Capital Regional District released results from the 2017 CRD Origin Destination
Household Travel Survey.20 The survey study area includes all 13 municipalities in the CRD, the Juan
de Fuca Electoral Area and Salt Spring Island. In total, 7,392 households were surveyed, which
represents a sample rate of about 4.2% of all households in the study area.
In addition to the survey’s valuable data on the types of trips being made across the region, it also
includes demographic characteristics such as population by age, dwelling type occupational status
and vehicles by fuel type.
| 13Capital Region Local Government EV + E-Bike Infrastructure Backgrounder
The summary of vehicles by fuel type identified 255,300 vehicles in the Regional Planning Area
with, approximately 1,900 (0.7%) being “electric-only”. This represents an increase from the
2011 survey where only 100 electric-only vehicles were reported (less than 0.001%).
Unsurprisingly, single-detached households represented the largest number of dwelling types with
an electric vehicle (1,300), followed by apartment / condo (300), and row / townhouses (200).
Table 6 shows the percentage of electric-only vehicles by municipality / electoral area. The data
show electric vehicles represent 1% (or less) in almost all municipalities / electoral areas. The only
exceptions are North Saanich (2%) and the Salt Spring Island Electoral Area (4%). Nevertheless,
the survey does indicate that EV ownership has increased significantly since the 2011 survey.
Table 6. Percentage of Electric-only Vehicles, by Municipality
Percentage of
Municipality / Electoral Area Total Vehicles
Central SaanichCapital Region Local Government EV + E-Bike Infrastructure Backgrounder
3.2 E-Bikes in the Capital Region Today
With E-Bikes being an emerging mobility phenomenon, there is limited ownership data that is
publicly available. To gather an understanding of general E-Bike trends and sales, telephone
interviews were held with five bicycle shops in the Capital Region. The purpose of the interviews
was to [a] understand the types of E-Bikes available to customers [b] the price range of E-Bikes [c]
E-Bikes sales as a proportion of total bike sales and [d] whether the bicycle shops see a growing
market for them. Table 7 presents a summary of the findings.
Table 7. Summary of E-Bike Sales at Select Bicycle Shops in the Capital Region
E-Bike Sales as % of
Bicycle Shop Most Popular Models Price Range Total Bike Sales
Electra Townie Go!,
Fairfield Bicycle Shop $2,000-$6,000 33%
Surface 604
Fort Street Cycle Cannondale Quick $3,600-$8,000 1-2%
Devinci e-griffin, OPUS
Goldstream Bicycles $3,000 to $3,600 Unsure
WKND, Del Sol LXI
Opus Connect,
North Park Bikes $2,500-$5,000 5%
Electra Townie Go!
Cube Touring Hybrid One
Oak Bay Bicycles $2,800-$6,600 20%
500, Trek Verve Plus
All of the bicycle shops reported that there is a growing market for E-Bikes. Oak Bay Bicycles
reported that E-Bike sales are growing at a rate of 20% per year while Goldstream Bicycles stated
that the store has sold more E-Bikes in the first few months of 2018 than in the last two years
combined. Some of the bicycle shops indicated that sales could increase even further if the price of
E-Bikes decreases. Sales in the Capital Region generally follow the trend globally. Worldwide sales
of E-Bikes were estimated to be 36 million units in 2015 and 100 million by 2035, with the
majority of sales being in Asia. 21
In addition to the bike shops above, residents in the Capital Region also have the option of
shopping at Pedego and other stores that specialize in E-Bikes. Companies such as Rad Power
Bikes are also helping drive E-Bike sales in North America by offering consumers the ability to
shop online for an E-Bike model and have it shipped directly to their door.
| 15Capital Region Local Government EV + E-Bike Infrastructure Backgrounder
4. Plan + Policy Review
4.1 Official Community Plans in the Capital Region
To understand local policy priorities with respect to EVs and E-Bikes, a review of all thirteen
municipalities’ Official Community Plans (OCPs) and three electoral areas was completed. The
results are presented in Table 8.
Notes:
1. No references to E-Bikes were noted in any OCP documents. Accordingly, E-Bikes are not
included in the summary table below.
2. The Juan de Fuca electoral area is comprised of seven communities, each of which has an
OCP. None of these communities’ OCPs were found to have any policy language on EVs or E-
Bikes. The Southern Gulf Islands and Salt Spring Island electoral areas are in the Islands Trust
Area, and are therefore all land use planning decisions are under the authority of the Islands
Trust. The table only includes a community if policy was identified.
| 16Capital Region Local Government EV + E-Bike Infrastructure Backgrounder
Table 8. Overview of EV OCP Policies in the Capital Region
Municipality / Island Established Policies
Colwood Policy 8.2.6.6, direction to:
• Install public charging stations
• Review parking standards to include EV charging stations in new development
Esquimalt Multiple policies, as follows:
• Encourage installation of EV charging in medium-high density residential
(Section 5.3)
• Encourage installation of EV charging infrastructure in commercial/mixed-use
developments (Section 6.1)
• Increase capacity for alternative fuelling such as electric (Section 13.3.6)
• Pursue installation of EV charging capacity in new buildings during re-zoning
(Section 13.3.6)
• Provide fast chargers in commercial areas where there is quick customer
turnover (Section 24.5.4)
Galiano Island Land Transportation Policy A:
• The Local Trust Committee may require EV charging stations instead of parking
spaces. Parking standards may be established for EV charging stations in
appropriate locations
Highlands Policy 15, Section 5.3.2:
• Increasing access to low impact renewable powered vehicle technology such as
EV charging stations
Policy 2, Section 6.4:
• Encourage EV charging station installation as part of emission reduction policies
Mayne Island Policy 2.4.1.10 (Section Retail Commercial):
• Provision of EV charging stations in lieu of parking spaces for commercial uses
North Pender Island Policy 3.1.3.2 (Section Road Transportation):
• Encourage EV charging stations to reduce auto-dependence
Policy 4.7.2 (Section Climate Change and Adaptation):
• Provision of EV charging stations in lieu of parking spaces for commercial uses
Table 8. Overview of EV OCP Policies in the Capital Region, cont.
Municipality / Island Established Policies
North Saanich Policy 18.7.11e (Section 18.7, Greenhouse Gas Reduction):
| 17Capital Region Local Government EV + E-Bike Infrastructure Backgrounder
• Promote low-emission vehicles with EV plug-in charging posts at private and
public locations through re-zoning or development variances
Oak Bay Section 8.3.3 (Multi-Unit Residential DPA):
• Provide EV charging stations
Salt Spring Island Policy B.5.1.2.15 (Section Village Land Use Objectives and Policies):
• Cooperation of MoTI with Salt Spring Island Transportation Commission to
consider licencing EVs in or near villages
Saturna Island Policy E.5.11 (Section Climate Change Mitigation and Adaptation):
• Provision of EV charging stations in lieu of parking spaces for commercial uses
South Pender Island Policy 6.1.3 (b) iii (Section Land Transportation):
• The Local Trust Committee may require EV charging stations instead of parking
spaces. Parking standards may be established for EV charging stations in
appropriate locations
Victoria Policy 7.10.4:
• Provision of EV parking at key destinations
View Royal Policy TR 3.12:
• Encourage new developments to be EV charge ready
| 18Capital Region Local Government EV + E-Bike Infrastructure Backgrounder
As shown in Table 8, policy direction around electric vehicles varies considerably across the Capital
Region. A number of communities provide no direction at all (e.g., Central Saanich, Langford,
Metchosin, Saanich, Sidney and Sooke) whereas other communities have at least one policy
including North Saanich, Oak Bay, Victoria, View Royal, and several of the Southern Gulf Islands.
Esquimalt and Colwood—two communities that recently updated their OCPs—were found to have
the most detailed EV policies including specific direction to expand the public charging network
along with requiring new developments to be EV-ready and/or provide a charging station.
While the District of Saanich was not found to have any EV policy in its OCP, the District does
identify the importance of EVs in its Climate Action Plan, which sets a target of 5,000 EVs in the
community by 2020. 22 The City of Victoria recently adopted the 2018 Climate Leadership Plan. One
of the priority actions is to design and implement a vehicle electrification strategy to promote and
support the transition to electric vehicles.
Not a single community within the Capital Region provides any policy direction around E-Bikes.
This may be due to the fact that E-Bikes are a recent phenomenon; however, it does indicate that
planning policy has not caught up with this emerging technology.
4.2 EV Specific Regulations in the Capital Region
The Town of View Royal is the only municipality in the Capital Region that currently has a
requirement for electric vehicle charging in new developments. Per their Zoning Regulation Bylaw,
the regulation reads as follows:
For every commercial or multiple unit residential development that requires more than 100
parking spaces, an electric vehicle charging station is required on the lot, in a location which is
accessible to the patrons or residents.
| 19Capital Region Local Government EV + E-Bike Infrastructure Backgrounder
4.3 EV & E-Bike Specific Regulations in Other Parts of British Columbia
A handful of Lower Mainland municipalities have specific regulations and policies for EV and/or E-
Bike charging infrastructure in development. Table 9 features regulations in three select
jurisdictions. A comprehensive summary of regulations from all communities is in Appendix A.
Table 9. Overview of EV & E-Bike Regulations for Select Municipalities in Metro Vancouver
Municipality
Land Use District of North
City of Vancouver City of Richmond
Vancouver
Commercial A minimum of one parking Target 10% of parking stalls N/A
space for every ten parking wired for level 2 (240v)
spaces, plus one space for any charging. Appropriate
additional parking spaces amounts of level 1 (110v) and
that number less than ten, level 2 (240v) charging will
shall be provided with an be determined based on:
energized outlet capable of
• Proximity to regional roads
providing Level 2 charging or
and highways
higher to the parking space.
• Expected length of stay
based on long term land
use tenure
Multi-Family • 100% of parking stalls, • 20% of parking stalls EV- Require all parking stalls, with
Residential excluding visitor stalls, are ready, wired for level 1 the exception of visitors
provided with an energized (110v) charging. parking, in all new residential
outlet capable of providing construction, including single
• Conduit in place so all stalls
Level 2 charging or higher family homes, duplexes,
can later be wired for level
in new multi-family townhomes, and multifamily
1 (110v) charging.
buildings including buildings to feature an
rowhouses • All secure bicycle storage energized outlet capable of
must include level 1 (110v) providing Level2 charging or
• Each two Class A bicycle
electric outlets for electric higher to the parking space.
space must have an
bicycle charge
electrical outlet
Single-Family New one-family, two-family, N/A As above
Residential rowhouses, and laneway
houses must have an
energized outlet capable of
providing Level 2 charging or
higher to garage or carport.
| 20Capital Region Local Government EV + E-Bike Infrastructure Backgrounder
Other municipalities in Metro Vancouver are in the process of developing their EV regulations. A
telephone interview with the City of Surrey confirmed that the City is in the “policy development”
stage at this time. 23 They are planning to adopt similar EV regulations to Richmond, which would
require 100% of parking stalls in residential developments to be EV-ready. The City of Surrey is
also planning to adopt a requirement for commercial buildings but the exact percentage is
unknown at this time.
City of Burnaby Council recently approved bylaw requirements to make all new residential parking
spaces EV-ready by providing an energized outlet for Level 2 charging, including in single-family
homes and multi-family buildings of all sizes. 24 The official bylaw language is not yet in place,
however, amendments to the Zoning Bylaw to reflect these changes are forthcoming. The City is
also reviewing options for EV charging requirements for new commercial and institutional
development, investigating opportunities for providing public charging, and exploring the use of
electric vehicles in municipal fleets. 25
The City of Vancouver and District of North Vancouver are the only local governments that were
found to have specific regulatory language on E-Bikes. The City of Vancouver’s bicycle parking
requirements require 50% of off-street long-term bicycle parking spaces to have access to an
electric outlet.26 The District of North Vancouver requires that all secure bicycle storage include
level 1 (110v) electric outlets for electric bicycle charging.
4.4 Regulatory Aspects of Selling Electricity for EV Charging
The BC Utilities Commission (BCUC) regulates the sale and resale of electricity in BC. Municipalities
who sell electricity to its residents are exempt from the BCUC. BCUC is undertaking an inquiry to
explore the potential regulatory issues and opportunities in the EV charging stations market.
As indicated in the inquiry FAQ, the services, rates, and rate design associated with EV charging are
currently in an early development stage in BC. But, with the growing popularity of EVs and
increasing availability of public charging stations—currently over 1,000 in the province—there is a
need to assess the regulatory needs, or lack thereof, that would “be associated with EV charging
service, and can also include the setting of rates for EV charging service and any other matters that
are of concern or interest to stakeholders”. 27 The results of this inquiry will have direct implications
| 21Capital Region Local Government EV + E-Bike Infrastructure Backgrounder
for how municipalities establish a fee and set rates for their municipally owned EV charging
stations. More information about the inquiry is found online.1
A related regulatory issue pertains to the Strata Property Act, where regulations were amended in
March 2018 to “include user fees for services or costs of service that only apply to common
property and common assets”. This effectively allows a strata corporation to adopt a bylaw or rule
that determines a cost for electric vehicle charging at a fixed rate per hour of charging, which
would include the cost of electricity and the cost of any upgrades or maintenance requirements of
the strata corporation.28 Even though these amendments have been made to the Strata Property
Act, strata corporations are still not legally permitted to sell electricity according to BCUC laws.
Section 21 of the Utilities Commission Act requires any entity selling electricity to register as a
public utility, which makes it difficult for a strata to sell electricity to EV owners.29
The issue facing the Strata Property Act will also need to be considered in the BCUC inquiry.
1 More information about the BCUC Inquiry is available here: http://www.bcuc.com/Documents/Proceedings/2018/DOC_50755_02-08-
2018_BCUC-EV-Charging-FAQ.pdf
| 22Capital Region Local Government EV + E-Bike Infrastructure Backgrounder
5.0 Public EV Charging Additional Considerations
Municipal policy and regulation may be one of the most effective ways to provide opportunities
for EV charging, and thereby help increase EV adoption rates. However, there are a number of
other practices and actions that municipalities have pursued to site and manage EV charging
infrastructure. This section presents a summary of some of those practices, touching on the Capital
Region, Metro Vancouver, and the cities of Portland and Montreal.
5.1 Public Charging Station Networks
A 2015 report by the International Council on Clean Transportation (ICCT) analyzed the actions that
are impacting electric vehicle deployment in the 25 most populated US metropolitan areas. One of
the study’s most relevant findings is that the number of public chargers per capita is a significant
factor in a city’s EV share. Public charging infrastructure can help alleviate range anxiety, extend
the functional range of an EV, offer an economic incentive when the electricity is provided for free,
and demonstrate support from municipalities and businesses. 30 With 120 charging stations in the
Capital Region, there are approximately 31 stations per 100,000 people.
In the Capital Region, almost all municipalities provide publicly accessible EV charging stations.
According to ChargeHub, in July 2018 there were approximately 120 EV charging stations within
the region, 116 of which are Level 2, and 4 of which are Level 3 (fast charger).31 Common
locations for municipally / regionally managed stations include:
• Libraries
• Municipal Halls
• Community or Recreation Centres
• Park and Ride Facilities
• Public Parkades
The City of Montreal has taken a different approach to siting its City-owned charging stations.
Many EV owners who live in the core part of the city do not have access to a home charging
station. As such, the City has strategically sited 400 of its 475 public charging stations on-street to
provide viable charging opportunities for the “garage orphans” that is, households that do not have
access to a carport or garage, and therefore do not have the ability to charge an EV. It was
reported that having access to a public charging network in Montreal has been valuable for
increasing EV uptake among prospective EV owners.32 The City is planning to provide another 200
public EV stations by the end of this year, which would bring its total to 675. 33
| 23Capital Region Local Government EV + E-Bike Infrastructure Backgrounder
Both the City of Portland and City of Vancouver explained how Level 2 charging stations in their
respective cities are found in locations that are highly visible and where dwelling times are
typically longer than an hour. These locations include park and rides, community centres, grocery
stores, malls, and coffee shops and parks. The City of Vancouver specifically sites charging
stations34 based on the following criteria:
• Level 2 chargers | where people typically spend 1–2 hours such as community centres and
malls
• DC Fast chargers | where people typically spend 45 minutes to an hour including
restaurants, coffee shops, downtown hubs, and grocery stores
• Neighbourhood site specific DC fast chargers | sites with higher density, older housing
stock, and higher rates of rental properties
The City of Portland has an initiative called “Electric Avenue”, which is a research project between
Portland State University, Portland General Electric, and the City of Portland that allows EV owners
and E-Bike users to park and charge their vehicle. One of the main objectives of Electric Avenue is
to raise awareness among the general public of a parking and charging “oasis” in downtown
Portland. Electric Avenue offers four Level 2 stations and 1 Level 3 fast charger. 35,36 An important
part of the project’s success has been its visibility and the convenience it has provided to EV
users. 37 Plug In BC also reported that “clustering” of stations is becoming a best practice. In
addition to the convenience benefits identified in Portland’s Electric Avenue initiative, clustering
stations also gives EV users more confidence that they will receive a charge due to the larger
number of stations that could be available. 38
The City of the Montreal was the only interviewed municipality that reported how clustering Level
2 charging stations in one location was not successful, such as the 16 stations around City Hall.
They have found that it is more useful and strategic to site the stations in areas where they are
visible. 39
| 24Capital Region Local Government EV + E-Bike Infrastructure Backgrounder
A 2018 Nissan Leaf parked in the EV only parking stall at the Oak Bay Municipal Hall.
Municipal Halls are a common location for municipally-owned EV charging stations.
5.2 Paying a Fee for Public Charging Station Use
Almost all municipalities in the Capital Region do not currently charge a user fee for utilization of a
public charging station. The only exception is the Township of Esquimalt. The Township only has
one publicly accessible charging station. Due to the increasing demand for the EV charging station,
a user fee of $1.00 per hour came into effect on July 4, 2017. Since 2014, station use has
increased by more than 50% each year. The revenues collected will be used to fund sustainability
initiatives through the Township’s Sustainability Reserve Fund.40
The rationale 41 for introducing the fee is five-fold, as follows:
1. Manage increasing demand
2. Limit the length of charging sessions
3. Provide neighbourhood charging for EV drivers without access to an at-home charger
4. Avoid conflict between station users
5. Reduce range anxiety for current and prospective EV drivers
| 25Capital Region Local Government EV + E-Bike Infrastructure Backgrounder
While charging a user fee for public use is not a common practice in Canada, some leading EV
municipalities such as Montreal and Vancouver do have established fees in place. In Montreal, the
rates are set by the province through the Electric Circuit initiative, which is the largest public
charging station network in the province. Rates for a Level 2 station are $2.50 per charge or $1 per
hour, which is billed per minute while the vehicle is connected to the station. This rate structure
allows for flexibility in the charging time needed by drivers. Level 3 stations are $10 per hour and
are billed per minute while the vehicle is connected to the station.42
As of spring 2017, the City of Vancouver started charging a user fee for public charging stations at
City-owned locations. The reasons for introducing the fee are similar to Esquimalt, especially for
helping encourage turnover. The City found that on average, users were connected to the charging
stations for about 3 hours each session, which was approximately double the amount of time
required to receive a full charge.43 The rates are as follows:
• Level 2 station – $2 per hour ($0.033 per minute)
• Level 3 station – $16 per hour ($0.267 per minute)
Other municipalities that the project team spoke with including the City of Surrey, City of North
Vancouver, City of Port Coquitlam, City of Richmond, and City Burnaby all confirmed that they have
plans in the immediate future to introduce a fee for their public charging stations, which indicates
that there is trend toward this practice in the Metro Vancouver region.
| 26Capital Region Local Government EV + E-Bike Infrastructure Backgrounder
6.0 Barriers to EV & E-Bike Adoption
6.1 Electric Vehicles
Research has identified a number of barriers to electric vehicle adoption. Understanding the key
barriers are critical for determining the most appropriate suite of policies, strategies, and incentives
that could be implemented to alleviate barriers and increase EV adoption rates. Based on a review
of the literature and experience from other jurisdictions, a summary of the most common barriers
to EV adoption are summarized as follows. This section also includes results from the online public
survey that was open to residents in the Capital Region from June to July 2018. More information
about the survey is presented in Section 8.0.
“Range Anxiety” – Real Vs. Perceived
Widely reported as one of the most commonly reported barriers, potential EV buyers cite range
anxiety as one of main reasons why they do not purchase a vehicle.44,45 Range anxiety refers to
the fear of running out of battery power before the next opportunity is available to charge a
vehicle. Battery range is generally improving in newer vehicles with some vehicles capable of
travelling over 500+ km on a single charge. However, the perception of range anxiety is still a key
barrier to adoption. Studies have shown that a large gap exists between perceived and real-word
range anxiety which can be alleviated by driving experience. 46 Research has also found that as the
range of an EV increases, so does the willingness to purchase of vehicle. 47
A recent survey by BC Hydro found that more than six in 10 British Columbians reported that there
is not enough charging infrastructure in BC to make them feel comfortable about purchasing or
leasing an EV. This issue though, is more related to perceived range anxiety as BC Hydro reported
that approximately 95% of car trips in BC are less than 30 kilometres. In addition, the study also
reported that the availability of EV models is improving in the province with newer vehicles
offering greater range. 48
The issue of perceived range anxiety was also identified in the Capital Region public survey, where
11 of 58 respondents indicated that it is a barrier affecting their decision to purchase an EV.
However, perceived range anxiety appears to be less significant of an issue for residents in the
Capital Region compared to other geographies.
While perceived range anxiety is less of an issue for residents in the Capital Region, survey
respondents were also asked to state challenges with EV ownership. This question was directed to
| 27Capital Region Local Government EV + E-Bike Infrastructure Backgrounder
those who own an EV or plan to purchase one. Specifically, 111 of 540 respondents identified
range anxiety as a challenge. Responses to this question largely fit into two themes, as follows:
• Limited range for long-distance travel
• Lack of public charging facilities to alleviate range anxiety, specifically, the lack of level 3
(DCFC) stations
Purchase Price
The price of an electric vehicle, which is strongly influenced by battery costs, have been identified
as being one of the most significant obstacles to widespread EV adoption. 49 Research and
consumer surveys have consistently found that price is a major barrier to EV sales. The 2017
survey by Plug’n Drive confirmed that the top reason gasoline-powered car owners choose not to
purchase an EV is price.50
Plug’n Drive’s final report highlighted the importance of communicating the “total cost of
ownership” of a gasoline-powered car versus an EV. An understanding of the total cost of
ownership can increase the likelihood that drivers of small and mid-size cars making a decision to
purchase a plug-in hybrid or a battery electric vehicle. 51 The BC Hydro study reported that the total
costs of ownership for three 2018 EV models was less expensive than three comparable gas-
powered cars. For example, it reported that a Nissan Leaf is $1,465 cheaper than a Honda Civic
over an annual basis, which is mostly due to fuel costs ($449 for electricity vs. the Civic’s $1,705 in
gas at 20,000 kilometres per year). 52
Purchase price was identified as the most significant barrier in the Capital Region public survey.
Specifically, 30 percent of the respondents selected “EVs are too expensive” as the main factor for
why they do not own or plan to purchase an EV. Qualitative responses confirmed that the existing
price of an EV is not yet financially competitive with an internal combustion engine.
| 28Capital Region Local Government EV + E-Bike Infrastructure Backgrounder
Lack of Knowledge + Experience with EV Technology
Most potential EV buyers have little knowledge of electric vehicles and almost no experience with
them. Public consumer surveys have shown that many consumers do not even know someone
with practical experience driving or charging EVs.53 A 2017 Canadian survey found that more than
40% of interviewed EV owners were introduced to EVs by a friend, a relative or a colleague before
owning one. Gasoline-powered car owners had never been exposed to an EV before buying their
car.54 In sum, lack of experience and familiarity with EVs can act as a major barrier to widespread
adoption and perpetuate myths about the technology itself.
Charging Time
On average, a gasoline-powered vehicle can refuel in approximately 4 minutes, whereas an EV
requires approximately 30 minutes at a DC fast charger station and up to several hours from a 110
or 220 V outlet, depending on the battery size.
Lack of Variety in Model Types
Various studies and consumer experiences have identified the lack of variety of EVs at the
dealership as a barrier to EV adoption. One study indicated that EVs will need to become available
in a broader set of vehicle types, or consumers will need to shift their interests in EV vehicle types
if EVs are to achieve high percentages of vehicles purchases.55 This appeared to be less of a barrier
/ issue in the Capital Region public survey where only 10% of respondents indicated that the lack
of model or vehicle types is a significant factor.
A recent article published in Business Insider identified 30 distinct electric vehicle models that are
slated to come to the market by 2025. These vehicles, to be offered by several different car
manufacturers, will include SUVs (e.g., Tesla Model Y, Audi e-tron, Mercedes-Benz EQC, Volvo
XC40), sedans (e.g., Subaru Crossover, Volkswagen I.D.), a pick-up truck offered by Tesla, and
luxurious vehicles such as the Porcshe Taycan.56 Greater diversity in model types will appeal to a
broader segment of the market.
| 29You can also read