CAPITALAND CHINA TRUST - 1Q 2021 Business Update 27 April 2021 31 July 2019
←
→
Page content transcription
If your browser does not render page correctly, please read the page content below
CAPITALAND CHINA TRUST
1Q 2021 Business Update
27 April 2021             31 July 2019
Disclaimer
This presentation may contain forward-looking statements. Actual future performance, outcomes and results may differ materially from those
expressed in forward-looking statements as a result of a number of risks, uncertainties and assumptions. Representative examples of these factors
include (without limitation) general industry and economic conditions, interest rate trends, cost of capital and capital availability, availability of real
estate properties, competition from other developments or companies, shifts in customer demands, shifts in expected levels of occupancy rate,
property rental income, charge out collections, changes in operating expenses (including employee wages, benefits and training, property
operating expenses), governmental and public policy changes and the continued availability of financing in the amounts and the terms necessary
to support future business.

You are cautioned not to place undue reliance on these forward-looking statements, which are based on the current view of management
regarding future events. No representation or warranty express or implied is made as to, and no reliance should be placed on, the fairness,
accuracy, completeness or correctness of the information or opinions contained in this presentation. Neither CapitaLand China Trust Management
Limited (“Manager”) nor any of its affiliates, advisers or representatives shall have any liability whatsoever (in negligence or otherwise) for any loss
howsoever arising, whether directly or indirectly, from any use of, reliance on or distribution of this presentation or its contents or otherwise arising in
connection with this presentation.

The past performance of CapitaLand China Trust (“CLCT”) is not indicative of future performance. The listing of the units in the CLCT (“Units”) on the
Singapore Exchange Securities Trading Limited (SGX-ST) does not guarantee a liquid market for the Units. The value of the Units and the income
derived from them may fall as well as rise. Units are not obligations of, deposits in, or guaranteed by, the Manager or any of its affiliates. An
investment in the Units is subject to investment risks, including the possible loss of the principal amount invested. Investors have no right to request
that the Manager redeem or purchase their Units while the Units are listed on the SGX-ST. It is intended that holders of Units may only deal in their
Units through trading on the SGX-ST.

This presentation is for information only and does not constitute an invitation or offer to acquire, purchase or subscribe for the Units.

                                                                                                                                                          1
                                                               1Q 2021 Business Update *27 Apr 2021*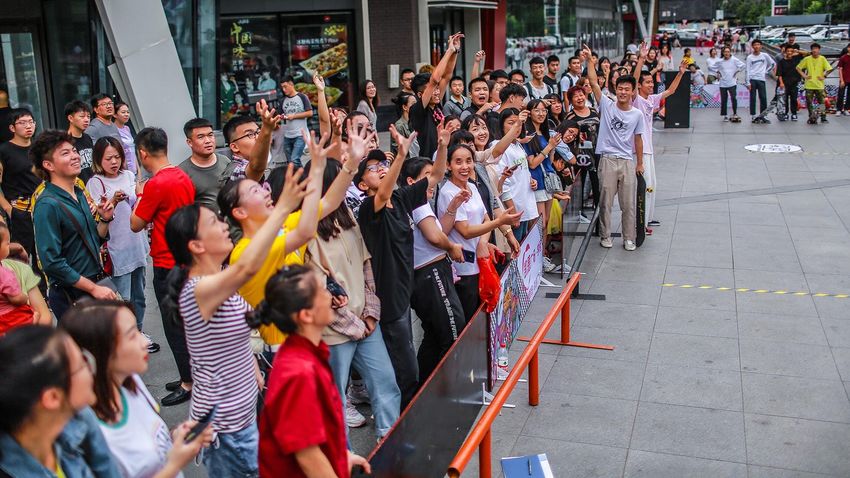
Contents

                                 1            1Q 2021 Developments

  Rock Square, Guangzhou
                                 2            Capital Management

                                 3            Looking Ahead

  CapitaMall Xuefu, Harbin

                                                                     2
                             1Q 2021 Business Update *27 Apr 2021*
1Q 2021
Developments

               CapitaMall Xuefu, Harbin
Key Highlights for 1Q 2021
                                                                                                                                              Net Property Income
Portfolio NPI boosted by:
• Retail
       • 100% ownership of Rock Square                                                                                                            RMB264.2 million
       • New contribution from CapitaMall
           Nuohemule
                                                                                           RMB million
       • Improved Retail segment recovery                                                                           328.6
                • Normalisation of operating margin
                                                                                                                                                                               264.2
                • Reduction in lease restructuring
                • Decrease in arrears cases

• Business Parks                                                                                                                                       ~80%
                                                                                                                                                      of 1H 2020
       • Progressive contribution of Business Parks on
           completion1
       • Strong performance of Business Parks                                                                                                                                            1
                                                                                                                  1H 2020                                                    1Q 2021

Note:
1. The acquisition for Ascendas Xinsu Portfolio, Ascendas Innovation Towers and Ascendas Innovation Hub has been completed. The acquisition of the two remaining business parks is expected to be   4
    completed by 2Q 2021.
                                                                                 1Q 2021 Business Update *27 Apr 2021*
Enlarged and More Resilient Portfolio
                     Largest Multi-Asset China Focused S-REIT

                             Proxy for Growth in China’s Future Economy

                                                                                                   Strategic Addition of Business Parks
                                  GFA
                               ~1.7 million
   Retail                         sq m
 Occupancy1
   94.4%                                                     No. of Cities
BP Occupancy1                                                     10
        92.1%
                                      Retail
                                         11

                                                           Business Park2
                                                                        5                                                                             Divestment of Non-
                                                                                                                                                          Core Asset
Notes:
1. Based on committed leases as at 31 March 2021.
                                                                                   1Q
2. The acquisition of Singapore-Hangzhou Science & Technology Park Phase I and Phase     2021 Business
                                                                                     II (SHSTP Phase I &Update     *27 Apr
                                                                                                        II) is expected    2021*
                                                                                                                        to be completed by 2Q 2021.
                                                                                                                                                                           5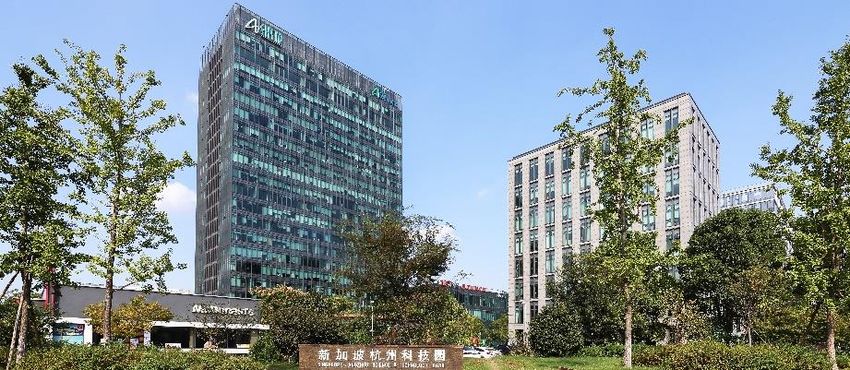
Strategy to Propel Growth
                                              Entering a New Phase – Organic + Acquisitive + Reconstitution Growth
                                                                                Acquisition Value                Divestment Value
                                                                                                                                                                                                       AUM
                                                                                                                                                                           777                     S$4.4 billion1
                                                                    Active Rejuvenation and
                                                                                                                                         107
                                                                     Disciplined Recycling

                                                                                                                                                                          4,945
                                                                                                                                        3,768

                                    1,500                                                              1,704
                                                                     1,130                                                                                                                                   918

                                    2016                             2017                              2018                             2019                              2020                           1Q 2021

Total Acquisition and
Divestment Value                   1,500                            1,130                             1,704                            3,875                             5,722                              918
(RMB million)

                                Acquired                      Divested CapitaMall                 Acquired 51% of              • Acquired portfolio               • Acquired portfolio             Divested CapitaMall
                             CapitaMall Xinnan                      Anzhen                         Rock Square                   of 3 retail assets                 of 5 Business Parks            Minzhongleyuan and
                                                                                                                               • Acquired Yuquan                    and 49% of Rock                 CapitaMall Saihan4
                                                                                                                                 Mall2                              Square3

                                                                                                                                   Divested 51% of                 Divested CapitaMall
                                                                                                                                   CapitaMall Wuhu                         Erqi
   Notes:
   1. As at 31 December 2020. Assuming completion of the five business parks on effective stake basis, excluding CapitaMall Minzhongleyuan and CapitaMall Saihan.
   2. Yuquan Mall has been renamed to CapitaMall Nuohemule. CapitaMall Nuohemule was launched on 20 December 2020.                                                                                                          6
   3. Acquired 51% interest in Ascendas Xinsu Portfolio, 100% interest in Ascendas Innovation Towers, 80% interest in Ascendas Innovation Hub, 80% interest in Singapore-Hangzhou Science & Technology Park Phase I And Phase II.
   4. Divestment of CapitaMall Saihan is expected to be completed by 2Q 2021.                 1Q 2021 Business Update *27 Apr 2021*
Strategically Aligned to China’s Growth
Pillars
                      China 2020 GDP and 1Q 2021 Grew 2.3% and 18.3% YoY 1. IMF projected 8.4% GDP growth YoY for
                      20212. China was the only major economy to have registered an expansion despite COVID-19.

                       China

         Boost Domestic Consumption                                                                                      Enhance Technological Independence
                                                                                        CLCT
                                                                                  Strong Building Blocks
        •     Adopting “Dual Circulation”                                                                                   •   To boost domestic capabilities,
              strategy to pivot China to self-                                                                                  China aims to increase R&D
              reliance on domestic                                                                                              spending by more than 7% over
              consumption, distribution and                                                                                     the next 5 years
              production                                                   Growth Pillar            Growth Pillar
                                                                                                                            •   China is expected to introduce
        •     China’s 1Q 2021 Retail Sales                                                                                      policy support such as tax
                                                                              Retail              Business Park                 incentives to encourage
              improved 33.9% YoY1
                                                                                                    (New Economy
                                                                                                                                enterprise spending on
                                                                                                       Assets)
                                                                                                                                innovation and research

Notes:
1. China Bureau of Statistics.
2. International Monetary Fund World Economic Outlook Update April 2021.                                                                                          7
                                                                                 1Q 2021 Business Update *27 Apr 2021*
Entering 2021 Stronger

                                  Operations                                                           Financials

              Retail                      Business Parks

Above market occupancy of         Higher BP occupancy of 92.1%                      Gearing of 35.1%, well below 50%
94.4%, through consecutive        secured post-acquisition                          regulatory limit
quarterly improvements

Encouraging recovery in sales     By mid 2Q 2020, percentage of                     Competitive weighted average
and traffic                       workforce reporting to work                       cost of debt of 2.51%
                                  returned to pre-COVID-19 levels

Less downward pressure on         Strong rental reversion achieved                  Strong financial flexibility with
portfolio rental reversion rate   to-date                                           S$1.4 billion debt headroom

                                                                                                                        8
                                            1Q 2021 Business Update *27 Apr 2021*
Improved Portfolio Diversification
                          Geographical Diversification                                                                                        Asset Class Diversification

                                                                   Tier 2 Cities
                                                                       47%
                                          Suzhou,
                                       Hangzhou, Xi’an
                                            26%
                                                                  Changsha,
                                                                  Chengdu,                                              Retail                                              Business Park
                                                                   Harbin
                         Guangzhou                                                                                      74%                                By                  26%
                            11%                   By                21%

                                                 GRI1                                                                                                     GRI1

                                                                                        Other
      Tier 1 Cities
                                          Beijing,                                 Provincial Cities
          49%                            Shanghai                                           4%
                                           38%

Note:
1. As at 31 March 2021. Retail portfolio excludes CapitaMall Saihan and CapitaMall Minzhongleyuan. Business park portfolio on a 100% basis.
                                                                                                                                                                                     9
                                                                                        1Q 2021 Business Update *27 Apr 2021*
Improved Portfolio Diversification
Tenant Diversification
High Exposure to Emerging High-Growth Sector2 From Established
Strong Focus on Essential Sectors1 that Cater to Lifestyle Needs
Companies
Supermarket
Essential Sectors 7.4% Electronics
by GRI Others
42.9% 18.5%
37.7%
F&B
31.5%
Retail BP
Engineering
GRI3 GRI3 14.0%
Emerging
High-Growth
Non-Essential Sectors Sectors
57.1% 62.3%
E-Commerce
Services Financial Services
13.6%
4.0% 5.1% ICT
Notes:.
1. Essential Sectors in the retail portfolio refer to Supermarket, F&B and Services. 11.1%
2. High-Growth Sectors in Business Park portfolio refer to Electronics, Engineering, E-commerce, ICT, Financial Services.
3. As at 31 March 2021. Retail portfolio excludes CapitaMall Saihan and CapitaMall Minzhongleyuan. Business park portfolio is reported on a 100% basis. 10
1Q 2021 Business Update *27 Apr 2021*Portfolio Lease Expiry Profile
Well-Staggered Lease Expiry Profile1
WALE (years) Retail Business Park Portfolio
By Gross Rental Income 2.3 2.0 2.2
By Net Lettable Area 3.5 2.1 2.7
% of total Gross Rental Income2,3
23.4%
15.0%
11.8%
10.6%
8.2% 8.5%
6.1% 5.9%
3.6% 4.3%
1.9%
0.7%
2021 2022 2023 2024 2025 2025 and Beyond
Retail Business Park / Industrial
Notes:
1. Based on contractual committed leases for 31 March 2021. Excludes CapitaMall Saihan as the mall will be divested.
2. Excludes gross turnover rent.
3. As a percentage of each respective mall’s contractual monthly gross rental income for 31 March 2021. 11
1Q 2021 Business Update *27 Apr 2021*Retail Portfolio
CapitaMall Xinnan, ChengduRetail Portfolio Overview
Strengthening Core Retail Assets to Drive Sustainable Growth
Ride on China’s Consumption-Driven Economy
AUM S$3.7 billion1,2
Occupancy 94.4%
No. of Assets2 11
Note:
1. Based on valuation as at 31 December 2020.
2. Excludes CapitaMall Minzhongleyuan as the mall was divested in February 2021. Excludes CapitaMall Saihan as the mall is 13
expected to be divested by 2Q 2021.
1Q 2021 Business Update *27 Apr 2021*Portfolio Shopper Traffic and Tenant Sales1
Uplift in Traffic and Tenant Sales
Shopper Traffic Tenant Sales
million RMB million
1Q 2020 vs 1Q 2021 1Q 2020 vs 1Q 2021
30 1,500
+52.1% +47.2%
25 YoY YoY
20 1,000
15
10 500
5
0 0
1Q 2020 1Q 2021 1Q 2020 1Q 2021
Note:
1. Excludes master-leased mall and CapitMall Minzhongleyuan. Includes CapitaMall Saihan in 2020 and CapitaMall Nuohemule in 2021. 14
1Q 2021 Business Update *27 Apr 2021*Retail Portfolio Occupancy of 94.4%1
Investment Property 31-Mar-20 30-Jun-20 30-Sep-20 31-Dec-20 31-Mar-21
CapitaMall Xizhimen 98.4% 92.6% 95.2% 96.1% 97.4%
Rock Square 98.0% 93.8% 91.9% 93.1% 94.9%
CapitaMall Wangjing 97.9% 93.4% 93.3% 93.3% 93.3%
CapitaMall Grand Canyon 97.0% 90.1% 91.4% 90.4% 91.9%
CapitaMall Xuefu 99.3% 97.3% 97.4% 97.9% 98.2%
CapitaMall Xinnan 98.2% 93.1% 94.0% 94.7% 94.5%
CapitaMall Nuohemule - - - 100.0%2 100.0%2
CapitaMall Yuhuating 98.2% 96.5% 96.7% 97.9% 97.4%
CapitaMall Aidemengdun 96.7% 90.0% 89.0% 92.2% 87.9%
CapitaMall Qibao 87.1% 82.3% 83.8% 80.6% 81.7%
CapitaMall Shuangjing 99.7% 98.5% 98.5% 98.5% 98.5%
CapitaMall Saihan3 99.8% 99.0% 99.2% - -
Retail Portfolio1 97.3% 93.4% 93.7% 94.1% 94.4%
Notes:
1. Based on all committed leases as of 31 March 2021.
2. Exclude non-retail storeroom units. 15
3. CapitaMall Saihan is expected to be divested in 2Q 2021.
1Q 2021 Business Update *27 Apr 2021*Retail Portfolio Lease Expiry Profile
Lease Expiry Profile for 20211
% of total % of total
Investment Property No. of Leases
Gross Rental Income2,3 Net Lettable Area4
CapitaMall Xizhimen 117 37.6% 22.2%
Rock Square 70 23.9% 16.4%
CapitaMall Wangjing 102 35.6% 17.4%
CapitaMall Grand Canyon 53 20.9% 9.1%
CapitaMall Xuefu 234 40.9% 28.6%
CapitaMall Xinnan 87 23.9% 18.4%
CapitaMall Nuohemule 89 16.6% 9.6%
CapitaMall Yuhuating 177 61.0% 69.2%
CapitaMall Aidemengdun 108 53.9% 39.8%
CapitaMall Qibao 44 20.6% 15.7%
Notes:
1. Based on contractual committed leases for 31 March 2021. Excludes CapitaMall Saihan and CapitaMall Minzhongleyuan.
2. Excludes gross turnover rent. 16
3. As a percentage of each respective mall’s contractual monthly gross rental income for 31 March 2021.
1Q2021.
4. As a percentage of each respective mall’s committed net lettable area for 31 March 2021 Business Update *27 Apr 2021*Retail Portfolio Lease Expiry Profile
Lease Expiry Profile By Year1
No. of % of total Gross Rental % of total
Year
Leases Income2,3 Net Lettable Area4
Weighted Average Lease
Expiry (years)
2021 1081 31.8% 22.0%
2022 483 20.4% 12.3% 2.3
By Gross Rental Income2
2023 267 16.0% 10.5%
2024 192 14.3% 21.0% 3.5
By Net Lettable Area
2025 77 5.8% 7.3%
Beyond
89 11.7% 26.9%
2025
Notes:
1. Based on contractual committed leases for 31 March 2020. Excludes CapitaMall Saihan and CapitaMall Minzhongleyuan.
2. Excludes gross turnover rent.
3. As a percentage of monthly contractual gross rental income for 31 March 2021.
4. As a percentage of monthly committed net lettable area for 31 March 2021. 17
1Q 2021 Business Update *27 Apr 2021*Retail Portfolio Leasing Updates1
On a Firmer Footing
Retail Lease Structure Retail Work Done in 1Q 2021
Higher of Fixed or
Turnover Rent New Leases
61.9% 33% Highlights:
• Opportunities to secure
better reversions as
By NLA By NLA consumer sentiments
continue to improve and
more mini-anchor spaces
Pure Turnover Rent
are coming up for renewal
5.1% in 2H 2021
• For the remaining 9
months, 30% of the
Fixed Rent Renewal Leases
area will expire in 2Q
33.0% 67%
2021 and 70% will
• Easing of short term and temporary lease expire in 2H 2021
restructuring cases 16.0% of FY 2021 expiring NLA has been
• Pure Turnover Rent lease structures continue completed in 1Q 2021
to be within acceptable threshold
Note: 18
1QCapitaMall
1. Based on contractual committed leases for 31 March 2021. Excludes CapitaMall Saihan and 2021 Business Update *27 Apr 2021*
Minzhongleyuan.Marketing and Promotional Activities
Enriching Shoppers’ Experience with Engaging Events and Meaningful Experiences
Specially Curated Programmes and Events Thematic Festivities
Organised a large-scale Eco Green event that included various activities
Held a family Lantern Making Activity for the White Rabbit Anniversary at
such as a cycling event and Earth Hour at CapitaMall Xinnan and
Rock Square
CapitaMall Aidemengdun
19
Held various fun-filled activities to increase CapitaMall Nuohemule’s Hosted family-friendly Chinese New Year performances at CapitaMall
outreach and to attract new customers Xizhimen
19
1Q 2021 Business Update *27 Apr 2021*Upcoming Execution Plans
Unlock Value Extract Value
CapitaMall Saihan CapitaMall Grand Canyon, CapitaMall Yuhuating Rock Square
CapitaMall Xizhimen &
CapitaMall Aidemengdun
• Part of the bundle deal to divest • Opportunity to actively reconfigure • ~45% of anchor tenant’s NLA • Ongoing asset enhancement
CapitaMall Saihan and acquire mini-anchor units into smaller units (~9,000 sq m) will be recovered by initiatives
CapitaMall Nuohemule for multiple malls 3Q 2021 • Improve shopper circulation and
• Rejuvenated portfolio with a higher • Higher quality brands across • Planned AEI and reconfiguration area efficiency
quality asset different trade categories will be on recovered space to house • Additional >1,000 sq m of NLA to
• Expected to be completed in 2Q introduced into a combined area more than 30 higher-yielding be added over the next few years
2021 of ~3,000 sq m specialty stores
Maximise Returns Through Selective Asset Enhancements and Reconstitution
1Q 2021 Business Update *27 Apr 2021*
20Business Park
Portfolio
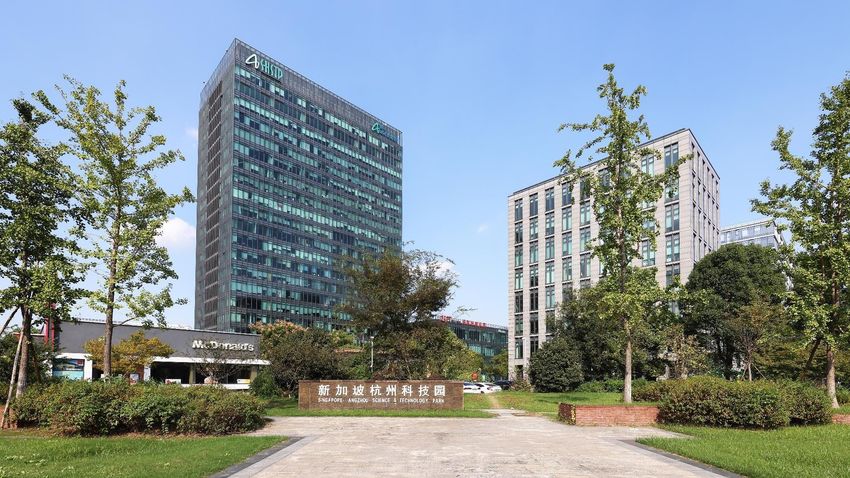
Singapore-Hangzhou Science & Technology Park Phase IBusiness Park Portfolio Overview
Addition of Resilient and Quality Asset Class
Capture China’s Higher-Valued and Service-Led Economy
AUM S$ 671.6 million1,2
Occupancy 92.1%
No. of Assets2 5
Note:
1. Based on agreed property value on effective stake basis. 22
2. The acquisition of Singapore-Hangzhou Science & Technology Park Phase I and Phase II is expected to be completed by 2Q 2021.
1Q 2021 Business Update *27 Apr 2021*Business Park Portfolio Occupancy of 92.1%1
Investment Property 30-Sep-20 31-Mar-21
Ascendas Xinsu Portfolio 90.3% 90.9%
Ascendas Innovation Towers 91.4% 91.8%
Ascendas Innovation Hub 93.1% 96.9%
Singapore-Hangzhou Science Technology Phase I2 93.0% 91.4%
Singapore-Hangzhou Science Technology Phase II2 93.7% 95.0%
Business Park Portfolio 91.5% 92.1%
Notes:
1. Based on all committed leases as at 31 March 2021.
2. The acquisition of Singapore-Hangzhou Science & Technology Park Phase I and Phase II is expected to be completed by 2Q 2021. 23
1Q 2021 Business Update *27 Apr 2021*Business Park Portfolio Lease Expiry Profile
Lease Expiry Profile for 20211
% of total
% of total
Investment Property No. of Leases Gross Rental
Net Lettable Area3
Income2
Ascendas Xinsu Portfolio 96 20.7% 19.8%
Ascendas Innovation Towers 24 18.6% 16.6%
Ascendas Innovation Hub 21 48.7% 47.8%
Singapore-Hangzhou Science
72 36.9% 39.1%
Technology Phase I4
Singapore-Hangzhou Science
17 10.7% 10.4%
Technology Phase II4
Notes:
1. Based on contractual committed leases for March 2021.
2. As a percentage of each respective business park’s contractual monthly gross rental income for March 2021.
3. As a percentage of each respective business park’s committed net lettable area for March 2021.
4. The acquisition of Singapore-Hangzhou Science & Technology Park Phase I and Phase II is expected to be completed by 2Q 2021.
24
1Q 2021 Business Update *27 Apr 2021*Business Park Portfolio Lease Expiry Profile
Lease Expiry Profile By Year1
No. of % of total Gross Rental % of total
Year
Leases Income2,3 Net Lettable Area4 Weighted Average Lease
Expiry (years)
2021 230 23.2% 21.9%
2022 194 31.0% 31.7% 2.0
By Gross Rental Income2
2023 164 22.3% 21.5%
2024 75 13.6% 13.7% 2.1
By Net Lettable Area
2025 20 2.6% 2.3%
Beyond
9 7.3% 8.9%
2025
Notes:
1. Based on contractual committed leases for 31 March 2021.
2. Excludes gross turnover rent for Amenities within Business Park.
3. As a percentage of monthly contractual gross rental income for 31 March 2021.
4. As a percentage of monthly committed net lettable area for 31 March 2021. 25
1Q 2021 Business Update *27 Apr 2021*Business Park Portfolio Leasing Updates
Delivering Resilient Performance
BP Work Done in 1Q 2021 New Tenants in 1Q 2021 by Sector
E-commerce Information and
New Leases Communications (ICT)
17%
33% 28%
Highlights:
• Strong rental reversion
achieved to-date
By By • Expect positive rental uplift
NLA NLA opportunities for AIT and
SHSTP Phase I and II as the
assets are reaching their first
Others and second leasing cycle –
3% adjusted to meet higher
Renewal Leases Electronics
market rent
67% 52%
34.6% of FY 2021 expiring NLA has been Majority of New Tenants are from the
completed in 1Q 2021 emerging high-growth sectors in China
26
1Q 2021 Business Update *27 Apr 2021*Engaging and Nurturing our BP Community
Injecting Vibrancy through Community-Building Events
Celebrated International
Women's Day with freestyle Introduced essential first-aid
painting activities skills to empower tenants
Partnered with Health & Fitness Raised awareness for eco-
Celebrated Chinese New Year
tenants to promote healthy green movement through
with various festive activities
lifestyles in the community fun-filled family activities
27
1Q 2021 Business Update *27 Apr 2021*Capital
Management
CapitaMall Yuhuating, ChangshaFinancial Strength as at 31 March 20211
35.1% 2.51% 4.1x
Gearing2 Average Cost of Debt3 Interest Coverage4
31 Dec 2020: 31.8% 31 Dec 2020: 2.76% 31 Dec 2020: 3.7x
2.70 years_ 73.4%
Average Term to Maturity Unencumbered Assets
as % of Total Assets
31 Dec 2020 : 2.97 years
31 Dec 2020: 72.8%
Notes:
1. All key financial indicators exclude the effect of FRS 116 Leases, except for Interest Coverage Ratio.
2. Based on total borrowings over the deposited properties in accordance to Property Funds Appendix.
3. Ratio of the consolidated YTD 2021 interest expense reflected over weighted average borrowings on balance sheet.
4. Ratio is calculated by dividing the trailing 12 months EBITDA by the trailing 12 months interest expense (includes finance lease interest expenses under FRS 116) in accordance with MAS guidelines.
29
1Q 2021 Business Update *27 Apr 2021*Prudent Capital Management
Well-Distributed Debt Maturity Profile
Debt Maturity Profile (31 March 2021) Composition of borrowings2:
350
~30%
100.5 31.8
Floating Rate
300 28.7 31.7
Fixed Rate
250 ~70% Floating Rate
130.0 Fixed
200
S$ million
150 12.8 300.0 3.9
250.0
270.0 13%
Onshore Loan RMB
100
150.0 1 150.0 150.0 Offshore Loan SGD
50 8%
MTN Onshore Loan RMB
0 - 79%
2021 2022 2023 2024 2025 2026 SGD MTN
Total Debt
(in SGD 162.8 308.7 350.5 301.7 331.8 153.9 1,609.4
million)
Amount of Debt Headroom
% of Total S$1.4 billion to 50% gearing limit
Debt maturing 10.1% 19.2% 21.8% 18.7% 20.6% 9.6% 100.0%
by end FY
+/(-) Assuming +0.1% p.a.
Secured Onshore RMB Bank Loan Notes Issued Under Multicurrency Debt Issuance Programme increase /(decrease) in
S$0.7 million p.a. interest rate on variable rate
Unsecured Offshore Term Loan Floating Bridge Loan
Notes: borrowings
1. Acquisition related bridge loan financing secured in 2020.
1Q 2021 Business Update *27 Apr 2021* 30
2. Total outstanding Debt S$1,609.4 million. ~70% of total debt is fixed (excluding Bridge Loan as well as RMB denominated loans)Looking Ahead
CapitaMall Xuefu, HarbinBusiness Outlook and Key Focus
Operational Outlook
Retail: Business Parks:
• Sector recovery and consumer sentiments leading • Strengthening business confidence exhibited in overall
improvement in operating metrics operating metrics
• Leasing environment remains competitive on asking rents • High-tech industries is a strong demand driver, in line with
• Rate of normalisation impacted by any resurgence of China’s macro government support policies
COVID-19 cases • Robust leasing demand is expected to continue for our
Business Parks
Key Focus
• Resilient and Quality Portfolio
• Retail: Focus on offering lifestyle essentials and necessities to
densely populated vicinity
• Business Parks: Provide high standards of property and customer
services
• CapitaStar: Harnessing CapitaStar platform to drive omni-
channel offerings and value-add services
• Experienced Ground Team with strong domain knowledge to capture
new business trends
• Prudent capital management
• Access to Pipeline of High-Quality Assets held under CapitaLand
Group 32
1Q 2021 Business Update *27 Apr 2021*Poised for Next Phase of Growth
Accelerating Multi-Stage Growth…
Expansion of Investment
CLCT Strategy
of Today CLCT of Tomorrow
Opened Up Possibilities
Integrated Development New Economy Assets
Investible Asset Classes 40% 30%
Long Term
Retail Business Park Commercial Asset Mix
Integrated
Developments
Logistics Industrial Data Centre
Retail
30%
CLCT is the dedicated S-REIT for CapitaLand Group’s
non-lodging China Business with acquisition pipeline Capture China’s consumption-driven, higher-valued,
access to CapitaLand’s China assets. service-led economy
…to Provide Long-Term and Sustainable Returns for our Unitholders
33
1Q 2021 Business Update *27 Apr 2021*Thank
Thank you
You
For enquiries, please contact:
For enquiries, please contact: Ms Nicole Chen, Investor Relations
Direct: (65) 6713 1648, Email:
(Ms) Nicole Chen,nicole.chen@capitaland.com
Investor Relations
CapitaLand China Trust Management Limited (https://www.clct.com.sg)
Direct: (65) 6713 1648, Email: nicole.chen@capitaland.com
168 Robinson
168 Robinson Road,
Road, #30-01
#30-01 Capital
Capital Tower,
Tower, Singapore
Singapore 068912
068912
Tel: (65)
Tel: (65) 6713
6713 2888,
2888, Fax:
Fax: (65)
(65) 6713
6713 2999
2999Appendix
CapitaMall Aidemengdun, HarbinStrength in Portfolio Diversification and Quality
Well-Diversified Exposure with more than 20 Trade Categories Across the Portfolio
Services
Supermarket 2.9%
5.5% Other Retail and Product Trades
Fashion
Sporting Goods & Apparel 2.8%
Essential Sectors 17.1%
Education 2.6%
31.6% Jewellery/Watches 2.1%
Home Living 2.1%
Leisure &
Food & Beverage Entertainment Shoes & Bags 1.5%
23.2% 3.2% IT & Telecommunication 1.3%
Department Stores 1.1%
Beauty &
By Healthcare
Others 3.1%
GRI1 5.2% Other Business Park Trades
Real Estate 2.7%
Electronics
Professional Services 2.4%
4.9%
Biomedical Sciences 1.5%
Engineering Others 3.3%
3.7%
Emerging
Other Retail and E-Commerce High-Growth
Product Trades 3.6% Sectors
ICT
16.6%
Other
2.9% 16.4%
Financial Services
Business Park
1.3%
Trades
9.9% 36
Note:
1Q 2021 Business
1. As at 31 March 2021. Retail portfolio excludes CapitaMall Saihan and CapitaMall Minzhongleyuan. Update
Business *27 Apr is2021*
park portfolio reported on a 100% basis.Portfolio at a Glance1
CapitaMall CapitaMall CapitaMall Grand
Rock Square
Xizhimen Wangjing Canyon
乐峰广场
凯德MALL•西直门 凯德MALL•望京 凯德MALL• 大峡谷
Location Beijing Guangzhou Beijing Beijing
GFA (sq m) 83,075 88,279 83,768 92,918
GRA (sq m) 83,075 83,591 68,010 69,967
NLA (sq m) 50,766 52,683 51,910 44,771
23 Aug 2044 15 May 2043 29 Aug 2044
Land Use Right Expiry 23 Aug 2054
17 Oct 2045
15 May 2053 29 Aug 2054
Valuation (RMB mil)2 3,580 3,414 2,772 2,125
Committed Occupancy 97.4% 94.9% 93.3% 91.9%
Notes:
1. As at 31 March 2021.
2. Based on valuation as at 31 December 2020. 37
1Q 2021 Business Update *27 Apr 2021*Portfolio at a Glance1
CapitaMall CapitaMall
CapitaMall Xuefu CapitaMall Xinnan
Nuohemule Yuhuating
凯德广场•学府 凯德广场• 新南
凯德广场•诺和木勒 凯德广场•雨花亭
Location Harbin Chengdu Hohhot Changsha
GFA (sq m) 123,811 91,816 100,047 75,431
GRA (sq m) 104,294 53,619 76,309 58,575
NLA (sq m) 64,257 36,891 43,928 48,315
Land Use Right Expiry 15 Dec 2045 17 Oct 2047 26 Jul 2049 03 Mar 2044
Valuation (RMB mil)2 1,774 1,600 1,006 760
Committed Occupancy 98.2% 94.5% 100.0%3 97.4%
Notes:
1. As at 31 March 2021.
2. Based on valuation as at 31 December 2020.
3. Exclude non-retail storeroom units. 38
1Q 2021 Business Update *27 Apr 2021*Portfolio at a Glance1
CapitaMall CapitaMall
CapitaMall Qibao CapitaMall Saihan2
Aidemengdun Shuangjing
凯德七宝购物广场 凯德MALL•赛罕
凯德广场•埃德蒙顿 凯德MALL•双井
Location Harbin Shanghai Beijing Hohhot
GFA (sq m) 49,040 83,986 49,463 41,938
GRA (sq m) 43,394 72,729 49,463 41,938
NLA (sq m) 28,371 50,642 51,1933 -
11 Mar 2041
Land Use Right Expiry 7 Sep 2042 10 Mar 20434 10 Jul 2042
20 Mar 2041
Valuation (RMB mil)5 469 836 610 4607
Committed Occupancy 87.9% 81.7% 98.5% -
Notes:
1. As at 31 March 2021.
2. CapitaMall Saihan is expected to be divested by 2Q 2021.
3. Included the area zoned for civil defense but is certified for commercial use.
4. The master lease will expire in January 2024, with the right to renew for a further term of 19 years and two months.
5. Based on valuation as at 31 December 2020.
6. On the basis that CLCT does not exercise its option to renew the master lease which expires in January 2024. Assuming the master lease is renewed, the valuation will be RMB425.0 million.
7. Referring to agreed property selling price for CapitaMall Saihan as it is classified as asset held for sale.
39
1Q 2021 Business Update *27 Apr 2021*Portfolio at a Glance1
Singapore- Singapore-
• Portfolio at a Glance
Ascendas Ascendas Ascendas
Hangzhou
Science
Hangzhou
Science
Xinsu Portfolio Innovation Towers Innovation Hub
Technology Technology
Phase I2 Phase II2
Location Suzhou Xi’an Xi’an Hangzhou Hangzhou
GFA (sq m) 373,334 118,495 40,547 101,811 130,261
NLA (sq m) 349,700 95,156 36,288 101,450 126,294
31 December
4 September
Land Use Right Expiry 2046 to 30 May 19 February 2064 23 May 2051
2056
6 July 2060
20573
Agreed Value (RMB mil)4 2,265 759 298 641 767
Committed Occupancy 90.9% 91.8% 96.9% 91.4% 95.0%
Notes:
1. As at 31 March 2021.
2. The acquisition of Singapore-Hangzhou Science & Technology Park Phase I and Phase II is expected to be completed by 2Q 2021.
3. Ascendas Xinsu Portfolio consists of multiple plots of land with varying land use right expiry.
4. Based on agreed property value on 100% basis. 40
1Q 2021 Business Update *27 Apr 2021*You can also read