CapitaLand Group 24 - 25 September 2013 - 20th CLSA Investors' Forum, Hong Kong - Invest With ...
←
→
Page content transcription
If your browser does not render page correctly, please read the page content below

CapitaLand Group

20th CLSA Investors’ Forum, Hong Kong
        24 – 25 September 2013
Disclaimer

    This presentation may contain forward-looking statements that involve risks and uncertainties.
    Actual future performance, outcomes and results may differ materially from those expressed in
    forward-looking statements as a result of a number of risks, uncertainties and assumptions.
    Representative examples of these factors include (without limitation) general industry and
    economic conditions, interest rate trends, cost of capital and capital availability, availability of real
    estate properties, competition from other companies and venues for the sale/distribution of goods
    and services, shifts in customer demands, customers and partners, changes in operating expenses,
    including employee wages, benefits and training, governmental and public policy changes and
    the continued availability of financing in the amounts and the terms necessary to support future
    business. You are cautioned not to place undue reliance on these forward looking statements,
    which are based on current view of management on future events.

2                                           CapitaLand Presentation September 2013
Contents

    • Strategic Roadmap

    • Financial Highlights

    • Business Highlights

    • Financials & Capital Management

    • Conclusion

3                            CapitaLand Presentation September 2013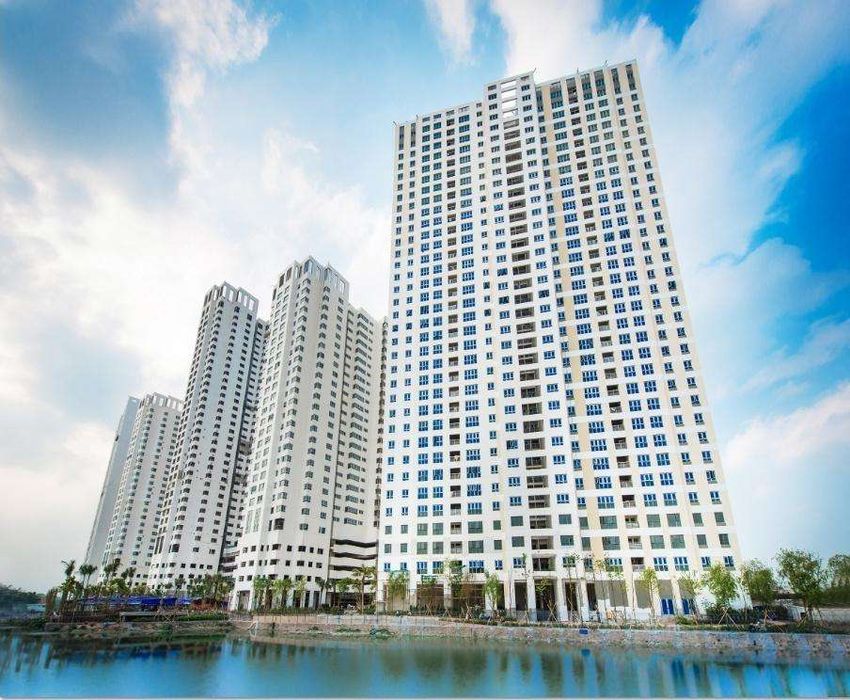
Strategic Roadmap

                         Raffles City Shanghai, China
44
Strategic Roadmap

    WHO WE ARE

    •   We are a growth company underpinned by steady recurring income

    •   We are focused on Asia; riding on growth, urbanisation, consumer demand and
        structural capital appreciation trends in Asia

    WHAT WE DO
    •   We are in the real-estate development business and create value based on our
        deep knowledge of the markets and products, and our strong execution and
        operational capabilities
    •   We will strengthen our leading position in integrated/mixed development projects,
        leveraging on our best-in-class expertise in shopping malls and serviced residences

    WHAT WE WANT
    •   We aim to be a preferred choice for investors looking at the Asian real estate space,
        delivering a sustained and competitive risk-adjusted return
    •   We will continue to optimise our balance sheet by leveraging on the capital
        markets, capital recycling and working with capital partners
5
                                      CapitaLand Presentation September 2013
Strategic Roadmap
     Our Growth Story
    Emphasis On CapitaLand’s Key Strengths

         Focus on Asia:                                                Focus on
            Growth,                                                  Integrated /
         Urbanisation &                                                 Mixed
           Consumer                                                 Developments
            Demand

               Where Opportunities Match Our Strength

6                          CapitaLand Presentation September 2013
Strategic Roadmap
      Our 4 Core Businesses
    A Leading Asian Real Estate Company

          Singapore                             China                               CMA                         Ascott
      AUM: ~ S$12.9 billion               AUM: ~ S$11.5 billion             AUM: ~ S$25.6 billion         AUM: ~ S$6 billion1

      • Leading                          • Leading foreign real           • Asia’s leading             • World’s largest
        developer/owner                    estate developer                 shopping mall                international
        of quality homes,                                                   developer, owner             serviced residence
        offices and mixed                • Quality integrated               and manager                  owner-operator
        developments                       development
                                           portfolio

                     Harness Synergies Across Competencies Through
                             Integrated/Mixed Developments
    1 Includes   all serviced residences owned and leased but excludes 3rd party properties under management contracts
7
                                                        CapitaLand Presentation September 2013
Strategic Roadmap
    Investment Strategy
    2 Core Markets; 6 City Clusters

                                    Beijing                               Guangzhou
                                    Tianjin                                Shenzhen
      Singapore                                                Shanghai
                                                               Hangzhou
                                                                Suzhou
                                 Chengdu                        Ningbo
                                                                            Wuhan
                                Chongqing

                  Focused Allocation Of Capital To Achieve
                             Competitive Scale
8                             CapitaLand Presentation September 2013
Strategic Roadmap
    Target Returns
                        •   Improve project profitability
                            - Faster time to market
                            - Larger scale projects
    ROE target of 8%
                            - Innovation
       to 12% on a
                        •   Recycle stabilised assets and redeploy capital to higher
    sustainable basis
                            return projects
                        •   Ongoing review of investments
                        •   Optimise corporate and financing costs

                        •   Composition of PATMI: Operating, portfolio gains and
                            revaluation
     PATMI & asset
                        •   Optimal mix of Projects Under Development vs. operating
      composition           assets
                        •   Optimal mix of recurrent vs. trading income

9                                  CapitaLand Presentation September 2013
Financial
Highlights

         Raffles City Singapore
Financial Highlights
Overview
2Q 2013 Results
Revenue EBIT1 PATMI2
S$1,182.7 S$690.4 S$383.1
million million million
37% YoY 4% YoY 0.7% YoY
1H 2013 Results
Revenue EBIT1 PATMI2
S$1,844.6 S$1,076.5 S$571.3
million million million
23% YoY 1% YoY 10% YoY
(1) Excluding the S$33.1 million one-off loss incurred on repurchase of convertible bonds, EBIT for 2Q 2013 and 1H 2013 would be S$723.5 million and
S$1,109.6 million, 5% and 6% higher than 2Q 2012 and 1H 2012 respectively
(2) Excluding the S$27.7 million one-off loss incurred on repurchase of convertible bonds, PATMI for 2Q 2013 and 1H 2013 would be S$410.8 million and
S$599.0 million, 6% and 15% higher than 2Q 2012 and 1H 2012 respectively
11
CapitaLand Presentation September 2013Financial Highlights
Group Assets (As at Jun 2013)
(1) Excludes treasury cash
S$36.1 billion1 74% of Group’s Assets in * China including Hong Kong
** Excludes Singapore & China and includes projects in
Singapore & China GCC
*** Includes Australand, Surbana (Consultancy), StorHub,
Financial Services and other businesses in Vietnam, UK
and GCC
Europe & Others
Other Asia**
Corporate & Others*** S$1.1b, 3%
S$3.0b, 8%
S$7.0b, 19%
CLC China*
S$8.6b, 24% S$14.4b, 40%
Australia
S$5.4b, 15%
TAL By By
S$3.3b, 9% SBU Geography
CLS
S$6.3b, 18%
CMA Singapore
S$10.9b, 30% S$12.2b, 34%
12
CapitaLand Presentation September 2013Financial Highlights
Group EBIT (As of 1H 2013)
* China including Hong Kong
77%
** Excludes Singapore & China and includes projects in
S$1.1 billion
of Group’s EBIT from GCC
Singapore & China *** Includes Australand, Surbana (Consultancy), StorHub,
Financial Services and other businesses in Vietnam, UK
and GCC
Corporate & Others*** Australia
S$146.8m, 14% S$158.2m, 15%
CLS Europe & Others
S$258.7m, 24% S$7.6m, 1% China*
TAL
S$53.1m, 5% S$394.1m, 37%
Other Asia**
S$77.2m, 7%
By By
SBU Geography
CMA
S$403.5m, 37%
Singapore
CLC
S$439.4m, 40%
S$214.4m, 20%
13
CapitaLand Presentation September 2013Financial Highlights
Well-Diversified Portfolio
Well-Balanced To Ride Through Cycles
Singapore Assets - S$12.2 billion China Assets - S$14.4 billion
(34% of Group’s Total Assets*) (40% of Group’s Total Assets*)
Serviced Others
Residences 4%
6%
Residential
32%
Retail
39%
Commercial &
Mixed Development
19%
* Excluding treasury cash
14 CapitaLand Presentation September 2013Business Highlights
- CapitaLand Singapore
ION Orchard, Singapore
15Singapore Residential
CapitaLand Singapore
Residential Sales Performance
• Achieved S$1.6 billion sales in 1H 2013 vs. S$467 million in 1H 2012
• 683 units sold in 1H 2013 vs. 259 units sold in 1H 2012
• 139 units sold in 2Q 2013 vs. 202 units sold in 2Q 2012
243% Y-o-Y 1,600
164% Y-o-Y 683
1Q
2Q
467
259
16 CapitaLand Presentation September 2013Singapore Residential
CapitaLand Singapore
Residential Outlook
• Healthy pipeline with projects
in sought-after locations
- 2,200 units (~ 3.4 million sqft
GFA)
• Target to launch Marine Point
and Bishan St 14 in 2H 2013 The Interlace d’Leedon
• Successfully bidded for the Pipeline# Includes:
Coronation Road landed site in The Interlace : 216
prime District 10 d’Leedon : 324
• Continue to bid for well- Sky Habitat : 343
located sites via GLS tenders Marine Point (new) : 124
and private collective sales Bishan St 14 (new) : 694
# Based on total available units as at end June 2013
17 CapitaLand Presentation September 2013Singapore Residential
CapitaLand Singapore
Latest Acquisition : Coronation Road Site
• Successful in June 2013 GLS tender for
the Coronation Road site – the only
landed housing site in the GLS list
• 37,440.7 sqm site located in prime Bukit
Timah residential district and next to
Victoria Park GCB Area
• Walking distance to Farrer Road MRT
Station and future Tan Kah Kee MRT
Station. Near reputable educational
institutions
• Plan to develop a prestigious landed
housing development comprising
semi-detached houses and
bungalows
• Launch-ready by 2Q 2014
18 CapitaLand Presentation September 2013Singapore Commercial
CapitaLand Singapore
CapitaCommercial Trust (CCT)
• Average monthly office portfolio rent per square foot continues to
increase, to S$7.96 psf in 2Q 2013 compared to S$7.83 psf in 1Q 2013
• High portfolio occupancy of 95.8%
CCT’s Monthly average office portfolio rent (psf)
$9.00
$8.73
$8.64
$8.50
$7.94 $7.96
$8.00 $7.84 $7.79 $7.83
$7.66 $7.64
$7.53
$7.45 $7.39
$7.50
$7.00
$6.50
Sep-10 Dec-10 Mar-11 Jun-11 Sep-11 Dec-11 Mar-12 Jun-12 Sep-12 Dec-12 Mar-13 Jun-13
19 CapitaLand Presentation September 2013Singapore Commercial
CapitaLand Singapore
Construction Update On Key Projects
• CapitaGreen
- 700,000 sq ft of Grade A
office space targeted for
completion by 4Q 2014
CapitaGreen : Construction of core wall
• Westgate Tower
- 320,000 sq ft of prime office
space slated for completion
by 4Q 2014
Westgate Tower: Superstructure work in progress
20 CapitaLand Presentation September 2013Malaysia
CapitaLand Singapore
Danga Bay Project In Iskandar
Total waterfront
• A premier GDV: RM8.1 billion (~S$3.2 billion)
residential
community comprising high rise
• andAlanded
premier homeswaterfront
with a residential
central waterfront hub with a
community comprising high rise and
marina, shopping mall, F&B
landed
outlets, homes
serviced with a central waterfront
residences,
huband
offices with a marina, shopping mall, F&B
recreational
facilities
outlets, serviced residences, offices and
recreational facilities
• Freehold net land: RM811 million
(~S$324 million)
Artist’s impression subject to change
• Estimated total GFA: 11 million sqft
(Land cost RM74 psf ppr)
• Master plan submitted to authorities for
approval. First residential project launch
expected by 1H2014
21 CapitaLand Presentation September 2013Business Highlights
- CapitaLand China
Raffles City Beijing, China
22 CapitaLand Presentation May
2013China Residential
CapitaLand China
Residential Sales Performance
• Launched ~ 600 units for sales in 2Q 2013
• Steady demand from 1st time home buyers and upgraders
Healthy Y-o-Y Growth in Units and Sales Value
43% Y-o-Y 3,157
1Q
58% Y-o-Y 1,691
2Q
2,208
1,067
Note: Units sold includes options issued and Raffles City strata apartments
23 CapitaLand Presentation September 2013China Residential
CapitaLand China
Recent Residential Launches Well-Received
• Launched 393 units in 2Q 2013,
~70% sold (Sales Value ~
RMB225 million)
• Total project – Sold ~ 93%1 of
launched units (Sales Value
~RMB2.8 billion)
The Loft, Chengdu
• Launched 79 units in 2Q 2013,
~66% sold (Sales Value ~
RMB67 million)
• Total Project – Sold ~93%1 of
launched units (Sales Value
~RMB1.7 billion)
The Metropolis, Kunshan
Units sold includes options issued. (1) As at 30 June 2013
24 CapitaLand Presentation September 2013China Residential
CapitaLand China
Launch-Ready Residential Projects in 2H 2013
• ~ 1,400 units launch-ready
(Estimated value ~ RMB3 billion)
La Cite, Foshan
Dolce Vita, Guangzhou The Metropolis, Kunshan
25 CapitaLand Presentation September 2013China Residential
CapitaLand China
Residential Projects To Be Handed Over
• ~ 1,900 units expected to be
handed over in 2H 2013
The Paragon, Shanghai
iPark , Shenzhen The Loft, Chengdu Beaufort, Beijing
26 CapitaLand Presentation September 2013China Residential
CapitaLand China
Latest Acquisition : Prime Site in Hanzhonglu, Zhabei District, Shanghai
• A prime site centrally located within the Hanzhonglu Site
Inner Ring of Shanghai (~15 min drive
from Shanghai’s CBD)
• To be developed into a mixed
development comprising residential,
office and retail components
Project details:
GFA (Sqm) Commercial use : ~ 75,000
Residential use : ~ 30,000
Total: ~ 105,000
Acquisition price S$397.5 million
~ RMB25,500 per sqm
CLC’s Stake 70%
Project construction will commence in 2015. Target completion by 2017
Artist impression of Hanzhonglu site
27 CapitaLand Presentation September 2013Raffles City
Raffles City Mixed Developments
Pipeline Of Quality Assets With Stable Rental Income
Stabilised Newly Opened Under Construction
Raffles City Shanghai Raffles City Chengdu Raffles City Changning Raffles City Chongqing
Raffles City Beijing Raffles City Ningbo Raffles City Hangzhou Raffles City Shenzhen
Year 2012 2015/2016 2018
• 8 Raffles Cities with a construction floor area of 3.1 million sqm
• Total property value of RMB62 billion (S$13 billion)1
(1) On a completion basis
28 CapitaLand Presentation September 2013Raffles City
Stabilised Assets
Raffles City Shanghai
• Robust performance – Committed
occupancy of ~99% for retail and
office tower
• Annualised NPI yield on cost ~18%
Newly opened “BySelvage” Motivi Opening Ceremony
Raffles City Beijing
• Strong performance – Committed
occupancy of ~98% for retail and
office tower and above 90%
occupancy for Ascott Serviced
Residences
• Annualised NPI yield on cost ~12% Upgrading of retail brand remix with new tenants
29 CapitaLand Presentation September 2013Raffles City
Newly Operational Assets
Ramping Up Well
• Over 90% committed occupancy for Raffles City Chengdu and Raffles Ningbo
shopping malls
• Well-supported by strong shopper traffic and retail sales
Raffles City Chengdu Shoppers attracted to iconic structure and events at RCC
Raffles City Ningbo Shoppers attracted by the diverse variety of F&B outlets and activities
30 CapitaLand Presentation September 2013Business Highlights
- CapitaMalls Asia
Plaza Singapura, Singapore
31Shopping Malls
CapitaMalls Asia
Strong Operating Financial Performance
2Q 2013 1H 2013
Operating PATMI S$53.6 million (+41.1%) S$120.2 million (+62.2%)
Total PATMI1 S$245.6 million(+5.9%) S$318.8 million (+6.7%)
EPS 6.3 cents (+5.0%) 8.2 cents (+6.5%)
Steady Sales Growth in Key Markets for 1H 2013
Singapore China
+14.9% total tenants’ sales2
Tenants’ sales +3.5% per sq m
+9.5% per sq m2
Shopper traffic +4.2% +0.8%
Same mall NPI +2.0% +12.1%
Interim dividend of 1.75 cents
• Amounts to >20% of 1H 2013 PATMI
• 7.7% higher than 2012 interim dividend
(1) Total PATMI for 2Q 2013 includes: Operating PATMI, Portfolio Gain of S$14.0 mil and Revaluation of S$178.0 million
Total PATMI for 1H 2013 includes: Operating PATMI, Portfolio Gain of S$20.6 mil and Revaluation of S$178.0 million
(2) On a same-mall basis
32 CapitaLand Presentation September 2013Shopping Malls
Shopper Traffic & Tenants’ Sales
1H 2013 vs.
1H 2013
1H 2012 (%)*
Malls
opened Committed
NPI Yield (%)1 on Tenants’ Sales
before Occupancy Rate
Valuation Shopper (on a per sq ft
1 Jan 2012 (%)2
as at Traffic or
as at
30 Jun 2013 per sq m basis)
30 Jun 2013
Singapore 5.9 99.2 4.2 3.5
9.5
China 5.8 96.5 0.8 (excl. Tier 1 cities:
11.0)
Malaysia 7.0 97.0 (2.5) -
Japan 5.2 96.2 6.7 5.4
India 4.2 83.7 25.0 10.9
Note: The above figures are on a 100% basis, with the NPI yield and occupancy of each mall taken in their entirety regardless of CMA’s interest.
This analysis takes into account all property components that were opened prior to 1 Jan 2012.
(1) Refers to weighted average yield of our operational malls..
(2) Refers to the weighted average committed occupancy rate.
* Notes on Shopper Traffic and Tenants’ Sales:
Singapore: Excludes JCube, The Star Vista, Bugis+, The Atrium@Orchard and Hougang Plaza,
China: Excludes 3 master leased malls under CRCT. Excludes tenants’ sales from supermarkets and department stores.
Excludes CapitaMall Minzhongleyuan, which is undergoing AEI.
Malaysia: Point of sales system not ready.
Japan: For Vivit Minami-Funabashi and Chitose Mall only.
33 CapitaLand Presentation September 2013Shopping Malls
Same-Mall NPI Growth (100% basis)
Local Currency Change
Country 1H 2013 1H 2012
(mil) (%)
Singapore1 SGD 343 336 2.0
China2 RMB 1,143 1,019 12.1
Malaysia MYR 132 122 8.3
Japan3 JPY 906 856 5.8
India INR 89 85 4.6
Note: The above figures are on a 100% basis, with the NPI of each mall taken in its entirety regardless of CMA’s interest.
This analysis compares the performance of the same set of property components opened prior to 1 Jan 2012.
(1) Excludes JCube, which was opened in Apr 2012, The Star Vista, which opened in Sep 2012, Bugis+, which underwent AEI until Jul
2012, The Atrium@Orchard, which underwent AEI until Oct 2012, and Hougang Plaza, which was divested by CMT in Jun 2012.
(2) Excludes CapitaMall Minzhongleyuan, which is undergoing AEI. Excluding CRCT, NPI grew by 13.3%.
(3) Excludes Olinas Mall, the acquisition of which by CMA was completed in Jul 2012.
34 CapitaLand Presentation September 2013Shopping Malls
China: Strong Growth in NPI Yields of
Operational Malls
Total tenants’ sales growth of +14.9% and +9.5% on psm basis
NPI Yield on Tenants’ Sales
Yield
Cost Effective Cost (%) (psm)
Year of Number of Improvement
(100% basis) Stake in (100% basis) Growth1
Opening Malls
(RMB bil) Cost 1H 1H 1H 2013 1H 2013
2013 2012 vs. 1H 2012 vs. 1H 2012
20052 4 1.2 57.8% 5.8 5.4 +7.1% +14.9%
20063 8 3.0 43.3% 10.1 9.3 +8.8% +3.8%
2007 2 1.8 28.2% 10.3 9.4 +9.6% +11.9%
2008 5 2.9 32.4% 7.8 7.2 +8.9% +17.7%
2009 8 4.0 26.5% 8.1 6.9 +17.4% +9.6%
2010 6 2.5 41.8% 4.4 3.5 +24.2% +4.4%
2011 3 9.2 65.0% 4.6 4.1 +12.3% +18.5%
1H 2013 NPI Yield on Cost Gross Yield on Cost
China Portfolio4 7.3% 11.9%
(1) Tenants’ sales are on a same-mall basis (100%) and exclude sales from supermarkets and department stores.
(2) Excludes Raffles City Shanghai.
(3) Excludes malls under or previously under master lease, namely, CapitaMall Shuangjing, CapitaMall Anzhen, CapitaMall Erqi and
CapitaMall Saihan.
(4) For property components that were opened before 1 Jan 2012.
35 CapitaLand Presentation September 2013Shopping Malls
CapitaMalls Asia
Singapore : Bedok Mall
• Topping up ceremony on 23 May 2013
• On track to open in 4Q 2013
• >90% committed occupancy
36 CapitaLand Presentation September 2013Shopping Malls
CapitaMalls Asia
Singapore : Westgate
• On track to open in 4Q 2013
• >75% committed occupancy
37 CapitaLand Presentation September 2013Shopping Malls
CapitaMalls Asia
CapitaMall Meilicheng, Chengdu
• Opened 28 Apr 2013
• >95% occupancy
• Expected NPI yield of ~5% after 1st year of operation
38 CapitaLand Presentation September 2013Shopping Malls
CapitaMalls Asia
CapitaMall Jinniu (Phase 2), Chengdu
• Opening in 3Q 2013
• ~80% committed occupancy for Phase 2
• CapitaMall Tianfu will open in 2014 to allow chain retailers to pace their
expansion with CMA
Artist’s Impression (subject to change)
39 CapitaLand Presentation September 2013Shopping Malls
CapitaMalls Asia
Latest Acquisition : Grand Canyon Mall in Beijing
• Secured through public tender on
15 July 2013. CapitaRetail China
Trust (CRCT) exercised right of first
refusal to acquire the property¹
• CMA to receive acquisition and
fund management fees as
manager of CRCT
• Attractive addition to CMA’s
portfolio; enhances CMA’s leasing
network and market share in Beijing
• Reserves CMA’s balance sheet
capacity for other opportunities Strategically located along the South 3rd ring west road in
Fengtai District and 5-min walk from subway station Line 4
(1) This is pursuant to CMA’s agreement with CRCT dated 8 Nov 2006, which granted CRCT a right of first refusal over future completed retail
properties located in China which are identified for acquisition by CMA or its subsidiaries. Subject to government approvals and
securing financing.
40 CapitaLand Presentation September 2013Business Highlights
- The Ascott Limited
Ascott Huai Hai Road Shanghai, China
41
41Serviced Residence
The Ascott Limited
Repositioned Citadines Louvre Paris
• Into a boutique-style luxury residence
after asset enhancement &
rebranding initiatives
• Reopened as Citadines Suites Louvre
Paris
• ADR uplifted ~40%
Exclusive Suite Royale Suite
Repositioned Ascott Beijing
• From serviced residences (Ascott
Beijing) to branded residences for
strata sale – First branded residence in
China
• Post strata sale, property to be
managed as Ascott Private Residence
• Prime location in the centre of Beijing
CBD, Jianguo Road Ascott Private Residence
42 CapitaLand Presentation September 2013Serviced Residence
The Ascott Limited
Business Updates
• Active recycling to Ascott REIT CHINA
- Total sale consideration of 3
serviced residences in China and
11 rental housing properties in
Japan at S$165.0 million
- Completion of divestment on
28 June 2013 Citadines
Somerset Heping Citadines
Shenyang Biyun Xinghai
Shanghai Suzhou
JAPAN
Actus Big Palace Kita Grand Grand Gravis Gravis Gravis Court Grand Grand Grand Grand
Hakata 14jo Mire Mire Court Court Nishi- E’terna E’terna Saga
Miyamachi E’terna E’terna
V-Tower Shintera Kakomachi Kokutaiji haraekimae Saga Idaidori
Nijojomae Chioninmae
43 CapitaLand Presentation September 2013Serviced Residence
The Ascott Limited
Serviced Residence Performance
• New management contracts across China,
The Philippines, India and Middle East
- Secured 8 new contracts for 1,435 units in
2Q 2013
- Expanded footprint to Saudi Arabia
- First Ascott-branded serviced residence in India Ascott Ireo City Gurgaon
• Overall RevPAU remained stable at S$123 for
2Q 2013
- Growth in Europe (+3%)
- Achieved hospitality management and service
fee income of S$32 million for managing global
Ascott Olaya Riyadh
portfolio
44 CapitaLand Presentation September 2013Serviced Residence
The Ascott Limited
Business Updates – Cont’d
• Ascott conferred Business Superbrand
status in Singapore
- Internationally recognised accolade
- First serviced residence to receive this
recognition
• Ascott launched new web and mobile
reservation facilities
- User-friendly search functions, filters
and reservation options
- Searching for property has become
faster and more convenient
45 CapitaLand Presentation September 2013Business
Highlights -
Regional
Investments
Mulberry Lane, Hanoi, Vietnam
46
46Financial Products & Services And Regional Investments
Regional Investments
Australand
• Completion of strategic review on 22 July 2013
• Australand will remain a key investment of CapitaLand
• Source of stable stream of recurring income for CapitaLand
Others
• Japan
- The Parkhouse Nishi Azabu sold 162 (85%) out of 191 units as at 30 June
2013
• StorHub
- Increased stake from 62% to 100%
- Acquired Big Orange Self Storage Singapore
• Sale of entire indirect one third interest in investment properties in United
Kingdom
47 CapitaLand Presentation September 2013Financial Products & Services And Regional Investments
Regional Investments (Cont’d)
Vietnam
• Improvement in residential sales (as of 30 Jun
2013): Mulberry Lane sold 65 apartments; The
Vista sold 25 apartments
• The Vista
- Focus to sell the remaining units and leasing of
the commercial space
• Mulberry Lane Mulberry Lane, Hanoi
- Expect to handover Phase 1 (3 blocks) in 4Q
2013
• ParcSpring
- Phase 1 construction on schedule. Expected to
complete by 1Q 2014
• Continue to hold and develop the remaining 3
projects when market is ready The Vista, Ho Chi Minh City
48 CapitaLand Presentation September 2013Financials &
Capital
Management
One George Street, Singapore
49Financials
Financial Performance for 2Q 2013
2Q 2013 PATMI Down 0.7% To S$383.1 million; Up 6.5% To S$410.8 million
excluding one-off loss incurred from CB repurchase
2Q 2012 2Q 2013 Change
(S$’million) %
Revenue 862.5 1,182.7 37
EBIT 719.9 690.4 4
PATMI 385.9 383.1 1
Operating Profits1 90.3 108.0 20
Portfolio Gains 89.2 61.0 32
Revaluation Gains
206.4 214.1 4
/Impairments
(1) Excluding the S$27.7 million one-off loss incurred on repurchase of convertible bonds, operating profits for 2Q 2013
would be S$135.7 million; 50% higher than 2Q 2012
50 CapitaLand Presentation September 2013Financials
Financial Performance for 1H 2013
1H 2013 PATMI Up 10% To S$571.3 million; Up 15.4% To S$599.0 million
excluding one-off loss incurred from CB repurchase
1H 2012 1H 2013 Change
%
(S$’million)
Revenue 1,503.6 1,844.6 23
EBIT 1,051.3 1,076.5 2
PATMI 519.1 571.3 10
Operating Profits1 168.6 241.3 43
Portfolio Gains 118.0 108.5 8
Revaluation Gains 232.5 221.5 5
/Impairments
(1) Excluding the S$27.7 million one-off loss incurred on repurchase of convertible bonds, operating profits for 1H 2013
would be S$269.0 million; 60% higher than 1H 2012
51 CapitaLand Presentation September 2013Financials
1H 2013 PATMI Analysis
Balanced PATMI Composition
41% (2%)
19%
1
(1) Excluding the impact of $27.7 million one-off loss incurred on repurchase of convertible bonds, operating PATMI for 1H 2013 would
be $269.0 million; 60% higher than 1H 2012
52 CapitaLand Presentation September 2013Financials
EBIT by SBUs – 1H 2013
Operating Portfolio Revaluation Total
EBIT Gain Gain/
(S$’million) Impairment
CapitaLand Singapore1 227.1 - 31.6 258.7
CapitaLand China2 104.4 52.9 57.1 214.4
CapitaMalls Asia 185.8 31.7 186.0 403.5
Ascott 36.0 17.0 0.1 53.1
Corporate & Others3 112.34 3.2 31.3 146.8
TOTAL EBIT 665.6 104.8 306.1 1,076.5
(1) Includes residential businesses in Malaysia
(2) Excludes Retail and Serviced Residences in China
(3) Includes Australand, Surbana(Consultancy), StorHub, Financial Services and other businesses in Vietnam, Japan, UK and GCC
(4) Includes $33.1 million one-off loss incurred on repurchase of convertible bonds
53 CapitaLand Presentation September 2013Financials
EBIT by Geography – 1H 2013
Operating Portfolio Revaluation Total
Profits Gain Gain/
(S$’million)
Impairment
Singapore 321.9 (4.9) 122.4 439.4
China1 145.2 94.4 154.5 394.1
Other Asia2 58.3 15.3 3.7 77.3
Europe 4.2 - 3.3 7.5
Australia 136.0 - 22.2 158.2
TOTAL EBIT 665.6 104.8 306.1 1,076.5
(1) China including Hong Kong
(2) Excludes Singapore and China and includes projects in GCC
54 CapitaLand Presentation September 2013Financials
Balance Sheet & Liquidity Position
FY 2012 1H 2013
Equity (S$ billion) 19.4 20.0
Cash (S$ billion) 5.5 5.2
Net Debt (S$ billion) 8.7 9.0
Net Debt/Equity 0.45 0.45
% Fixed Rate Debt 77% 72%
Ave Debt Maturity(Yr)1 3.7 3.6
(1) Based on put dates of Convertible Bond holders
55 CapitaLand Presentation September 2013Capital Management
Prudent Capital Management
Evenly Spread Maturities (As at June 2013)
(2)
(1)
650
0.7 (3)
Recent Exercise Shaved Off Maturity Towers And Reduced
Annual Interest Expense By ~ S$18 million
(1) Refers to buyback of S$493 million of existing S$1.3 billion 3.125% convertible bonds due 2018
(2) Refers to buyback of S$229 million of existing S$1.2 billion 2.875% convertible bonds due 2016
(3) Refers to issuance of new S$650 million 1.85% convertible bonds maturing in 2020 and repayment of S$72 million of debt
56 CapitaLand Presentation September 2013Conclusion
Six Battery Road, Singapore
57 CapitaLand Presentation May 2013Conclusion
Pre-Eminent Real Estate Company In Asia
Capital
Core 8% to 12% ROE
Sharper focus allocation to
competencies target on a
on core achieve
and strong sustainable
businesses competitive
track record basis
scale
Underlying Trends In Core Markets Of Singapore And
China Are Intact
58 CapitaLand Presentation September 2013Thank you For enquiries, please contact: Harold Woo, Senior Vice President, Investor Relations DID (65) 68233 210 Email : harold.woo@capitaland.com
Supplementary
     slides

                     Capital Tower, Singapore
60
Asset Allocation
New Investments of S$1.6 billion (YTD July 2013)
New Investments Reinforce Singapore And China Markets Focus
Investment
Stake Total GFA
Project Name SBU Geography Project Type Amt4
(%) (Sqm.)
(S$M)
Grand Canyon Mall CMA/CRCT5 100% China Shopping Mall 70,000 373.01
Hanzhonglu Site, Mixed
CLC 70% China 110,000 397.53
Shanghai Development
Mixed
Danga Bay Project CLS 51% Malaysia 1,021,925 324.02
Development
37,441
Coronation Road Site CLS 100% Singapore Residential 366.02
(site area)
Big Orange Self Storage
CL 100% Singapore Self Storage - 91.83
Singapore
(1)Project Development Expenditure (2) Land cost only (3)Acquisition price of company (4) Based on a 100% basis
(5) CMA secured Grand Canyon Mall through public tender on 15 Jul. 2013. CapitaRetail China Trust (CRCT) exercised the right of first refusal to acquire
the property. This is pursuant to CMA’s agreement with CRCT dated 8 Nov. 2006, which granted CRCT a right of first refusal over future completed retail
properties located in China which are identified by CMA or its subsidiaries. Subject to government approvals and securing financing
61 CapitaLand Presentation September 2013Asset Allocation
Asset Matrix - Diversified Portfolio excluding
Treasury cash as at 30 June 2013
S'pore China 1 Aust Other Europe Total
Asia 2
S$'M S$'M S$'M S$'M S$'M S$'M
CapitaLand Singapore 6,241 - - 59 - 6,300
CapitaLand China - 8,644 - - - 8,644
CapitaMalls Asia 4,777 4,678 - 1,432 - 10,887
Ascott 678 809 213 588 1,050 3,338
Corporate & Others3 490 302 5,233 873 47 6,945
Total 12,186 14,433 5,446 2,952 1,097 36,114
(1) China including Hong Kong
( 2) Excludes S’pore and China and includes projects in GCC
(3) Includes Australand, Surbana(Consultancy), StorHub, Financial Services and other businesses in Vietnam, Japan, UK and GCC
62 CapitaLand Presentation September 2013Financials
Group Managed Real Estate Assets1 of S$67.9b
As at 30 Jun 2013
Group Managed RE Assets
(S$’billion)
On Balance Sheet & JVs 24.8
Funds 15.0
REITs/Trusts 22.2
Others2 5.9
Total 67.9
(1) Group Managed Real Estate Assets is the value of all real estate managed by CapitaLand Group entities stated at 100% of the
property carrying value.
(2) Others include 100% value of properties under management contracts.
63 CapitaLand Presentation September 2013Financials
Revenue Under Management
$’billion
1
(1) Revenue Under Management : Revenue of all properties managed by the Group
64 CapitaLand Presentation September 2013Financial Products & Services
Financial Products
No. of No. of PE Funds* REITS^ Total AUM#
SBU
Funds REITs (S$ billion) (S$ billion) (S$ billion)
CL Singapore 0 2 - 7.4 7.4
CL China 7 0 7.7 - 7.7
CMA 6 3 6.8 12.8 19.6
Ascott 2 1 1.4 3.2 4.6
Others 2 0 0.1 0.0 0.1
Total 17 6 16.0 23.4 39.4
Total Assets Under Management (AUM) – S$39.4b
PATMI contribution of REIT/Fund Management Fees@ –
S$29.3m for 2Q 2013
* Denotes Capital Drawn Down ^ Denotes Total Assets Managed # AUM As at 30 Jun 2013
@ Total REITS/Fund Management Fees earned in 2Q 2013 is S$87.0m
65 CapitaLand Presentation September 2013Singapore Residential
Singapore Residential - Sales and Construction Progress1
% Completed
Units
PROJECT Total Units Units Sold
Launched As at Jun 2013
Launched in 2007
The Orchard Residences 175 175 165 100%
Launched in 2008
The Wharf Residence 186 186 182 100%
Launched in 2009
The Int erlace 1040 1040 824 95%
Urban Suit es 165 165 165 100%
Launched in 2010
d'Leedon 1715 1500 1391 62%
Launched in 2011
Urban Resort 64 64 36 100%
Bedok Residences 583 583 559 20%
Launched in 2012
Sky Habit at 509 250 166 27%
1 Figures might not correspond with income recognition
66 CapitaLand Presentation September 2013Singapore Commercial
CapitaLand Singapore
CCT Portfolio Performance
• Signed new leases and renewals of approximately 191,700 sqft for 2Q 2013,
of which 42% are new leases
CCT's Grade A properties' effective rents
$12.00
compared to Grade A market rent ($psf)
$11.50
$11.00
$10.99
$10.50 $10.66 $10.61
$10.60
$10.00 $10.23
$10.10 $9.93
$9.78
$9.50 $9.80
$9.58 $9.55 $9.55
$9.00
$8.50
$8.00
1Q12 2Q12 3Q12 4Q12 1Q13 2Q13
CCT's Grade A properties' effective rent for new and renewal leases, not weighted for size of tenant
CBRE Grade A Market Rent, not weighted for size of tenant
Note:
(1) Source for Grade A market rent: CBRE Pte. Ltd.
67 CapitaLand Presentation September 2013Singapore Commercial
CapitaLand Singapore
CCT Asset Enhancement Initiatives
Property Cost of AEI Projected Areas of Work Schedule
(S$’million) ROI
Capital Tower S$40.0 7.8% Common areas, 4Q 2013 – 2Q
restrooms, main lobby 2015
and modernisation of
technical
specifications
Raffles City S$34.7 8.6% Common areas, 4Q 2012 – 2Q
Tower restrooms, main lobby 2014
and drop-off area
Six Battery S$92.0 8.1% Lettable area, 4Q 2010 – 4Q
Road common areas, 2013
restrooms, main lobby
and modernisation of
technical
specifications and
green features
68 CapitaLand Presentation September 2013Singapore Commercial
Island-wide new office supply not excessive;
CBD new supply back-end loaded
Net supply in CBD Forecast average annual new supply
(2013 to 2017): 1.3 mil sq ft
3.5
2.9 2.9
3.0
2.5
2.0
sq ft million
1.5 1.5
1.5 1.2
0.9 0.8
1.0
0.5 0.3
0.1 0.0
0.0
2007 2008 2009 2010 2011 2012 2013F 2014F 2015F 2016F 2017F
-0.5
-0.4
-1.0 CBD net supply CBD forecast new supply
Central Business District (CBD)
Average annual net supply 1.1 mil sq ft (1993 – 2012)
Average annual net absorption 1.0 mil sq ft (1993 – 2012)
1.6 mil sq ft (2010 – 2012)
Source: URA, JLL, CBRE (URA: 1Q 2013 figures were used as 2Q 2013 figures are not released yet. JLL and CBRE: based on 2Q
2013 market reports)
69 CapitaLand Presentation September 2013Singapore Commercial
Island-wide new office supply not excessive;
Decentralized new supply declining
Net supply in Decentralised Area (1)
3.50
Forecast average annual
3.00
new supply (2013 to 2016):
2.50 0.4 mil sq ft
sq ft million
2.00
1.50 1.3
1.00
0.7 0.6
0.4
0.50 0.3
0.04 0.07 0.09 0.04
0.00
2007 2008 2009 2010 2011 2012 2013F 2014F 2015F
Decentralised Area net supply Decentralised Area forecast new
supply
Decentralised Area
Average annual net supply 0.3 mil sq ft (2007 – 2012)
Average annual net absorption 0.3 mil sq ft (2007 – 2012)
(1) Decentralized office market supply projections exclude JEM and strata developments.
Source: CBRE Research (2Q2013 figures)
70 CapitaLand Presentation September 2013China Residential
Residential/ Trading Sales & Completion Status
Projects Units CL % of launched Average Selling Expected Completion for launched units
1 2
launched effective sold Price
stake
% As at Jun 2013 RMB/Sqm 2Q 2013 3Q 2013 4Q 2013 2014 & Beyond
SHANGHAI
The Pinnacle – South Plot (Blk 1, 2, 3, 4 and 5) 297 80% 100% 34,998 297 0 0 0
Paragon – Blk 1, 2 and 3 116 99% 57% 114,699 0 116 0 0
KUNSHAN
The Metropolis – Phase 1C (Blk 16) 88 100% 0 0 88 0
The Metropolis – Phase 1C (Blk 11, 12 and 13) 448 78% 0 0 0 448
The Metropolis – Total 536 70% 82% 11,943 0 0 88 448
HANGZHOU
Imperial Bay – Blk 4, 5 and 6 190 64% 0 84 106 0
4
Imperial Bay – Blk 1, 2 and 3 234 84% 0 0 0 234
Imperial Bay – Total 424 50% 75% 26,978 0 84 106 234
NINGBO
The Summit Executive Apartments 180 50% 13% 24,524 180 0 0 0
BEIJING
Beaufort – Phase 2 220 100% 39,318 220 0 0 0
Beaufort – Phase 3 228 100% 45,269 0 0 228 0
Beaufort – Total 448 50% 100% 220 0 228 0
TIANJIN
International Trade Centre 399 100% 43% 20,034 0 0 0 399
WUHAN
3
Lakeside 188 100% 7% 5,129 0 0 0 188
GUANGZHOU
Dolce Vita – Phase 1 (C5 to C6) 248 99% 0 0 248 0
Dolce Vita – Phase 1 (C7 to C8) & Phase 2 (D1 to D3) 320 95% 0 0 0 320
Dolce Vita – Total 568 48% 97% 14,098 0 0 248 320
FOSHAN
La Cite – Blk 1, 4 and 8 254 100% 44% 9,091 0 0 254 0
SHENZHEN
i Park – Blk B 240 99% 0 0 240 0
i Park – Blk A 208 100% 0 0 0 208
i Park – Total 448 73% 99% 34,694 0 0 240 208
CHENGDU
The Loft – Blk 17, 18 and 19 551 91% 445 0 106 0
4
The Loft – Blk 14, 25, 26 and 27 596 70% 0 0 596 0
The Loft – Total 1,147 56% 81% 8,428 445 0 702 0
TOTAL 5,005 76% 1,142 200 1,866 1,797
(1) % sold: units sold (Options issued as of 30 Jun 2013) against units launched.
(2) Average selling price (RMB) per sqm is derived using the area sold and sales value achieved (including options issued) in the quarter last transacted.
(3) Launches from new projects in 2Q 2013, namely Lakeside: 188 units.
(4) Launches from existing projects in 2Q 2013, namely The Loft: 393 units and Imperial Bay: 36 units and relaunched 70 units of The Metropolis
71 CapitaLand Presentation September 2013Raffles City
CapitaLand China
Raffles City Hangzhou – Construction Progressing On Track
Reached Level 9 for podium
Raffles City Hangzhou
Target Opening in 2015
Reached Level 17 for Tower 1
72 CapitaLand Presentation September 2013Raffles City
CapitaLand China
Raffles City Shenzhen – Construction Progressing On Track
Phase 1 / iPark : 97% construction completed
Raffles City Shenzhen
Target Opening in 2016
Phase 2 / Raffles City Shenzhen -
Basement work in progress
73 CapitaLand Presentation September 2013Raffles City
CapitaLand China
Raffles City Changning – Construction Progress On Track
Raffles City Changning
Target Opening in 2016 Basement work in progress
Raffles City Chongqing – Commencement of Construction
Raffles City Chongqing
Excavation and lateral work commenced in Jul 2013
Target Opening in 2018
74 CapitaLand Presentation September 2013Shopping Malls
CapitaMalls Asia
Pipeline of Malls Opening In The Next 3 Years
No. of Properties as of 15 Jul 2013
Country Target to be
Operational Target to be Target to be Total
opened in
opened in 2013 opened in 2014
2015 & beyond
Singapore 17 2 - - 19
China 511 -2 23 8 61
Malaysia 5 - - 1 6
Japan 8 - - - 8
India 2 1 2 4 9
Total 83 3 4 13 103
(1) Including CapitaMall Meilicheng, Chengdu, which opened on 28 Apr 2013, and CapitaMall Grand Canyon, Beijing, which
was acquired by CMA on 15 Jul 2013.
(2) Not including CapitaMall Jinniu Phase 2, Chengdu.
(3) Including CapitaMall Tianfu, Chengdu and CapitaMall 1818, Wuhan, but not including CapitaMall Fucheng Phase 2,
Mianyang
75 CapitaLand Presentation September 2013Serviced Residence
The Ascott Limited
Ongoing Asset Enhancement Initiatives At Ascott Jakarta
• Includes renovation for apartments, main
lobby and corridor
• First BCA Green Mark(1) certified service
residence in Indonesia
• Estimated 20% uplift in ADR
(1) BCA Green Mark Certification (provisional) is awarded by Building
and Construction Authority of Singapore
76 CapitaLand Presentation September 2013Serviced Residence
2Q 2013 RevPAU Performance
S$ -3% Performance was affected Decrease was due to
by nearby construction depreciating JPY.
activities and weaker In local currency terms,
demand from project RevPau increased by 3%
groups
+3% -7%
-4%
-2%
Same-store– Numbers include all serviced residences owned, leased and managed
RevPAU – Revenue per available unit
Foreign currencies are converted to S$ at respective period’s average rates
77 CapitaLand Presentation September 2013Serviced Residence
RevPAU Performance YTD June 2013
Performance was affected
Decrease was due to
S$ -6% by nearby construction
depreciating JPY.
activities and weaker
demand from project In local currency terms, RevPau
groups increased by 2%
+3% -2%
-5%
+3%
Same-store– Numbers include all serviced residences owned, leased and managed
RevPAU – Revenue per available unit
Foreign currencies are converted to S$ at respective period’s average rates
78 CapitaLand Presentation September 2013Serviced Residence
The Ascott Limited’s Portfolio: 22,383 units operational &
9,838 under development (As at 30 June 2013)
ART ASRCF Owned Minority Owned 3rd Party Managed Leased Total
Singapore 868 195 70 1,133
Indonesia 401 1,810 2,211
Malaysia 255 221 1,338 1,814
Philippines 528 937 1,465
Thailand 651 1,091 1,742
Vietnam 818 132 891 1,841
STH EAST ASIA TOTAL 2,615 387 872 6,262 70 10,206
China 1,258 1,765 154 5,245 36 8,458
Japan 1,895 429 888 283 3,495
South Korea 410 410
NORTH ASIA TOTAL 3,153 1,765 583 888 5,938 36 12,363
India 1,376 450 96 1,922
SOUTH ASIA TOTAL 1,376 450 96 1,922
Australia 84 414 175 673
AUSTRALASIA TOTAL 84 414 175 673
United Kingdom 600 230 136 966
France-Paris 994 106 293 516 1,909
France-Outside Paris 677 1 670 1,348
Belgium 323 323
Germany 430 293 723
Spain 131 131
Georgia 66 66
EUROPE TOTAL 3,155 629 360 1,322 5,466
U.A.E 118 118
Saudi Arabia 532 532
Bahrain 118 118
Qatar 429 429
Oman 394 394
GULF REGION TOTAL 1,591 1,591
SERVICED APARTMENTS 7,404 1,765 2,912 872 13,266 1,629 27,848
CORP LEASING TOTAL 1,603 477 888 1,335 70 4,373
GRAND TOTAL 9,007 1,765 3,389 1,760 14,601 1,699 32,221
79 CapitaLand Presentation September 2013You can also read